 Open Access Article
Adsorption and photocatalytic degradation of gas-phase UDMH under simulated sunlight by AgBr/TiO2/rGA
Hou Ruomeng ,
Jia Ying*,
Lv Xiaomeng,
Huang Yuanzheng and
Shen Keke
High-Tech Institute of Xi'an, Xi'an 710025, China. E-mail: jyingsx@163.com; Tel: +86-9178744251
First published on 31st March 2021
Abstract
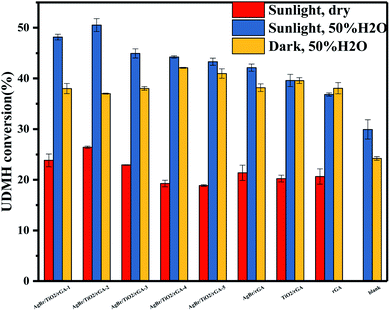
The degradation of UDMH has long been a concern for its harmful effects on humans and the environment. The current research on gas-phase UDMH treatment is limited and mainly focuses on ultraviolet light and high temperature environments, however the highly toxic substance NDMA is easily produced. In order to investigate the possibility of UDMH degradation in sunlight, AgBr/TiO2/rGA composites were prepared with the addition of different amounts of silver bromide. The highest UDMH conversion of AgBr/TiO2/rGA in humid air is 51%, much higher than the control group value of 24%, which can be ascribed to the synergy of adsorption and photocatalysis. The graphene and silver in AgBr/TiO2/rGA not only enhance the adsorption of light and UDMH, but also inhibit charge recombination and enhance electron–hole separation. More importantly, the temperature of the AgBr/TiO2/rGA composite was raised by the photothermal effect of graphene with promoted UDMH degradation efficiency. Furthermore, it is noted that NDMA was not detected in the optimal conditions.
1. Introduction
Unsymmetrical dimethylhydrazine (UDMH) is the main fuel of liquid propellants in rocket and missile engines widely used in the national defense and aerospace industry. The UDMH gas produced during use and storage is in urgent need of treatment due to its toxic, malodorous, mutagenic and carcinogenic nature.1,2 In the past years, much research has been done to solve the problem. Z. R. Ismagilov3 realized the deep catalytic oxidation of UDMH by CuxMg1−xCr2O4/Al2O3, which produced high yields of CO2 and low yields of NOx in a temperature range of 150–400 °C. Kolinko4 studied the gas phase photocatalytic oxidation of UDMH using a photocatalyst in a batch reactor under UV light with a stable performance. In the traditional method, high temperature or pressure is used to treat gas phase UDMH and the degradation of gas-phase UDMH by photocatalysts is carried out under UV light. However, the degradation of UDMH at normal temperature and pressure under visible light saves energy and is convenient and therefore deserves to be studied for practical use. In the degradation products, NDMA (N-nitrosodiethylamine) is a highly carcinogenic substance, which can generate spontaneously when UDMH is just exposed to natural conditions.5 The NDMA level increases obviously in the common methods for UDMH degradation, such as the addition of ozone or irradiation under ultraviolet light. Therefore, the NDMA level deserves the attention of researchers.In the methods of degradation of gaseous pollutants, adsorption is effective due to the advantages of easy operation, high efficiency, and low cost. Carbon-based materials like graphene, graphene oxide (GO), and reduced graphene oxide (rGO) have received worldwide attention because of their unique structure and properties. Graphene possesses a two-dimensional planar hexagonal structure with a large specific surface area and good chemical stability, which is suitable for use as an adsorbent.6 Furthermore, graphene can also serve as the electron transport medium in the photocatalytic reaction for high electron mobility.7–9
In practice, the synergistic effect of adsorption and photocatalysis should be emphasized to obtain high gas degradation efficiency. TiO2, as an efficient photocatalyst, is widely used in environmental applications because of its wide bandgap, low cost, high chemical stability, and non-toxic properties.10,11 However, its photocatalytic properties are limited by the high recombination rate of the photogenerated carrier.12 Graphene, as a cocatalyst, can combine with TiO2 by a Schottky junction as the Fermi level of graphene is lower than TiO2 and electrons can transfer from TiO2 to graphene. Jiang13 synthesized a graphite oxide/TiO2 composite, which showed 7.4 and 5.4 times higher degradation rates for methyl orange and the photo-reductive conversion rate of Cr(VI) than P25. Nowadays, the development of visible-light photocatalysts is emerging as an important research direction to make full use of solar energy. Silver bromide (AgBr) is a kind of semiconductor with a bandgap of 2.6 eV. Metallic Ag0 produced in the process may act as a cocatalyst to enhance the photocatalytic activity of TiO2. Silver nanoparticles could have a strong absorption of photon energy, and a local plasma resonance phenomenon would occur when the frequency of incident light matches the vibration frequency of silver under irradiation. The efficiency of light adsorption and electron transportation will increase through the SPR effect of Ag. In previous research, Ag–AgBr/TiO2/rGO was fabricated to degrade penicillin G under white LED irradiation. The composite could be photoexcited by visible light with wavelengths extending up to 600 nm.14
Here we prepared AgBr/TiO2/reduced graphene oxide aerogels (rGA) by hydrothermal reduction and then used the precipitation method to degrade gas-phase UDMH under simulated sunlight. The composites were characterized and the effect of humidity on UDMH degradation was evaluated with different contents of AgBr. The promotion effect of the photothermal process was also investigated. The possible degradation mechanisms and routes were proposed based on the characteristic results and chromatographic data.
2. Experimental section
2.1 Synthesis
![[thin space (1/6-em)]](https://www.rsc.org/images/entities/char_2009.gif) :
:![[thin space (1/6-em)]](https://www.rsc.org/images/entities/char_2009.gif) 10) and DI water several times. The supernatant was then removed by centrifugation to obtain a brown slurry. Then the slurry was dissolved in DI water by ultrasonication with a concentration of 2 g L−1.
10) and DI water several times. The supernatant was then removed by centrifugation to obtain a brown slurry. Then the slurry was dissolved in DI water by ultrasonication with a concentration of 2 g L−1.2.2 Characterizations
The phase structures of the samples were analyzed by X-ray diffraction (XRD) with Cu Kα radiation (λ = 0.15401 nm) at a generator voltage of 40 kV and a current of 40 mA (D/max 2600, ISUZU, Japan). Analysis was performed under a 2θ range of 5.0–85.0° and at a scanning rate of 0.02° per second. The surface morphologies were characterized using a transmission electron microscopy (TEM) system (TecnaiG2F20, FEI, USA) and a scanning electronic microscopy (SEM) system (VEDAIIXMUINCN, TESCAN, Czech Republic) equipped with an energy dispersive X-ray spectroscopy (EDS) system. Raman spectra were taken using Ar+ (532 nm) laser excitation (in Via Reflex, Renishaw, England). The spectra were taken in the range 100–3200 cm−1. The surface functional groups were analyzed by Fourier transform infrared (FT-IR) (NEXUS, Nicolet, USA) in the transmittance mode with the spectral range of 400–4000 cm−1. X-ray photoelectron spectroscopy (XPS) measurements were performed by a Thermo Scientific ESCA Lab250 spectrometer with an Al Kα X-ray source. All binding energy values were corrected by calibrating the C 1s peak at 284.8 eV. The Brunauer–Emmett–Teller (BET) specific surface area and porosity of the samples were evaluated based on nitrogen adsorption isotherms measured at 77 K using a gas adsorption apparatus (TriStar II 3020, micromeritics, USA). All the samples were degassed at 180 °C before the nitrogen adsorption measurements. The stability of the samples and contents of each component were determined by TGA/DSC (SDT-Q600, TA, USA) in the air with a heating rate of 20 °C min−1. UV-vis DRS spectra were recorded on a UV-vis spectrophotometer (UV-3600, Shimadzu, Japan) equipped with an integrating sphere assembly. PL measurements were performed with the excitation wavelength of 325 nm using a fluorescence spectrophotometer (FLS1000, Edinburgh, England).2.3 Photocatalytic activity
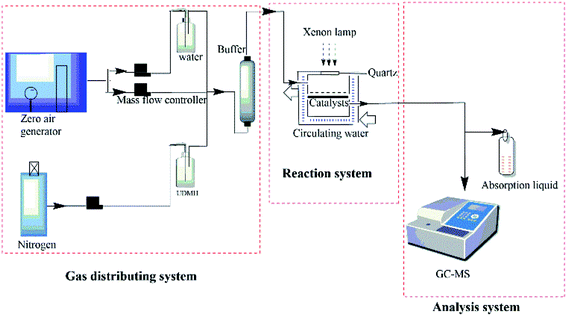
The photocatalytic degradation of UDMH was conducted in a stainless steel cylindrical reactor with a quartz window right on the reactor under the irradiation of Xenon lamp (150 W power, AHD). A quartz tank with a sand-plate was put in the reactor and 30 mg of catalyst was placed on the sand-plate. The distance between the sample and lamp was 12.7 cm. The reaction device was cooled by circulating water and the temperature was controlled by a heating plate at the bottom of the reactor. A schematic diagram of reaction system is shown in Fig. 2. UDMH was put in a refrigerator purged by nitrogen. Water vapor was generated by bubbling purified air provided by an air compressor. The flow of UDMH, water vapor and purified air at a total flow rate of 0.6 L min−1 were adjusted with a mass flowmeter and then mixed well in a buffer bottle. The duration time of each experiment is 60 min after equilibrium. The concentration of UDMH was measured by a gas chromatograph (Clarus 680, PerkinElmer, USA)-mass spectrometer (Clarus SQ 8T, PerkinElmer, USA). The degradation gas was periodically transferred into a sampling loop (500 μL) via a ten-way valve and separated through a capillary column (Elite-WAX, PerkinElmer) with an inner diameter of 0.25 mm and a length of 2 m. The oven temperatures were programmed as follows: firstly, the initial temperature of 50 °C was maintained for 1 min, then it was increased to 100 °C at a rate of 20 °C min−1 and maintained for 1 min. Finally, it was increased to 180 °C at a rate of 10 °C min−1 and maintained for 1 min. Conversion of UDMH was defined as the following:| Conversion (%) = (UDMHinlet − UDMHoutlet)/UDMHinlet × 100% |
3. Results and discussion
3.1 Microstructure and chemical composition
The crystal structures of GO, TiO2/rGA, AgBr/rGA, and AgBr/TiO2/rGA were characterized by XRD in Fig. 3. The diffraction peaks at 10.9° in GO represent oxidized graphite corresponding to the (001) plane.16 The d-spacing value of GO calculated using Bragg's law (2d![[thin space (1/6-em)]](https://www.rsc.org/images/entities/char_2009.gif) sin
sin![[thin space (1/6-em)]](https://www.rsc.org/images/entities/char_2009.gif) θ = nλ) is 0.76 nm based on the (001) reflection plane. The wide diffraction peak at around 26.5° in rGA can be attributed to the high stripping of graphene. The d-spacing decreased to 0.336 nm due to the reduction of oxygen-containing groups and the overlap of graphene. The main diffraction peaks in AgBr/rGA and AgBr/TiO2/rGA at 2θ values of 26.7°, 30.9°, 44.4°, 55.0°, 64.5°, and 73.3° can be respectively indexed to the (111), (200), (220), (222), (400), and (420) crystal planes of AgBr phase (JCPDS no. 06-0438). What is more, the diffraction peaks of Ag appeared at 38° in AgBr/rGA and AgBr/TiO2/rGA (overlap by TiO2), because the defects on rGA produced in the reduction could reduce Ag+ to metallic Ag.17 The wide peak of rGA at around 26.5° can be recognized in AgBr/rGA, which proves the formation of the composite. The peak of graphene in TiO2/rGA and AgBr/TiO2/rGA is not obvious due to the decreased layer-attacking regularity of graphene nanosheets18 and the relative low content compared with TiO2. The existence of graphene is illustrated in the following SEM, TEM and FTIR. The peaks in TiO2/rGA and AgBr/TiO2/rGA at values of 25.3°, 37.8°, 48.1°, 54.4°, 62.9°, 69.9°, and 74.9° can be respectively indexed to the (101), (004), (200), (211), (204), (220), and (215) planes of the TiO2 anatase phase (JCPDS-21-1272). The co-existence of AgBr and TiO2 does not change the diffraction peak positions of the single component, implying the mutually independent relation during the in situ growth.19 AgBr/TiO2/rGA composites with different amounts of AgBr are compared in Fig. 3b. The diffraction peaks of AgBr become sharp as the contents increased, indicating the increase in grain size and a higher degree of crystallinity. Based on the Scherrer equation (d = kλ/β
θ = nλ) is 0.76 nm based on the (001) reflection plane. The wide diffraction peak at around 26.5° in rGA can be attributed to the high stripping of graphene. The d-spacing decreased to 0.336 nm due to the reduction of oxygen-containing groups and the overlap of graphene. The main diffraction peaks in AgBr/rGA and AgBr/TiO2/rGA at 2θ values of 26.7°, 30.9°, 44.4°, 55.0°, 64.5°, and 73.3° can be respectively indexed to the (111), (200), (220), (222), (400), and (420) crystal planes of AgBr phase (JCPDS no. 06-0438). What is more, the diffraction peaks of Ag appeared at 38° in AgBr/rGA and AgBr/TiO2/rGA (overlap by TiO2), because the defects on rGA produced in the reduction could reduce Ag+ to metallic Ag.17 The wide peak of rGA at around 26.5° can be recognized in AgBr/rGA, which proves the formation of the composite. The peak of graphene in TiO2/rGA and AgBr/TiO2/rGA is not obvious due to the decreased layer-attacking regularity of graphene nanosheets18 and the relative low content compared with TiO2. The existence of graphene is illustrated in the following SEM, TEM and FTIR. The peaks in TiO2/rGA and AgBr/TiO2/rGA at values of 25.3°, 37.8°, 48.1°, 54.4°, 62.9°, 69.9°, and 74.9° can be respectively indexed to the (101), (004), (200), (211), (204), (220), and (215) planes of the TiO2 anatase phase (JCPDS-21-1272). The co-existence of AgBr and TiO2 does not change the diffraction peak positions of the single component, implying the mutually independent relation during the in situ growth.19 AgBr/TiO2/rGA composites with different amounts of AgBr are compared in Fig. 3b. The diffraction peaks of AgBr become sharp as the contents increased, indicating the increase in grain size and a higher degree of crystallinity. Based on the Scherrer equation (d = kλ/β![[thin space (1/6-em)]](https://www.rsc.org/images/entities/char_2009.gif) cos
cos![[thin space (1/6-em)]](https://www.rsc.org/images/entities/char_2009.gif) Θ), the crystallite sizes of the AgBr in AgBr/TiO2/rGA-1, AgBr/TiO2/rGA-2, AgBr/TiO2/rGA-3, AgBr/TiO2/rGA-4, and AgBr/TiO2/rGA-5 were 27 nm, 28 nm, 30 nm, 34 nm and 37 nm, calculated using the (200) plane of AgBr.
Θ), the crystallite sizes of the AgBr in AgBr/TiO2/rGA-1, AgBr/TiO2/rGA-2, AgBr/TiO2/rGA-3, AgBr/TiO2/rGA-4, and AgBr/TiO2/rGA-5 were 27 nm, 28 nm, 30 nm, 34 nm and 37 nm, calculated using the (200) plane of AgBr.
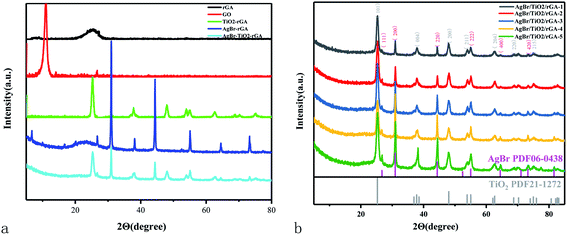 | ||
| Fig. 3 (a) XRD patterns of the samples. (b) XRD patterns of AgBr/TiO2/rGA with different contents of AgBr. | ||
The surface morphologies were characterized by SEM and TEM in Fig. 4. The transparent sheet structure with wrinkles is considered as the surface of GO (Fig. 4a) and only a few layers can be seen (Fig. 4g and h) with the mean d-spacing. The d-spacing between graphite layers calculated from the corresponding diffraction pattern in the TEM image is 0.73 nm, which is similar to the XRD result. The surface of rGA is relatively smooth because the oxygen-containing groups were reduced during the hydrothermal reaction (Fig. 4b). In TiO2/rGA (Fig. 4c), individual graphene sheets are not distinguishable and TiO2 nanoparticles are evenly intermixed with the graphene sheets presumably due to the crosslinking effect of glucose.20,21 In AgBr/rGA (Fig. 4d) and AgBr/TiO2/rGA (Fig. 4e), AgBr particles are distributed uniformly on the graphene sheets because the graphene aerogel inhibits the aggregation of nanoparticles. All the elements including Ag, Br, Ti, O, and C can be found in the EDS of AgBr/TiO2/rGA (Fig. 4f). The atomic percentages of C, O, Ti, Br, and Ag on the surface of AgBr/TiO2/rGA are 47, 33, 14, 3, and 3%, respectively. The exposed crystal face can be inferred from the lattice fringes. The spacings of the lattice fringes in AgBr/TiO2/rGA were 0.352, 0.288 and 0.236 nm (Fig. 4i), which could be assigned to the crystalline planes of anatase TiO2 (101), AgBr (200) and Ag (111), respectively. AgBr and TiO2 are closely related to each other. The above microscopic study provides sufficient evidence in support of the fact that AgBr/TiO2/rGA ternary composites with interfacial contacts were successfully fabricated.
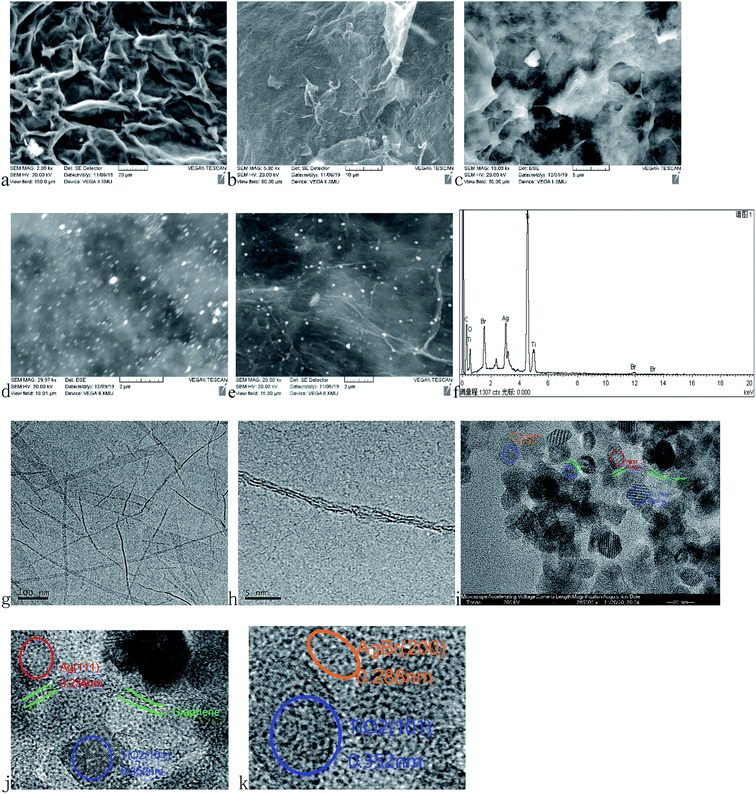 | ||
| Fig. 4 SEM images of (a) GO, (b) rGA, (c) TiO2/rGA (d) AgBr/rGA and (e) AgBr/TiO2/rGA, the EDX pattern of (f) AgBr/TiO2/rGA and TEM images of (g and h) GO and (i–k) AgBr/TiO2/rGA. | ||
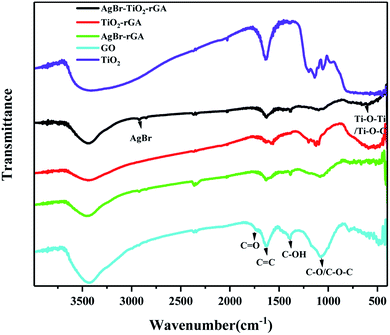
The Fourier transform infrared spectra of the samples are shown in Fig. 5. The characteristic peaks of the carbonyl C![[double bond, length as m-dash]](https://www.rsc.org/images/entities/char_e001.gif) O stretching vibration, C
O stretching vibration, C![[double bond, length as m-dash]](https://www.rsc.org/images/entities/char_e001.gif) C vibration of molecular water, C–OH bending vibration, and C–O stretching vibrations or epoxy C–O–C vibrations appear at 1734, 1616, 1429, and 1080 cm−1 in GO, respectively. The abundant oxygen-containing groups on the surface indicate the good hydrophilicity of GO,22 which make it easy to disperse in water and bond with other elements. In TiO2/rGA, AgBr/rGA and AgBr/TiO2/rGA, the C
C vibration of molecular water, C–OH bending vibration, and C–O stretching vibrations or epoxy C–O–C vibrations appear at 1734, 1616, 1429, and 1080 cm−1 in GO, respectively. The abundant oxygen-containing groups on the surface indicate the good hydrophilicity of GO,22 which make it easy to disperse in water and bond with other elements. In TiO2/rGA, AgBr/rGA and AgBr/TiO2/rGA, the C![[double bond, length as m-dash]](https://www.rsc.org/images/entities/char_e001.gif) O stretching vibration and C–OH bending vibration almost disappear. The change shows the reduction of GO as the XRD revealed. The peak of the C
O stretching vibration and C–OH bending vibration almost disappear. The change shows the reduction of GO as the XRD revealed. The peak of the C![[double bond, length as m-dash]](https://www.rsc.org/images/entities/char_e001.gif) C vibration became weak and wide for the low content of rGA and overlapping occurred with the adsorption band at 1633 cm−1 for the Ti–O–Ti stretching vibration.23 The wide peak between 500–900 cm−1 could be ascribed to Ti–O–Ti and Ti–O–C, which further indicates that a chemical bond formed between TiO2 and graphene.24,25 The peak is the same as shown in TiO2.
C vibration became weak and wide for the low content of rGA and overlapping occurred with the adsorption band at 1633 cm−1 for the Ti–O–Ti stretching vibration.23 The wide peak between 500–900 cm−1 could be ascribed to Ti–O–Ti and Ti–O–C, which further indicates that a chemical bond formed between TiO2 and graphene.24,25 The peak is the same as shown in TiO2.
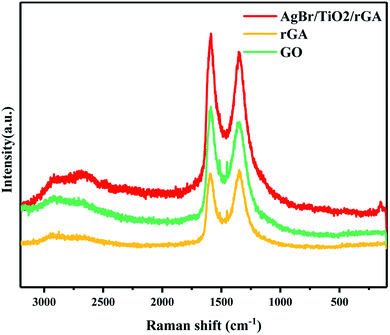
The structures of GO, rGA and AgBr/TiO2/rGA were further characterized by Raman spectra, as presented in Fig. 6. The peaks at about 1350 cm−1and 1590 cm−1 represent the D and G band of graphite, respectively. The D and G band reflect the disorder and in-plane sp2 carbon structure.22 The higher ID/IG value shows that the average size of the in-plane sp2 domains is smaller and the reduction degree of GO is higher.26 The ID/IG value of GO, rGA and AgBr/TiO2/rGA is 0.90, 1.01 and 0.93, respectively. The increased value in rGA and AgBr/TiO2/rGA confirmed the reduction of GO, which could suggest the formation of defects or graphene agglomeration during the reaction.27 Compared with the spectra of pure graphite crystals (1575 cm−1), the peak of the G band shifts to 1587.6 cm−1 in AgBr/TiO2/rGA, which suggests some structural imperfections of the carbon shells.28
The surface components and chemical states of AgBr/TiO2/rGA were investigated by XPS spectra. The full-scale XPS survey spectrum of AgBr/TiO2/GA demonstrates the coexistence of Ti, O, C, Ag and Br, which supports the results of the EDS. The XPS spectrum of Ti 2p for AgBr/TiO2/rGA can be divided into three characteristic peaks at the binding energy of 459.5, 465.1 and 472.65 eV. The peaks at 459.5 and 465.1 eV with a separation of 5.6 eV can be ascribed to Ti4+ in the pure anatase phase,29 which indicates the intact TiO2 in the characteristic crystal structure. The satellite peak of Ti 2p1/2 at 472.65 eV demonstrates a chemical linkage between TiO2 and graphene sheets as the FTIR revealed. The XPS spectra of the Br species in AgBr/TiO2/rGA display the binding energy of Br 3d3/2 and Br 3d5/2 at 67.9 and 68.9 eV, representing the existence of Br−. The high resolution XPS spectrum of O 1s deconvoluted into three peaks, 529.4, 530.2 and 532 eV, which correspond to the Ti–O, C![[double bond, length as m-dash]](https://www.rsc.org/images/entities/char_e001.gif) O and C–OH groups. The energy peaks at 284.8, 285.3 and 286.7 eV for C 1s represent the C–C/C
O and C–OH groups. The energy peaks at 284.8, 285.3 and 286.7 eV for C 1s represent the C–C/C![[double bond, length as m-dash]](https://www.rsc.org/images/entities/char_e001.gif) C, C–OH and C
C, C–OH and C![[double bond, length as m-dash]](https://www.rsc.org/images/entities/char_e001.gif) O groups in AgBr/TiO2/rGA. Notably, the peak intensities for the oxygen-containing groups become lower or diminish compared with the C 1s of GO, which signifies the reduction of GO. The result corresponds with the analysis of Raman and FTIR. The high resolution XPS spectra of Ag 3d display two individual bands assigned to the Ag 3d5/2 and Ag 3d3/2 binding energies, which could be deconvoluted into two new groups of peaks at 367.45 and 368.8 eV and 373.4 and 374.8 eV, respectively. The peaks at 367.45 and 373.4 eV represent Ag+ and the peaks at 368.8 and 374.8 eV are ascribed to Ag0.
O groups in AgBr/TiO2/rGA. Notably, the peak intensities for the oxygen-containing groups become lower or diminish compared with the C 1s of GO, which signifies the reduction of GO. The result corresponds with the analysis of Raman and FTIR. The high resolution XPS spectra of Ag 3d display two individual bands assigned to the Ag 3d5/2 and Ag 3d3/2 binding energies, which could be deconvoluted into two new groups of peaks at 367.45 and 368.8 eV and 373.4 and 374.8 eV, respectively. The peaks at 367.45 and 373.4 eV represent Ag+ and the peaks at 368.8 and 374.8 eV are ascribed to Ag0.
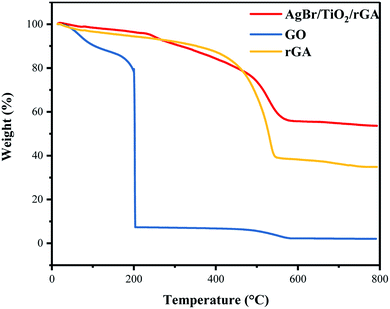
Thermogravimetric analysis (TGA) was carried out to study the thermo-stability of the samples, and the test results are shown in Fig. 8. The mass losses of GO can be divided into two stages: at temperatures below and above 200 °C. This is caused by volatilization of water molecules adsorbed by graphite oxide and the thermal decomposition of oxygen-containing groups in graphite oxide, respectively. The residual content of carbon in rGA is higher than GO. In rGA and AgBr/TiO2/rGA, the transition temperatures rise to 550 °C representing good thermal stability. When the temperature is 800 °C, the mass percentage of the AgBr/TiO2/rGA residue increased to 54% compared with 35% of rGA for the residue of titanium dioxide and silver bromide in AgBr/TiO2/rGA.
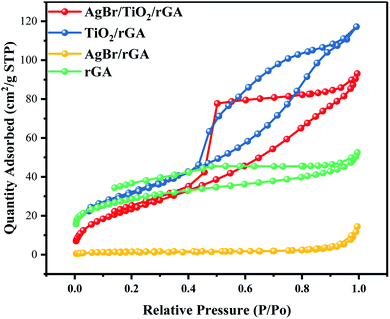
The specific surface area and pore structure were characterized to investigate the internal morphology.30 As shown in Fig. 9, the isotherms of AgBr/TiO2/rGA, TiO2/rGA, AgBr/rGA and rGA resembled the type IV isotherm of IUPAC with a clear hysteresis loop, which indicates the mesoporous structures of the samples.31 In rGA and AgBr/rGA, the H3 hysteretic loop is not in equilibrium when the relative pressure is close to the saturated vapor pressure and the adsorption curve increased sharply, mainly because of the slit-shaped holes formed by the graphene. The surface area of AgBr/rGA is obviously lower as the introduction of AgBr blocks up the holes of the graphene aerogel. TiO2/rGA displays the hysteresis loop with a combination of H2 and H3, possibly caused by homogeneous titanium dioxide and graphene. The surface area of TiO2/rGA is 116.74 m2 g−1, as shown in Table 1, higher than that of rGA. On the one hand, the mesoporous structure in the TiO2/rGA particles is similar to rGA,32 as shown in Fig. 4b and c. On the other hand, graphene aerogels suppress the agglomeration of TiO2.33,34 AgBr/TiO2/rGA has a triangular-shaped adsorption isotherm with the holes mainly in the shape of an ink bottle with some slits. The surface area of AgBr/TiO2/rGA is 91.1082 m2 g−1, and the mesopores of AgBr/TiO2/rGA and the large surface area can provide enough active sites for photocatalysis.
| Composite | SBET (m2 g−1) | Vpore (cm3 g−1) | Dpore (nm) |
|---|---|---|---|
| rGA | 97.6 | 0.08 | 3.33 |
| TiO2/rGA | 116.7 | 0.18 | 4.76 |
| AgBr/rGA | 5.3 | 0.02 | 16.84 |
| AgBr/TiO2/rGA | 91.1 | 0.14 | 6.32 |
3.2 Optical properties
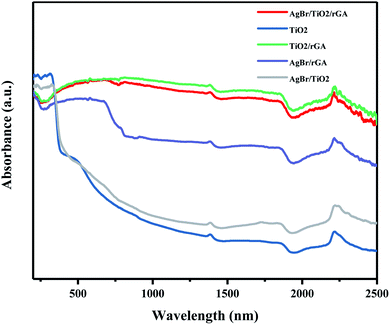
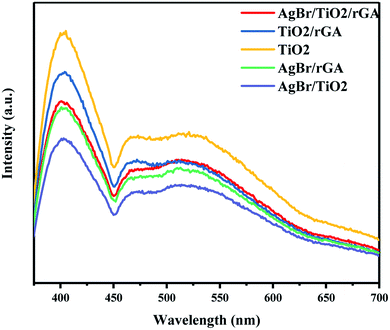
The UV-vis-NIR DRS spectra shown in Fig. 10 were recorded to analyze the light adsorption properties of the samples. TiO2 can absorb short-wavelength UV light and the adsorption in visible light decreases obviously. For AgBr/TiO2, the adsorption edge exhibits a red shift compared with TiO2 because silver bromide has a smaller band gap than titanium dioxide and the SPR effect of silver benefits the visible light adsorption. Compared with AgBr/TiO2, remarkable enhancements of the adsorption ability were observed in AgBr/rGA in the visible-light region because graphene can absorb almost the whole spectrum of solar light due to its black color and zero band gap. The samples containing graphene, like AgBr/TiO2/rGA, TiO2/rGA and AgBr/rGA, show a lower adsorption in UV light, probably because some carbons became doped in the semiconductor and reduced the bandgap. AgBr/TiO2/rGA and TiO2/rGA show a higher adsorption intensity in the visible and infrared light regions for the formation of the Ti–O–C bond. The enhanced optical absorption benefits photocatalytic activity in the simulated sunlight.The photoluminescence (PL) spectra were used to analyze the lifetime and the migration efficiency of the photogenerated charge carrier as shown in Fig. 11. The weaker PL intensity represents the lower electron–hole recombination rate. The PL spectra of TiO2/rGA was lower than TiO2 for the addition of graphene. Graphene, acting as the electron mediator, can efficiently transport and store the photoelectrons produced by TiO2,10 and the separation of the photogenerated electron–hole pairs can be greatly improved. When AgBr was added into TiO2/rGA, the PL intensity further decreased for the formation of a Schottky junction between silver and TiO2 on the surface of the nanocomposite. What is more, the PL intensity of AgBr/TiO2 is lower than TiO2/rGA and AgBr/TiO2/rGA. It can be inferred that the nanosilver can promote the interfacial charge transfer more efficiently than rGA.
3.3 Photocatalytic degradation of UDMH
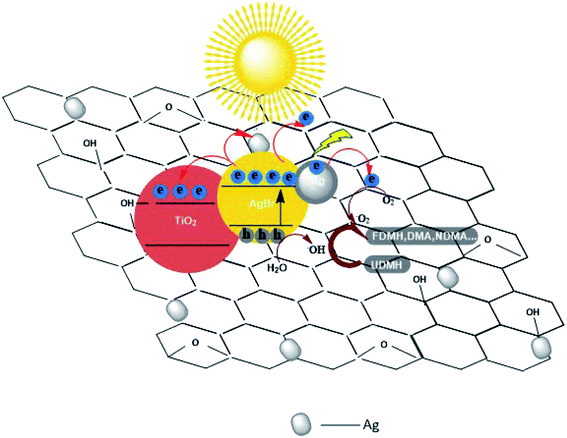
In order to further understand the role of AgBr in the photocatalysis, the spectra of Ag 3d for AgBr/TiO2/rGA after the reaction were recorded, as depicted in Fig. 7a. The surface ratio of metallic Ag0 is 45% and 83% before and after the reaction, respectively. The content of nano-silver increases during the reaction. As shown in Fig. 13, AgBr can produce photogenerated electrons and holes once receiving simulated sunlight. The electrons can easily transfer to the graphene and conduction band (CB) of TiO2. The Fermi level of silver is low, the photo-induced electrons on silver bromide can also easily transfer to the surface of the nano-silver. The photoproduced electrons during the photocatalysis can also be trapped by Ag+ in AgBr to produce more metallic Ag0. On the other hand, nano-silver will produce surface plasma resonance under illumination, which will raise the Fermi level of silver.27 Polarization fields produced around Ag could promote electrons to stay away from the silver bromide,38,39 and inject the electrons into rGA. The carriers on the surface can react with water and oxygen to produce active groups with improved photocatalytic efficiency.
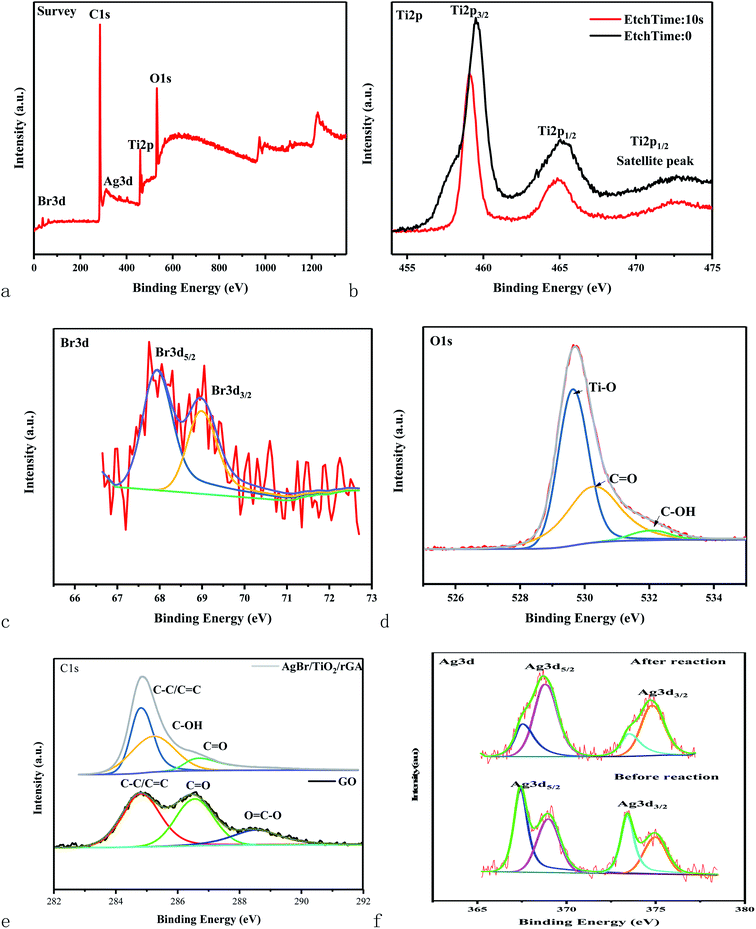 | ||
| Fig. 7 XPS spectra of the full spectrum (a), Ti 2p (b), Br 3d (c), O 1s (d), and Ag 3d (f) of AgBr/TiO2/rGA and C 1s (e) of AgBr/TiO2/rGA and GO. | ||
| Product | Peak/min | CAS No. | Dry | 50% H2O |
|---|---|---|---|---|
| FDMH | 2.12 | 2035-89-4 | + | + |
| UDMH | 2.37 | 57-14-7 | ++ | + |
| Ethyl ethanimidate | 2.87 | 1000-84-6 | + | |
| Butanedial | 3.10 | 638-37-9 | + | ++ |
| DMA | 3.77/3.63 | 124-40-3 | + | + |
| NDMA | 5.19 | 62-75-9 | + |
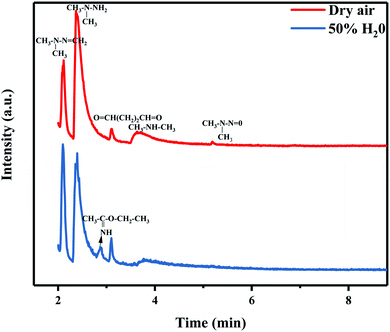
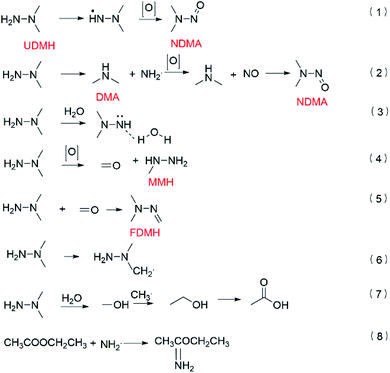
According to the transition state theory, the abstraction of hydrogen or the addition of oxygen can take place on UDMH after UDMH is exposed to oxygen. The main conversion path is shown in Fig. 15. The reaction barrier of the N–H bond is the lowest so the intermediate (CH3)2NNH· is easily formed. Amino oxidation would generate NDMA (eqn (1)).5 DMA (dimethylamine) and NH2· can be produced by cleavage of the N–N bond. NH2· can be further oxidized to form NO, which would react with DMA to form NDMA42 (eqn (2)). In humid air, NDMA cannot be detected, probably because of the hydrogen bonds formed between water and nitrogen in UDMH, hindering the amino oxidation process (eqn (3)). In addition, the methyl group on the UDMH can be oxidized to form HCHO (formaldehyde) and MMH (methylhydrazine) (eqn (4)). FDMH (formaldehyde dimethylhydrazone) can be produced by UDMH reacting with HCHO (eqn (5)). The hydrogen atom on the methyl group of UDMH can also be extracted (eqn (6)). The formed (CH2·) (CH3) NNH2 can combine with oxygen to generate a stable aldehyde. An aldehyde can also be formed by the hydroxyl radical reacting with a methyl radical so more butanedial was produced in humid air. What is more, ethanol and acetic acid would be produced in the presence of water (eqn (7)),43 which further led to the formation of an ester. On the other hand, the amino group, as a nucleophile, may attack the carbonyl group on the ester to form ethyl ethanimidate (eqn (8)).
4. Conclusions
In this work, we synthesized AgBr/TiO2/rGA ternary nanocomposites via a facile solvothermal method with a uniform distribution of AgBr. The nanocomposites exhibit great thermal stability and visible light adsorption. The UDMH degradation by AgBr/TiO2/rGA in the flowing gas is enhanced with an optimal conversion of 51% compared with other binary and unitary samples, which is attributed to the high specific surface area, the significant enhanced light adsorption and the efficient separation and transmission of carriers. The photothermal effect also contributes to the degradation of UDMH. The species and quantity of products vary with different humidity levels and the carcinogenic substance NDMA is not detected in humid air. Further studies are required to optimize the experimental equipment to further improve the efficiency. The work could also pave the way for UDMH waste gas treatment in sunlight.Author contributions
HOU Ruomeng: methodology, software, validation, and writing-original draft preparation. JIA Ying: conceptualization and supervision. LV Xiaomeng: resources. Hung Yuanzheng: investigation. Shen Keke: writing-reviewing and editing.Conflicts of interest
There are no conflicts to declare.Acknowledgements
This project is supported by the National Natural Science Foundation of China (21875281).References
- H. Huang, Y. Xu, Q. Feng and D. Y. C. Leung, Catal. Sci. Technol., 2015, 5, 2649–2669 RSC.
- M. Amann and M. Lutz, J. Hazard. Mater., 2000, 78, 41–62 CrossRef CAS PubMed.
- Z. R. Ismagilov, M. A. Kerzhentsev, I. Z. Ismagilov, V. A. Sazonov, V. N. Parmon and G. L. Elizarova, Catal. Today, 2002, 277–285 CrossRef CAS.
- P. A. Kolinko, D. V. Kozlov, A. V. Vorontsov and S. V. Preis, Catal. Today, 2007, 122, 178–185 CrossRef CAS.
- D. Huang, X. Liu, C. Zuo, X. Wang, Z. Xie and X. Gao, Chem. Phys., 2019, 522, 220–227 CrossRef CAS.
- M. Ikram, A. Raza, M. Imran, A. Ul-Hamid and S. Ali, Nanoscale Res. Lett., 2020, 15, 11 CrossRef PubMed.
- M. Shah, A. R. Park, K. Zhang, J. H. Park and P. J. Yoo, ACS Appl. Mater. Interfaces, 2012, 4, 3893–3901 CrossRef PubMed.
- J. T. Zhang, Z. G. Xiong and X. S. Zhao, J. Mater. Chem., 2011, 21, 3634–3640 RSC.
- F. Yu, X. Bai, C. Yang, L. Xu and J. Ma, Catalysts, 2019, 9, 607 CrossRef CAS.
- C. H. A. Tsang, K. Li, Y. X. Zeng, W. Zhao, T. Zhang, Y. J. Zhan, R. J. Xie, D. Y. C. Leung and H. B. Huang, Environ. Int., 2019, 125, 200–228 CrossRef CAS.
- Y. Ren, Y. Z. Dong, Y. Q. Feng and J. L. Xu, Catalysts, 2018, 8, 590 CrossRef.
- X. Gao, X. Liu, Z. Zhu, Y. Gao, Q. Wang, F. Zhu and Z. Xie, Sci. Rep., 2017, 7, 973–982 CrossRef PubMed.
- G. Jiang, Z. Lin, C. Chen, L. Zhu, Q. Chang, N. Wang, W. Wei and H. Tang, Carbon, 2011, 49, 2693–2701 CrossRef CAS.
- P. Wang, Y. Tang, Z. Dong, Z. Chen and T.-T. Lim, J. Mater. Chem. A, 2013, 1, 4718–4727 RSC.
- W. S. Hummers Jr and R. E. Offeman, J. Am. Chem. Soc., 1958, 80, 1339 CrossRef.
- S. Ameer, I. H. Gul, N. Mahmood and M. Mujahid, Mater. Charact., 2015, 99, 254–265 CrossRef CAS.
- D. Xu, L. Li, R. He, L. Qi, L. Zhang and B. Cheng, Appl. Surf. Sci., 2018, 434, 620–625 CrossRef CAS.
- X. Chen, Q. Chen, W. Jiang, Z. Wei and Y. Zhu, Appl. Catal., B, 2017, 211, 106–113 CrossRef CAS.
- Q. Liu, J. Shen, X. Yang, T. Zhang and H. Tang, Appl. Catal., B, 2018, 232, 562–573 CrossRef CAS.
- A. Trapalis, N. Todorova, T. Giannakopoulou, N. Boukos, T. Speliotis, D. Dimotikali and J. Yu, Appl. Catal., B, 2016, 180, 637–647 CrossRef CAS.
- Y. Zhang, Z.-R. Tang, X. Fu and Y.-J. Xu, ACS Nano, 2011, 5, 7426–7435 CrossRef CAS PubMed.
- N. Shehzad, M. Tahir, K. Johari, T. Murugesan and M. Hussain, Appl. Surf. Sci., 2019, 463, 445–455 CrossRef CAS.
- H. Liu, X. Dong, X. Wang, C. Sun, J. Li and Z. Zhu, Chem. Eng. J., 2013, 230, 279–285 CrossRef CAS.
- A. J. Wang, W. Yu, Y. Fang, Y. L. Song, D. Jia, L. L. Long, M. P. Cifuentes, M. G. Humphrey and C. Zhang, Carbon, 2015, 89, 130–141 CrossRef CAS.
- H. Zhang, X. Lv, Y. Li, Y. Wang and J. Li, ACS Nano, 2010, 4, 380–386 CrossRef CAS PubMed.
- J. Luo, Z. Yan, R. Liu, J. Xu and X. Wang, RSC Adv., 2017, 7, 23246–23254 RSC.
- Y. Fan, W. Ma, D. Han, S. Gan, X. Dong and L. Niu, Adv. Mater., 2015, 27, 3767–3773 CrossRef CAS PubMed.
- L.-W. Zhang, H.-B. Fu and Y.-F. Zhu, Adv. Funct. Mater., 2008, 18, 2180–2189 CrossRef CAS.
- C. Peng, W. Wang, W. Zhang, Y. Liang and L. Zhuo, Appl. Surf. Sci., 2017, 420, 286–295 CrossRef CAS.
- J. Tian, Z. Zhao, A. Kumar, R. I. Boughton and H. Liu, Chem. Soc. Rev., 2014, 43, 6920–6937 RSC.
- M. Deng and Y. Huang, Ceram. Int., 2020, 46, 2565–2570 CrossRef CAS.
- X. Zhang, C. Wang, C. Yu, B. Teng, Y. He, L. Zhao and M. Fan, J. Environ. Sci., 2018, 63, 68–75 CrossRef PubMed.
- M. Nawaz, W. Miran, J. Jang and D. S. Lee, Appl. Catal., B, 2017, 203, 85–95 CrossRef CAS.
- J. J. Zhang, Y. H. Wu, J. Y. Mei, G. P. Zheng, T. T. Yan, X. C. Zheng, P. Liu and X. X. Guan, Photochem. Photobiol. Sci., 2016, 15, 1012–1019 CrossRef CAS PubMed.
- T.-F. Yeh, F.-F. Chan, C.-T. Hsieh and H. Teng, J. Phys. Chem. C, 2011, 115, 22587–22597 CrossRef CAS.
- H. Ruomeng, J. Ying, Y. HUANG, S. Keke and Z. Huixin, New J. Chem., 2020, 394–402 Search PubMed.
- J. Y. Do, R. K. Chava, K. K. Mandari, N.-K. Park, H.-J. Ryu, M. W. Seo, D. Lee, T. S. Senthil and M. Kang, Appl. Catal., B, 2018, 237, 895–910 CrossRef CAS.
- G. C. Schatz, Acc. Chem. Res., 1984, 17, 370–376 CrossRef CAS.
- P. Wang, B. Huang, X. Qin, X. Zhang, Y. Dai, J. Wei and M.-H. Whangbo, Angew. Chem., 2008, 120, 8049–8051 CrossRef.
- X. Zhang, B. Gao, A. E. Creamer, C. Cao and Y. Li, J. Hazard. Mater., 2017, 338, 102–123 CrossRef CAS.
- M. Asai, T. Ohba, T. Iwanaga, H. Kanoh, M. Endo, J. Campos-Delgado, M. Terrones, K. Nakai and K. Kaneko, J. Am. Chem. Soc., 2011, 133, 14880–14883 CrossRef CAS PubMed.
- M. L. Liang, M. Wu, H. Ni, L. I. Wei Jie and Y. Zheng, RSC Adv., 2015, 6, 5677–5687 RSC.
- M. Torabi Angaji and R. Ghiaee, Ultrason. Sonochem., 2015, 23, 257–265 CrossRef CAS.
- K. Vellingiri, K. Vikrant, V. Kumar and K.-H. Kim, Chem. Eng. J., 2020, 125759 CrossRef CAS.
- X. Yang, S. Liu, J. Li, J. Chen and Z. Rui, Chemosphere, 2020, 249, 126096 CrossRef CAS PubMed.
- Y. Yang, H. Yin, H. Li, Q. Zou, Z. Zhang, W. Pei, L. Luo, Y. Huo and H. Li, ACS Appl. Bio Mater., 2018, 1, 2141–2152 CrossRef CAS.
- Z. Gan, X. Wu, M. Meng, X. Zhu, L. Yang and P. K. Chu, ACS Nano, 2014, 8, 9304–9310 CrossRef CAS PubMed.
| This journal is © The Royal Society of Chemistry 2021 |


