 Open Access Article
Performance and stability comparison of Aemion™ and Aemion+™ membranes for vanadium redox flow batteries
Brian Shanahan a,
Benjamin Brittonb,
Andrew Bellettib,
Severin Vierrath
 acd and
Matthias Breitwieser*ac
aElectrochemical Energy Systems, IMTEK - Department of Microsystems Engineering, University of Freiburg, Georges-Koehler-Allee 103, 79110, Freiburg, Germany. E-mail: matthias.breitwieser@imtek.uni-freiburg.de
bIonomr Innovations Inc., #111 - 2386 East Mall, V6T-1Z3, Vancouver, British Columbia, Canada
cHahn-Schickard, Georges-Koehler-Allee 103, 79110, Freiburg, Germany
dUniversity of Freiburg, Institute and FIT – Freiburg Center for Interactive Materials and Bioinspired Technologies, Georges-Köhler-Allee 105, 79110, Freiburg, Germany
First published on 7th April 2021
Abstract
Anion exchange membranes (AEMs) have shown a significant rise in performance and durability within recent years for applications such as electrolysis and fuel cells. However, in vanadium redox-flow batteries, their use is of particular interest to lower costs and self-discharge rates compared to conventional perfluorinated sulfonic acid-based ionomers such as Nafion. In this work we evaluate the properties of two commercial AEMs, Aemion™ and Aemion+™, based on ex situ characterizations, an accelerated stress test degradation study (>1000 hours storage in highly oxidizing VO2+ electrolyte at 35 °C) and electrochemical battery cycle tests. All membranes feature low ionic resistances of below 320 mΩ cm2, enabling battery cycling at 100 mA cm−2. Aemion shows considerable VO2+ formation within a VO2+ stress test, whereas Aemion+ remains almost unaffected in the 1058 h stress test. Evaluating self-discharge data, cycling performance and durability data, Aemion+™ (50 μm thickness) features the best properties for vanadium redox-flow battery operation.
Introduction
A successful energy transition towards clean energy carriers is one of the most important challenges of our society. In line with the significant rise of installed renewable energy systems, suitable energy storage solutions need to be developed and installed. Redox-flow batteries are considered as most promising for stationary energy storage requirements, due to their unique properties such as long cycling stability, relatively low cost and easy decoupling of energy density and capacity.1–4 Vanadium redox flow batteries (VRFBs) are one of the most established redox-flow battery types due to their robust cell chemistry with only one element (vanadium) as active species, enabling simple and complete electrolyte recovery.5 VRFBs typically consist of a symmetric cell composed of an ion-conducting membrane and graphitized carbon felt electrodes, which facilitate the redox reactions of the anode and cathode.When choosing ion conducting membranes, most systems still rely on proton-exchange membranes (PEMs) due to the well-established technology of perfluorinated sulfonic acid (PFSA) membranes.6,7 PFSAs are composed of a hydrophobic fluorinated backbone and a hydrophilic sulfonic acid terminated side chain. The hydrophilic side chains form hydrophilic channels through the membrane, allowing rapid H+ transport.8,9 However, PFSAs show significant drawbacks when used in VRFBs: since the charge carrier is a positively charged proton, PEMs exhibit a low selectivity between protons and the multivalent, positively charged vanadium ions, which leads to crossover and lower capacity retention.10 In addition, the cost for PFSA membranes accounts for up to 30% of the cell cost in a VRFB and its replacement is therefore a major goal.4,11,12 In the past years, several attempts have been made to introduce anion-exchange membranes (AEMs) as cheaper and more selective alternatives to PEMs. AEMs possess fixed positive charges, which act as a barrier for the multivalent positively charged vanadium ions in the electrolyte, by means of the Donnan effect.13–15 In addition, since most AEMs presented to date rely on a fluorine-free chemistry, these constitute a more sustainable, green chemistry approach with a high likelihood that the membrane price will be significantly reduced compared to PFSAs at volume. Several authors reported the use of either acid doped polybenzimidazole (PBI) or modified versions of PBI, which have shown excellent selectivity, low self-discharge and thus high coulombic efficiency values up to nearly 100%.16–19
A remaining challenge is the stability of current AEMs in the challenging environment of high concentrations of sulfuric acid as well as the highly oxidative VO2+ species. Recently several groups have made tremendous efforts to improve the performance and stability of ionomers through methods such as crosslinking18,20,21 and ionomer blending.22–24 In this work, a novel ionomer class based on poly-imidazolium developed by the Holdcroft group is used for the first time in a VRFB.25 The ionomer was initially introduced for the use in AEM fuel cells and electrolysis cells and showed remarkable operation stability in highly concentrated KOH (6 M) at elevated temperature of 60 °C in an AEM water electrolyzer. This class of imidazolium-based ionomer was adapted and commercialized recently via the trademark “Aemion+™” by Ionomr Innovations Inc. Aemion™ is based upon the modified PBI ionomer, hexamethyl-p-terphenyl polybenzimidazolium (HMT-PMBI), which has previously been reported for VRFB.26
In this work, we report a first comparison of two commercial non-crosslinked membranes (Aemion and Aemion+) as 50 μm thick, bulk membranes and a 15 μm thin, reinforced Aemion+ membrane to possibly further reduce material cost and increase mechanical integrity.
Experimental
Materials
Aemion and Aemion+ membranes were provided by Ionomr Innovations Inc. Table 1 contains information such as name, thickness and reinforcement layer information for the membranes used in this study. Sulfuric acid, 96% (Sigma Aldrich), phosphoric acid, 85% (Sigma Aldrich) and vanadium oxide sulfate (abcr GmbH) were used to produce all electrolyte precursor solutions. PXFT FT-305 carbonized felt electrodes were provided by Zoltek in a pre-activated state and were not modified further.| Membrane | Thickness (μm) | Reinforcement | IEC (meq g−1) |
|---|---|---|---|
| Aemion™ AF1-HNN8-50 | 50 | No | 1.8 |
| Aemion+™ AF2-HNN8-50-X | 50 | No | 2.0 |
| Aemion+™ AF2-HLE8-15-X | 15 | Yes | 2.0 |
Membrane preparation
All membranes used in this study underwent counter-ion exchange to the sulfate form, which allows for a more direct comparison of the two different ionomer types and to avoid unnecessary in situ membrane morphological changes upon battery operation in high acid concentrations. Conversion to the sulfate form was performed by immersing membranes in a 1 M KOH solution for 72 hours followed by a 1 M Na2SO4 solution for 72 hours and then immersion in 1 M H2SO4 for 24 hours to convert from the Na salt form (NaSO4−) to the protonated form (HSO4−).Electrolyte preparation
For self-discharge testing, a precursor solution consisting of 0.1 M VOSO4 in 2 M H2SO4 with 100 mM H3PO4 was prepared. For cyclic testing a precursor solution of 1 M VOSO4 in 2 M H2SO4 with 100 mM H3PO4 was prepared. Both precursor solutions were charged to generate both the positive and negative electrolyte solutions in the same manner as previously reported.26Swelling studies
Membrane samples were cut into 5 cm2 sized pieces using a hollow punch and were converted to the sulfate form via the method mentioned previously. The membranes were immersed in water to remove excess acid for 48 hours and dried in a vacuum oven at 90 °C overnight. Subsequently, the dry mass, dry average thickness and dry area were recorded for all samples. Samples were then immersed in DI water or 2 M H2SO4, depending on the test, for 24 hours at room temperature. After 24 hours, the wet samples were removed from the water or H2SO4 and remaining surface liquid was gently removed using tissue paper. Immediately, the wet weight, wet area dimensions and wet thickness were recorded. All measurements were conducted at room temperature (24 °C) with a relative humidity of 44%. Mass increase is calculated using eqn (1).
 | (1) |
Thickness increase (%) was calculated according to eqn (2). A micrometer gauge was used to determine the dry and wet thickness values. The values used are an average of five data points across the membranes surface.
 | (2) |
Area increase (%) was calculated according to eqn (3). Dry areas were measured before any processing of the material was performed. Wet areas were obtained after the sample was immersed in DI water or 2 M H2SO4 for 24 hours and surface water carefully removed using tissue paper. Immediately, photographs of the membranes were taken and the X–Y area was quantified using the software Fiji ImageJ.
 | (3) |
Ex situ chemical stability
Ex situ chemical stability was conducted by immersion of 4 cm2 membrane samples in diluted VO2+ solution at 35 °C. The VO2+ solution used was 20 mL of 0.1 M VO2+ in 2 M H2SO4 with 100 mM H3PO4. At regular intervals, 4 mL of solution was removed from each sample and UV-Vis analysis (Cary UV-Vis Spectrophotometer) was performed at 765 nm which is the peak absorbance for VO2+ cations.27 Upon completion of UV-Vis analysis, the testing solutions were returned to their respective sample vials. Testing was performed for over 1058 hours. Another sample containing only the electrolyte was used as a reference and stored in the same conditions to assess the natural conversion rate of VO2+ to VO2+ for the duration of the test. Dry mass values used for normalization of VO2+ concentration were 24.9 ± 0.15 mg for Aemion (50 μm), 17.4 ± 0.53 mg for Aemion+ (50 μm) and 3.7 ± 0.1 mg for Aemion+ (15 μm). Care must be taken when performing mass normalization as the mass of the membranes, especially Aemion+ (15 μm) are very low.Surface spectroscopy
A WITec alpha 300 confocal Raman microscope was used to conduct chemical membrane analysis after the degradation test. The device was equipped with a UHTS300 VIS-NIR spectrometer and a 785 nm laser operated at 50 mW. An integration time of 10 s with an accumulation of 5 times was used to collect single point spectra. Background subtraction and cosmic ray removal was performed in the manufacturers' software WITec Project.Single cell testing
Membranes were cut into 30 cm2 squares and counter-ion exchange was performed to convert all membranes to the sulfate form as described earlier. Electrochemical testing was performed using an 857 Redox Flow Test System from Scribner Associates Inc (USA). Electrodes of size 5 cm2 and thickness of 2.7 mm (uncompressed) were used for all in situ electrochemical testing. PTFE hard stop gaskets were employed to control the active electrode area to 5 cm2 and to ensure a stable compression of 40% for all tests. Unlike soft gaskets, which are typically made from rubber, hard stop gaskets are uncompressible and help prevent accidental over-compression. An electrolyte flow rate of 40 mL min−1 was used for all tests unless otherwise stated. For self-discharge testing, an electrolyte composition of 0.1 M vanadium in 2 M H2SO4 with 100 mM H3PO4 was used. For cycling, an electrolyte composition of 1 M vanadium in 2 M H2SO4 with 100 mM H3PO4 was used. For both the self-discharge and cycling tests, 30 mL of electrolyte was used in both the positive and negative sides. The high frequency resistance (HFR) was measured online at a fixed frequency of 10 kHz. The contribution to cell HFR from the electrodes and the electrolyte was measured to be 166 mΩ cm2. This value was obtained by assembling the cell without the membrane installed. A current sweep test was performed and from the resulting the I–V curve, the resistance was extracted from the slope using Ohm's Law.Results and discussion
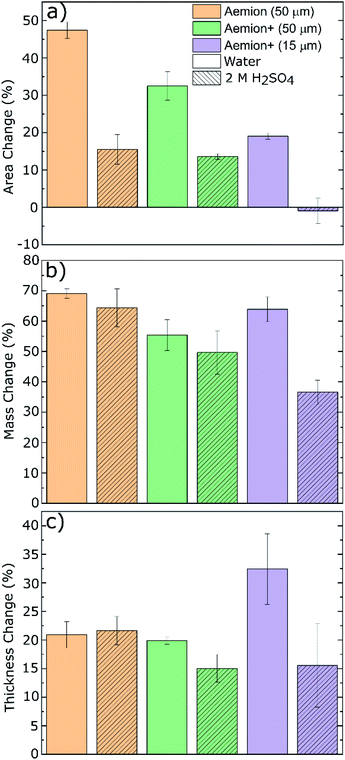
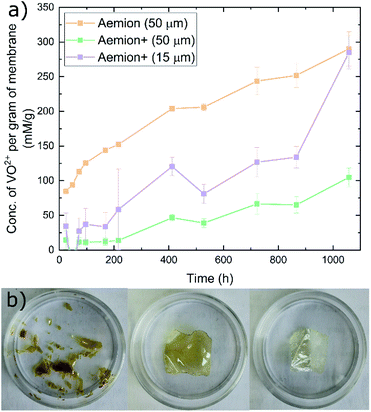
The Aemion and Aemion+ membranes were counter-ion exchanged from the as-received halide forms to the sulfate form prior to all experiments in this work, based on previously reported procedures in literature; this included alternated pre-treatment steps based on acid soaks by Mohammadi et al.28 and an alkaline pre-swelling step by Noh et al.29 Area changes for all membranes tested shows significant variations between the water and acid environments however it is clear that Aemion (50 μm) shows the highest change in both environments while Aemion+ (15 μm) shows the lowest change, which can be attributed to its lower ionomer content and reinforcement layer that provides dimensional stability (Fig. 1). Mass changes were relatedly unchanged from both environments, with differences typically <5% with the exception of Aemion+ (15 μm), which showed a reduction in mass change from 62% to 35% between the water and acid environments. Relative thickness changes for Aemion (50 μm) and Aemion+ (50 μm) were comparable in both environments, with Aemion+ (50 μm) showing a slight decrease in the acid environment of 4%. Aemion+ (15 μm) shows the largest reduction from 32% in water to 15% in acid although due the tendency for the thin membrane to wrinkle and roll up once hydrated, handling of the membrane became difficult and data reproducibility was impacted as observed in the error bars. Ultimately it can be seen that both ionomers, when in the sulfate form, show reduced tendencies for acid uptake, with Aemion (50 μm) absorbing more than both Aemion+ membranes.Ex situ chemical stability tests were performed to examine the chemical stability of the membranes in the strongly oxidizing VO2+ solution which is formed on the positive electrolyte side during charging. If the membrane is chemically attacked and oxidized, VO2+ will be reduced to VO2+ and a color change, from yellow to blue, will be observed in the testing solution. Given that this color change can take time and be difficult to assess visually, UV-Vis spectroscopy was used. The peak absorbance wavelength of VO2+ is at 765 nm.27 Fig. 2a shows the concentration of VO2+ per gram of membrane versus time. Aemion+ (50 μm) shows the lowest rate of VO2+ generation per gram of membrane tested with a VO2+ concentration of 104 ± 13 mM g−1 after 1058 hours. Aemion (50 μm) shows the highest overall rate of VO2+ formation with 290 ± 25 mM g−1 VO2+ after 1058 hours. Aemion+ (15 μm) initially shows a VO2+ generation rate that lies between those reported for Aemion+ (50 μm) and Aemion (50 μm) however the VO2+ generation rate increases uncharacteristically after 1058 hours to 284 ± 24 mM g−1. Possibly the reinforcement layer could be the source of the uncharacteristic increase in VO2+ concentration as it potentially could interact differently than the ionomer to the electrolyte solution. Linear fits of the data between 200 and 1058 hours provides slopes of 0.1919 for Aemion (50 μm), 0.0971 for Aemion+ (50 μm) and 0.1772 for Aemion+ (15 μm). All Aemion membranes suffered mechanical failure when removed from the testing solution whereas all Aemion+ membranes maintained mechanical integrity and displayed no signs of mechanical stress, as the samples remained flexible and intact (Fig. 2b). All membrane samples were washed in deionized water for 1 hour and dried in an oven at 80 °C overnight for further analysis.
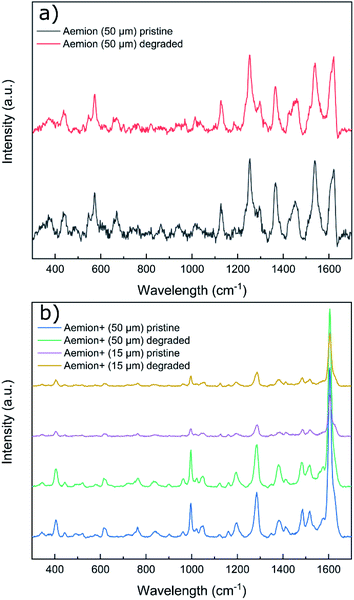
Raman spectra of all degraded samples were compared to pristine spectra (Fig. 3). All membranes exhibited significant fluorescence at higher wavelengths and required baseline leveling. No obvious chemical changes were observed on the surface of any sample by Raman spectroscopy. Given the observed physical degradation of the Aemion membrane after chemical stability testing, more in-depth characterization would be required to resolve the source of the observed degradation of Aemion.
Prior to single cell testing, membranes were counter-ion exchanged into the sulfate form as described in the Materials section. Static self-discharge testing was performed using a dilute 0.1 M vanadium electrolyte solution in order to speed up the testing process, Fig. 4. The static nature of this experiment limits the test to electrolyte present in the electrode chamber. Aemion (50 μm) concluded the test after 5.5 hours, Aemion+ (50 μm) after 6.2 hours and Aemion+ (15 μm) after 3 hours. Nafion 212 (50 μm), which is commonly used in VRFB applications, completed the test after 1.9 hours due to higher vanadium permeability in PFSA membranes. The low self-discharge rates of both Aemion (50 μm) and Aemion+ (50 μm) can be attributed to their increased thicknesses, with Aemion+ (50 μm) showing greater ability to prevent vanadium cation permeation. Based upon this result, thicker Aemion + membranes are more suitable for reduction of vanadium permeation, due to increased influence of the Donnan effect, as opposed to the inclusion of reinforcement layers for thinner membranes.
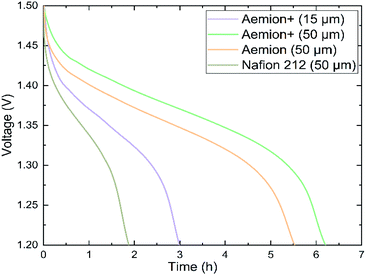 | ||
| Fig. 4 Static self-discharge curves of Aemion (50 μm), Aemion+ (50 μm), Aemion+ (15 μm) and Nafion 212 (50 μm) in a diluted (0.1 M) vanadium electrolyte. | ||
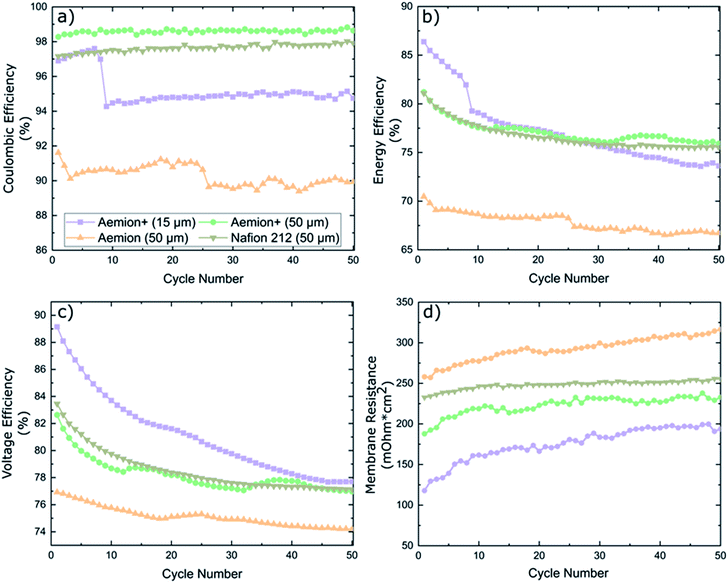
Battery cycling was conducted at an application-relevant current density of 100 mA cm−2 for all membranes. The coulombic efficiency (CE), energy efficiency (EE) and voltage efficiency (VE) are shown in Fig. 5. Nafion 212 maintained a CE of 97% for all fifty cycles, EE and VE started at 81% and 83.5% for cycle one before decreasing to 75.5% and 77.1% at cycle fifty, respectively. Membrane resistance was high at 232–255 mΩ cm2.
Aemion+ (50 μm) maintained a stable CE of 98.5 ± 0.5% for the duration of the cycling experiment, which is in line for typical AEMs in literature.20,30,31 A high EE of 81% was measured for cycle one which decayed to 76% upon completion of cycling. EE decay can be linked to membrane resistance values in Fig. 5d. Membrane resistance values have two distinct regions: a steep increase in the first ten cycles followed by a stabilized region from cycle ten to test completion. This HFR pattern coincides with the observed EE decay pattern and indicates that the EE decay observed is solely a result of HFR changes. Aemion+ (15 μm) showed an unexpected CE decline from 97.5% to 94% during cycles 7–9. The sudden decrease in CE of this thin, reinforced membrane could be related to the low total membrane thickness and, most probably, to parasitic electrolyte pathways along the membrane reinforcement layer which are formed during battery cycling. Handling and cell assembly errors can be ruled out as similar decays in CE were observed multiple times in repeated cycling tests. EE values also depict a large decay in performance during cycles 7–9 which can be attributed solely to the decay in CE as no such spike is observed in the membrane resistance data. Overall EE decay for Aemion+ (15 μm) is the largest of all membranes tested while the membrane resistance values are the lowest due to its low thickness. Aemion (50 μm) shows the lowest CE range (90 ± 2%) which is not in line with the self-discharge results observed earlier. Given the different membrane chemistry and different values for IEC, water uptake and dimensional swelling for Aemion and Aemion+, this might explain the observed discrepancy between Aemion and Aemion+ at this point. The EE decay over the lifetime of the test, can be attributed to the increase in membrane resistance (difference between high frequency resistance and Ohmic contributions from electrolyte and all cell components excluding the membrane) in Fig. 5d. The membrane resistance is the highest among all membranes tested, which might be related to the slightly lower IEC of Aemion vs. Aemion+. The electrode and electrolyte contribution to cell HFR was calculated as 166 mΩ cm2 resulting in a membrane ohmic resistance increase from 258–316 mΩ cm2 for Aemion (50 μm) during cycling. Given the lower performance in cycling as well as lower stability in highly oxidizing VO2+, Aemion+ is a more suitable choice for VRFB applications than Aemion. In addition, the cycling performance of Aemion+ (50 μm) is comparable to that of Nafion 212 as the EE and VE values are near identical and CE values for Aemion+ are on average 1% higher than Nafion 212. Membrane resistance for Aemion+ (50 μm) (187–232 mΩ cm2) is lower than Nafion 212 (232–255 mΩ cm2).
Conclusions
In this work, we provide a performance and chemical stability analysis of two recently commercialized anion exchange membranes, Aemion and Aemion+, in a vanadium redox flow battery. By comparison of ex situ measurements and in situ electrochemical single cell testing, we were able to clearly determine that Aemion+ offers improved chemical and electrochemical performance over Aemion: ex situ chemical stability testing (>1000 h VO2+ storage) proved an excellent stability of the 50 μm Aemion+ membrane indicating promising resistance to oxidative degradation from the electrolyte solution. Reinforced Aemion+ (15 μm) demonstrated an improvement in ex situ chemical stability testing over Aemion, however it showed a reduced performance in electrochemical testing. Even though the low membrane thickness of only 15 μm enabled a low membrane Ohmic resistance of 118–194 mΩ cm2, the vanadium permeability increased. In combination with the unstable CE evolution during battery cycling, the very thin membrane (initially developed for high performance AEM fuel cell applications) is not recommended for VRFB applications.Non-reinforced Aemion+ (50 μm) demonstrated the best electrochemical performance among the tested membranes. High coulombic efficiency of 98 ± 0.5% were maintained for the duration of testing, which is in line with typical efficiencies for AEMs in VRFBs. In combination with a stable EE evolution upon 50 battery cycles, low ionic resistance of 187–232 mΩ cm2, the longest self-discharge time (6 h) and the excellent stability in VO2+, Aemion+ with 50 μm thickness showed the best properties for battery applications. Thus, based on this study, thick Aemion+ membranes, based on a stable poly-imidazole chemistry are recommended for use in VRFBs, rather than PBI-based Aemion due to the significantly lower rate of VO2+ formation and improved electrochemical performance.
Future work will focus on the development of a dedicated VRFB membrane which is based on Aemion+, which possess a moderate thickness of 20–30 μm and a thicker reinforcement layer to reduce dimensional swelling and vanadium crossover on the one hand, but enable low ionic resistance and high cycling current densities on the other. Also, a “battery-focused” adjustment of anion exchange ionomer properties such as the ion exchange capacity and acid-swelling behavior are reasonable next steps.
Conflicts of interest
B. Britton and A. Belletti are employees and minor shareholders of Ionomr Innovations Inc.Acknowledgements
This work was funded by the German Federal Ministry of Education (BMBF) within the German-Canadian 2 + 2 project “FlexCoat” (FKZ: 01DM19008A), the German Federal Ministry for Economic Affairs and Energy within the project “NextRedox” (FKZ: 03 E13018A) and by an NRC-IRAP Canada-Germany 2 + 2 project (928868).Notes and references
- H. Zhang, X. Li and J. Zhang, Redox Flow Batteries: Fundamentals and Applications, CRC Press, 2017 Search PubMed.
- R. Ye, D. Henkensmeier, S. J. Yoon, Z. Huang, D. K. Kim, Z. Chang, S. Kim and R. Chen, Redox Flow Batteries for Energy Storage: A Technology Review, J. Electrochem. Energy Convers. Storage, 2017, 15, 010801–010821 CrossRef.
- M. Skyllas-Kazacos, C. Menictas and T. LIM, in Electricity Transmission, Distribution and Storage Systems : Woodhead Publishing Series in Energy, ed. Z. Melhem, Woodhead Publishing, 2013, pp. 398–441 Search PubMed.
- C. Minke and T. Turek, Economics of vanadium redox flow battery membranes, J. Power Sources, 2015, 286, 247–257 CrossRef CAS.
- A. Z. Weber, M. M. Mench, J. P. Meyers, P. N. Ross, J. T. Gostick and Q. Liu, Redox flow batteries: a review, J. Appl. Electrochem., 2011, 41, 1137–1164 CrossRef CAS.
- M. Ulaganathan, V. Aravindan, Q. Yan, S. Madhavi, M. Skyllas-Kazacos and T. M. Lim, Recent Advancements in All-Vanadium Redox Flow Batteries, Adv. Mater. Interfaces, 2016, 3, 1500309 CrossRef.
- L. Gubler, Membranes and separators for redox flow batteries, Curr. Opin. Electrochem., 2019, 18, 31–36 CrossRef CAS.
- K. Schmidt-Rohr and Q. Chen, Parallel cylindrical water nanochannels in Nafion fuel-cell membranes, Nat. Mater., 2008, 7, 75–83 CrossRef CAS PubMed.
- H.-G. Haubold, T. Vad, H. Jungbluth and P. Hiller, Nano structure of NAFION: a SAXS study, Electrocatalysis, 2001, 46, 1559–1563 CAS.
- M. Vijayakumar, Q. Luo, R. Lloyd, Z. Nie, X. Wei, B. Li, V. Sprenkle, J.-D. Londono, M. Unlu and W. Wang, Tuning the Perfluorosulfonic Acid Membrane Morphology for Vanadium Redox-Flow Batteries, ACS Appl. Mater. Interfaces, 2016, 8, 34327–34334 CrossRef CAS PubMed.
- V. Viswanathan, A. Crawford, D. Stephenson, S. Kim, W. Wang, B. Li, G. Coffey, E. Thomsen, G. Graff, P. Balducci, M. Kintner-Meyer and V. Sprenkle, Cost and performance model for redox flow batteries, J. Power Sources, 2014, 247, 1040–1051 CrossRef CAS.
- C. Minke and T. Turek, Materials, system designs and modelling approaches in techno-economic assessment of all-vanadium redox flow batteries – A review, J. Power Sources, 2018, 376, 66–81 CrossRef CAS.
- D. Chen, M. A. Hickner, E. Agar and E. C. Kumbur, Selective anion exchange membranes for high coulombic efficiency vanadium redox flow batteries, Electrochem. Commun., 2013, 26, 37–40 CrossRef CAS.
- C.-N. Sun, Z. Tang, C. Belcher, T. A. Zawodzinski and C. Fujimoto, Evaluation of Diels–Alder poly(phenylene) anion exchange membranes in all-vanadium redox flow batteries, Electrochem. Commun., 2014, 43, 63–66 CrossRef CAS.
- G.-J. Hwang and H. Ohya, Crosslinking of anion exchange membrane by accelerated electron radiation as a separator for the all-vanadium redox flow battery, Membranes, 1997, 132, 55–61 CrossRef CAS.
- J.-K. Jang, T.-H. Kim, S. J. Yoon, J. Y. Lee, J.-C. Lee and Y. T. Hong, Highly proton conductive, dense polybenzimidazole membranes with low permeability to vanadium and enhanced H 2 SO 4 absorption capability for use in vanadium redox flow batteries, J. Mater. Chem. A, 2016, 4, 14342–14355 RSC.
- L. Ding, X. Song, L. Wang, Z. Zhao and G. He, Preparation of dense polybenzimidazole proton exchange membranes with different basicity and flexibility for vanadium redox flow battery applications, Electrocatalysis, 2018, 292, 10–19 CAS.
- R. Chen, D. Henkensmeier, S. Kim, S. J. Yoon, T. Zinkevich and S. Indris, Improved All-Vanadium Redox Flow Batteries using Catholyte Additive and a Cross-linked Methylated Polybenzimidazole Membrane, ACS Appl. Energy Mater., 2018, 1, 6047–6055 CrossRef.
- D. Aili, J. Yang, K. Jankova, D. Henkensmeier and Q. Li, From polybenzimidazoles to polybenzimidazoliums and polybenzimidazolides, J. Mater. Chem. A, 2020, 8, 12854–12886 RSC.
- M. S. Cha, H. Y. Jeong, H. Y. Shin, S. H. Hong, T.-H. Kim, S.-G. Oh, J. Y. Lee and Y. T. Hong, Crosslinked anion exchange membranes with primary diamine-based crosslinkers for vanadium redox flow battery application, J. Power Sources, 2017, 363, 78–86 CrossRef CAS.
- M. S. Cha, J. Y. Lee, T.-H. Kim, H. Y. Jeong, H. Y. Shin, S.-G. Oh and Y. T. Hong, Preparation and characterization of crosslinked anion exchange membrane (AEM) materials with poly(phenylene ether)-based short hydrophilic block for use in electrochemical applications, J. Membr. Sci., 2017, 530, 73–83 CrossRef CAS.
- M. Jung, W. Lee, C. Noh, A. Konovalova, G. S. Yi, S. Kim, Y. Kwon and D. Henkensmeier, Blending polybenzimidazole with an anion exchange polymer increases the efficiency of vanadium redox flow batteries, J. Membr. Sci., 2019, 580, 110–116 CrossRef CAS.
- J. Ren, Y. Dong, J. Dai, H. Hu, Y. Zhu and X. Teng, A novel chloromethylated/quaternized poly(sulfone)/poly(vinylidene fluoride) anion exchange membrane with ultra-low vanadium permeability for all vanadium redox flow battery, J. Membr. Sci., 2017, 544, 186–194 CrossRef CAS.
- I. Strużyńska-Piron, M. Jung, A. Maljusch, O. Conradi, S. Kim, J. H. Jang, H.-J. Kim, Y. Kwon, S. W. Nam and D. Henkensmeier, Imidazole based ionenes, their blends with PBI-OO and applicability as membrane in a vanadium Redox flow battery, Eur. Polym. J., 2017, 96, 383–392 CrossRef.
- J. Fan, S. Willdorf-Cohen, E. M. Schibli, Z. Paula, W. Li, T. J. G. Skalski, A. T. Sergeenko, A. Hohenadel, B. J. Frisken, E. Magliocca, W. E. Mustain, C. E. Diesendruck, D. R. Dekel and S. Holdcroft, Poly(bis-arylimidazoliums) possessing high hydroxide ion exchange capacity and high alkaline stability, Nat. Commun., 2019, 10, 2306 CrossRef PubMed.
- B. Shanahan, T. Böhm, B. Britton, S. Holdcroft, R. Zengerle, S. Vierrath, S. Thiele and M. Breitwieser, 30 μm thin hexamethyl-p-terphenyl poly(benzimidazolium) anion exchange membrane for vanadium redox flow batteries, Electrochem. Commun., 2019, 102, 37–40 CrossRef CAS.
- N. H. Choi, S.-k. Kwon and H. Kim, Analysis of the Oxidation of the V(II) by Dissolved Oxygen Using UV-Visible Spectrophotometry in a Vanadium Redox Flow Battery, J. Electrochem. Soc., 2013, 160, A973–A979 CrossRef CAS.
- T. Mohammadi and M.S. Kazacos, Modification of anion-exchange membranes for vanadium redox flow battery applications, J. Power Sources, 1996, 63, 179–186 CrossRef CAS.
- C. Noh, D. Serhiichuk, N. Malikah, Y. Kwon and D. Henkensmeier, Optimizing the performance of meta-polybenzimidazole membranes in vanadium redox flow batteries by adding an alkaline pre-swelling step, Chem. Eng. J., 2020, 126574 Search PubMed.
- J. Fang, H. Xu, X. Wei, M. Guo, X. Lu, C. Lan, Y. Zhang, Y. Liu and T. Peng, Preparation and characterization of quaternized poly (2,2,2-trifluoroethyl methacrylate-co-N-vinylimidazole) membrane for vanadium redox flow battery, Polym. Adv. Technol., 2013, 24, 168–173 CrossRef CAS.
- T. Wang, J. Y. Jeon, J. Han, J. H. Kim, C. Bae and S. Kim, Poly(terphenylene) anion exchange membranes with high conductivity and low vanadium permeability for vanadium redox flow batteries (VRFBs), Membranes, 2020, 598, 117665 CrossRef CAS.
| This journal is © The Royal Society of Chemistry 2021 |

