DOI:
10.1039/D1RA01014J
(Paper)
RSC Adv., 2021,
11, 16376-16387
Enhanced CO2 methanation at mild temperature on Ni/zeolite from kaolin: effect of metal–support interface
Received
6th February 2021
, Accepted 26th April 2021
First published on 4th May 2021
Abstract
Catalytic CO2 hydrogenation to CH4 offers a viable route for CO2 conversion into carbon feedstock. The research aimed to enhance CO2 conversion at low temperature and to increase the stability of Ni catalysts using zeolite as a support. NaZSM-5 (MFI), NaA (LTA), NaY (FAU), and NaBEA (BEA) synthesized from kaolin were impregnated with 15% Ni nanoparticles in order to elucidate the effect of surface area, porosity and basicity of the zeolite in increasing Ni activity at mild temperature of ∼200 °C. A highly dispersed Ni catalyst was produced on high surface area NaY meanwhile the mesoporosity of ZSM-5 has no significant effect in improving Ni dispersion. However, the important role of zeolite mesoporosity was observed on the stability of the catalyst. Premature deactivation of Ni/NaA within 10 h was due to the relatively small micropore size that restricted the CO2 diffusion, meanwhile Ni/NaZSM-5 with a large mesopore size exhibited catalytic stability for 40 h of reaction. Zeolite NaY enhanced Ni activity at 200 °C to give 21% conversion with 100% CH4 selectivity. In situ FTIR analysis showed the formation of hydrogen carbonate species and formate intermediates at low temperatures on Ni/NaY, which implied the efficiency of electron transfer from the basic sites of NaY during CO2 reduction. The combination of Ni/NaY interfacial interaction and NaY surface basicity promoted CO2 methanation reaction at low temperature.
Introduction
The conversion of CO2 into value added products has become the main research interest for mitigating the rising level of CO2 in the atmosphere.1,2 CO2 can be converted into valuable commodities such as synthetic gas, methanol,3 dimethyl ether,4 paraffin5 and olefin.6,7 Selective catalytic CO2 hydrogenation to methane through Sabatier reaction allowed the conversion of CO2 at atmospheric pressure (eqn (1)).| | |
CO2 (g) + 4H2 (g) ↔ CH4 (g) + 2H2O (g) ΔH298 K = −165 kJ mol−1
| (1) |
| | |
CO2 (g) + H2 (g) ↔ CO (g) + 2H2O (g) ΔH298 K = −41.2 kJ mol−1
| (2) |
Noble metals (Ru, Rh, Ir)8,9 and non-noble metals (Fe, Ni, Co)10–12 have been utilized as catalysts in order to provide the active site for CO2 methanation. However, Ni has been the ideal choice based on the high methanation activity and the relatively inexpensive price when compared to the precious metals. Ni was impregnated on various supports for example SBA-15,10 SiO2,13,14 γ-Al2O3,15–17 ZrO2,18–21 CeO2,22–24 MCM-41 (ref. 25 and 26) and zeolite27–29 in order to increase the nanoparticles dispersion. Zeolite with high surface area increased the dispersion of metal nanoparticles that consequently reduced the sintering of nanoparticles particularly for reaction at high temperatures.30 Apart from surface area, the porosity of zeolite also enhanced CO2 diffusion,29,31 and controlled the formation of intermediates.32 Zeolite with high basicity and surface hydrophobicity enhanced the CO2 adsorption and hydrogenation,10 and reduced the deactivation caused by the formation of water during CO2 methanation.27
CO2 methanation is a highly exothermic reaction thus thermodynamically, the reaction favoured a low temperature condition in order to achieve high selectivity towards methane.33 At high temperatures, the reaction shifted from methanation to reverse water gas shift (RWGS) (eqn (2)). High temperature also caused deactivation of the catalysts due to the sintering of nanoparticles and the deposition of coke.14 Therefore, this research aimed to design Ni catalysts for CO2 methanation at low temperature by impregnation of Ni on different type of zeolite support. Zeolite NaZSM-5, NaA, NaBEA, and NaY with different micro/mesoporosity, surface area and basicity were synthesized using kaolin mineral and impregnated with 15% wt of Ni loading. Kaolin is a naturally occurring aluminosilicate mineral that was widely investigated as precursor for the synthesis of zeolite.34 The effect of surface area and porosity of the zeolites were determined based on the activity for CO2 methanation at temperatures between 200–500 °C. The structure, morphology, and textural properties of Ni/zeolite catalysts were analyzed using XRD, IR spectroscopy, FESEM, and N2 adsorption–desorption techniques. CO2-TPD and H2-TPR were conducted to evaluate surface basicity and Ni dispersion. The influence of micro–mesoporosity was also evaluated on the stability of the catalysts. Finally, the mechanism of the reaction was proposed based on the intermediate species examined using in situ FTIR analysis.
Experimental
Preparation and characterization of the catalysts
Zeolites were synthesized from kaolin (Bangka Belitung Island, Indonesia) as silica and alumina sources. Prior to the synthesis of zeolite, kaolin was converted into amorphous metakaolin through calcination at 720 °C for 4 hours.35 Zeolites were synthesized according to the molar ratios summarized in Table 1. Typical procedures for the synthesis of zeolite involved the dissolution of NaOH in water, followed by gradual addition of colloidal silica. Metakaolin was mixed with distilled water and subsequently added into the colloidal silica solution with vigorous stirring for 30 min. The gel was transferred into Teflon-lined autoclave and heated in the oven at temperatures and duration as summarized in Table 1. The solids were filtered and washed with distilled water until the pH was neutral, followed by drying in air oven at 100 °C for overnight. For the synthesis of NaBEA and NaZSM-5, there was an additional step involving the removal of organic template via calcination at 550 °C for 6 h in air followed by another 1 h under continuous N2 flow.
Table 1 The molar ratio of zeolite used in this study
| Zeolite type |
Molar ratio |
Aging time (h) |
Hydrothermal |
Drying temp. (°C) |
Ref. |
| SiO2 |
Na2O |
Al2O3 |
H2O |
Template |
Temp. (°C) |
Time (h) |
| NaY |
10 |
4 |
1 |
180 |
— |
24 |
100 |
24 |
105 |
36 |
| NaZSM-5 |
100 |
10 |
2 |
1800 |
20 TPA |
12 |
80 |
12 |
110 |
37 |
| 3.85 CTABr |
150 |
24 |
| NaA |
1.92 |
3.165 |
1 |
128 |
— |
— |
100 |
20 |
105 |
38 |
| NaBEA |
27 |
1.96 |
1 |
240 |
5 TEA2O |
— |
150 |
48 |
110 |
39 |
15 wt% of Ni was impregnated onto 1 gram of zeolite via wet impregnation method. Ni(NO3)2·6H2O was dissolved in water and added drop-wise to zeolite and stirred at 60 °C. The mixture was dried in oven at 110 °C for 24 h, followed by calcination at 550 °C in air for 3 h.
Ni/zeolite catalysts were characterized using X-ray diffraction (XRD) with powder diffractometer (PHILIPS-binary X'Pert MPD, 30 mA, 40 kV) and the radiation of Cu-Kα ranging from 2θ = 5° to 50°. The Scherrer equation was used to calculate the average size of NiO (D) (eqn (3)).
| |
DNiO = (0.9λ)/β![[thin space (1/6-em)]](https://www.rsc.org/images/entities/char_2009.gif) cos cos![[thin space (1/6-em)]](https://www.rsc.org/images/entities/char_2009.gif) θ θ
| (3) |
where
λ is the wavelength of X-ray following the Cu-Kα radiation of 0.15406 nm,
β is the broadening line of the Ni (1 1 1) reflection (radians), and
θ is the Bragg angle diffraction.
Infrared analysis was carried out using Shimadzu Spectrum One 8400S. Intermediate species during CO2 methanation was determined using in situ FTIR analysis. The pelleted catalyst was placed in the in situ cell equipped with CaF2 windows, and flowed with CO2 at 4 torr and H2 at 16 torr at room temperature. The reaction temperature was raised to 350 °C and the spectra with the resolution of 4 cm−1 was collected at 50 scans.
The textural properties of Ni/zeolite catalysts were analyzed using N2 adsorption–desorption method (Beckman Coulter SA 3100). The solid was outgassed at 90 °C for 1 h then heated at 300 °C for 4 h under vacuum prior to N2 adsorption. The pore size distribution was determined using Non-Localized Density Functional Theory (NLDFT). The volume of adsorbed N2 at the relative pressure (P/P0) of 0.97 was evaluated as the total pore volume (Vtotal). In addition, the t-plot method was used to calculate the external surface area (Sext) and micropore volume (Vmicro). The mesopore volume (Vmeso) was determined based on the subtraction of Vtotal with Vmicro (Vtotal − Vmicro).
Surface morphology was analyzed using scanning electron microscopy equipped with energy dispersive X-ray spectroscopy (SEM-EDX JEOL JEM-2100F) and high-resolution transmission electron microscope (Hitachi HR-9500 TEM). Catalysts was coated with carbon coating before SEM measurement. For TEM analysis, catalysts were ground, dispersed with isopropyl alcohol, and then placed in TEM grid and dried before analysis.
H2 temperature programmed reduction (H2-TPR) was used to determine the dispersion of Ni, and CO2 temperature programmed desorption (CO2-TPD) was used for the analysis of basic sites. The measurements were assessed by TPDRO (AutochemII 2920 Chemisorption Apparatus, Micromeritics). For the analysis of H2-TPR, catalyst was pretreated at 500 °C for 1 h under air flow, then cooled to room temperature in He flow. The temperature was increased to 900 °C at heating rate 10 °C min−1 under 10%/H2/Ar flow. Prior to CO2-TPD analysis, the catalyst was reduced under H2 stream at 500 °C for 2 h. The catalyst was then flushed with N2 and cooled down to 50 °C in He flow. CO2 stream was introduced for 30 min and changed into He flow for another 30 min to remove excess adsorbed gas. CO-TPD profiles were recorded by heating the catalysts up to 650 °C (heating rate 10 °C min−1). The desorbed CO2 from the catalyst was analyzed using thermal conductivity detector (TCD).
Coke formation on the Ni/zeolite catalysts were characterized using O2-TPO analysis. The sample recovered from the reaction was pre-treated for 1 h in He flow at 300 °C, cooled down to 200 °C, and then introduced with 5 vol% O2/He flow (30 mL min−1). The sample was heated to 850 °C with heating rate of 10 °C min−1.
Catalytic performance
CO2 methanation reaction was conducted between 200–500 °C at atmospheric pressure in a fixed-bed quartz reactor (internal diameter = 8 mm). 0.2 g of catalysts (20–40 μm) was annealed in situ under air stream at 550 °C for 1 h, followed with reduction for 4 h using hydrogen stream. The temperature was reduced to 200 °C and H2 and CO2 gases (4![[thin space (1/6-em)]](https://www.rsc.org/images/entities/char_2009.gif) :
:![[thin space (1/6-em)]](https://www.rsc.org/images/entities/char_2009.gif) 1 ratio) was fed at the GHSV of 50
1 ratio) was fed at the GHSV of 50![[thin space (1/6-em)]](https://www.rsc.org/images/entities/char_2009.gif) 000 mL g−1 h−1. On-line GC (7820 N Agilent gas chromatograph) equipped with moisture trap and Carboxen 1010 TCD was used to analyze the gas composition. The gas was analyzed after approximately 10 min when each temperature reached the steady-state operation. The conversion of CO2 and the selectivity of CH4 were calculated using eqn (4) and (5).
000 mL g−1 h−1. On-line GC (7820 N Agilent gas chromatograph) equipped with moisture trap and Carboxen 1010 TCD was used to analyze the gas composition. The gas was analyzed after approximately 10 min when each temperature reached the steady-state operation. The conversion of CO2 and the selectivity of CH4 were calculated using eqn (4) and (5).| | |
XCO2 (%) = (MCH4 + MCO)/(MCO2 + MCH4 + MCO) × (100%)
| (4) |
| | |
SCH4 (%) = (MCH4)/(MCH4 + MCO) × (100%)
| (5) |
where XCO2 was CO2 conversion (%), SCH4 was CH4 selectivity and M was mol of gas passing through the reactor.
Results and discussion
XRD analysis
XRD analysis was carried out to confirm the formation of zeolite crystalline phase (Fig. 1). NaY diffraction peaks were observed at 2θ = 6.31, 10.31, 12.31, 15.92, 19.01, 20.71, 24.06, 27.52, and 31.95° in accordance with JCPDS no. 39-1380 on Ni/NaY catalysts. ZSM-5 crystalline phase was observed on Ni/NaZSM-5 catalysts based on the peaks at 2θ = 7.8, 8.7, 23.0, 23.8, and 24.0° (JCPDS no. 44-0003). Ni/NaBEA showed the peaks at 2θ = 7.7, 21.4, and 22.5° corresponded to zeolite beta (JCPDS 48-0038), meanwhile Ni/NaA showed the peaks at 2θ = 7.2, 10.2, 12.5, 16.1, 21.6, 24, 26.1, 27.1, 29.9, and 34.2° corresponded to NaA zeolite (JCPDS no. 00-039-0222). XRD analysis of Ni/zeolite also showed the peaks at 2θ = 37.3 and 43.3° corresponded to the (111) and (200) planes of bunsenite NiO phase with face-centered cubic structures.40 The average sizes of NiO particles were determined using the Scherrer equation from the FHWM of the (111) plane (Table 2). NiO crystallite sizes were increased in the following order: Ni/NaY (17 nm) < Ni/NaZSM-5 (20 nm) < Ni/NaBEA (25 nm) < Ni/NaA (27 nm). The size of NiO nanoparticles showed a positive correlation with the surface area of zeolite support which implied the high surface area zeolite increased the NiO dispersion therefore reduced the particle size.
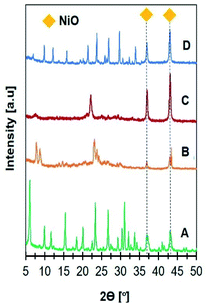 |
| | Fig. 1 XRD patterns of catalysts (A) 15Ni/NaY, (B) 15Ni/NaZSM-5, (C) 15Ni/NaBEA, and (D) 15Ni/NaA used in CO2 methanation. | |
Table 2 Physicochemical properties of catalysts
| Sample |
SBETa (m2 g−1) |
Sextb (m2 g−1) |
Vmesob (cm3 g−1) |
Vmicrob (cm3 g−1) |
Vtotalb (cm3 g−1) |
NiO particle sizec (nm) |
DDd (%) |
TH2 desorptiond (°C) |
H2 uptaked (mmol g−1) |
TCO2 desorptione (°C) |
CO2 uptakee (mmol g−1) |
O2 uptakef (mmol g−1) |
| BET surface area. External surface areas (Sext) and pore volume calculated using t-plot method. Calculated based on the NiO (111) plane from XRD using Scherrer equation. Dispersion degree (DD) and H2 uptake based on the H2-TPR. CO2 uptake based on the CO2-TPD. O2 uptake based on the TPO of the spent catalysts. |
| 15Ni/NaY |
415 |
73 |
0.17 |
0.22 |
0.37 |
17.89 |
85.01 |
428 |
5.10 |
89 |
0.65 |
0.98 |
| 630 |
2.23 |
221 |
1.23 |
| 15Ni/NaZSM-5 |
315 |
327 |
0.28 |
0.10 |
0.38 |
20.86 |
71.54 |
423 |
0.66 |
615 |
2.64 |
0.44 |
| 463 |
1.19 |
| 563 |
0.36 |
| 15Ni/NaBEA |
264 |
62 |
0.15 |
0.09 |
0.24 |
25.05 |
36.33 |
380 |
0.03 |
202 |
0.08 |
1.40 |
| 665 |
2.18 |
471 |
0.25 |
| |
|
629 |
0.69 |
| 15Ni/NaA |
6 |
13 |
0.05 |
— |
0.05 |
27.82 |
27.73 |
477 |
3.73 |
148 |
0.05 |
2.91 |
| 633 |
1.04 |
256 |
0.03 |
| |
|
722 |
0.13 |
Infrared analysis
Infrared analysis of all Ni/zeolite catalysts in Fig. 2 showed the absorption bands at 3446 cm−1 represented the stretching vibration of O–H functional group of the adsorbed water. For Ni/NaY, the absorption bands appeared at 459 cm−1 and 574 cm−1 were ascribed to the vibration of T–O4 (T = Si, Al) and the D4R or D6R double rings, respectively. Symmetrical internal and external vibrations of the O–T–O bond were observed at 698 cm−1 and 786 cm−1. The band appeared at 1012 cm−1 was attributed to the symmetric stretching vibrations of T–O–T bond.36 Ni/ZSM-5 showed the absorption bands at 1070 cm−1 and 790 cm−1 which were assigned to the symmetric stretching vibrations of T–O–T bond and O–T–O bond, meanwhile 449 cm−1 band was assigned to the asymmetric stretching of the tetrahedral T–O4. The shoulder peak at 542 cm−1 was corresponded to the characteristic five-membered ring vibration of MFI zeolite framework.41 The absorption bands of Ni/NaBEA at 1058, 779, 565, and 461 cm−1 were corresponded to the vibrations of T–O–T bond, O–T–O bond, double 6-membered rings, and asymmetric stretching of the tetrahedral T–O4, respectively.39 For Ni/NaA, a strong absorption band at 989 cm−1 was assigned to the internal asymmetric stretching vibrations of Al–O or Si–O on T–O–T bond. The absorption bands at 700 cm−1 and 461 cm−1 were attributed to O–T–O bond and asymmetric stretching of the tetrahedral T–O4. The characteristic of zeolite NaA double ring was confirmed by the absorption band at 555 cm−1.42
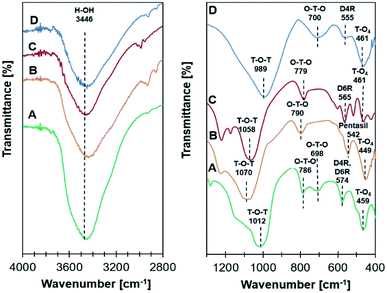 |
| | Fig. 2 Infrared analysis spectra on catalyst (A) Ni/NaY, (B) Ni/NaZSM-5, (C) Ni/NaBEA, and (D) Ni/NaA. | |
N2 adsorption–desorption analysis
The N2 adsorption–desorption analysis in Fig. 3 revealed the formation of zeolites with different textural properties. Ni/NaY and Ni/NaBEA catalysts showed the type I isotherm which is the typical isotherm for microporous zeolite. A high N2 uptake was observed at P/P0 < 0.1 due to the adsorption in micropores, followed with gradual adsorption of N2 at elevated pressure. Even though NaA was also classified as microporous zeolite, the N2 adsorption–desorption analysis indicated the type III isotherm of a non-porous material. This was due to the fact that the pore diameter of NaA at ∼0.3 nm was smaller than the size of nitrogen molecules, thus preventing the diffusion of N2 molecules in the micropores.43 Ni/NaZSM-5 catalyst showed the type IV isotherm with capillary condensation at P/P0 > 0.5, which indicated the formation of mesoporous material. In mesoporous Ni/NaZSM-5 zeolite, the adsorption of N2 at low pressure was significantly lower than the N2 uptake in microporous Ni/NaY, but the amount of adsorbed N2 was increased at high pressures due to the multilayer N2 adsorption.44,45 The pore volume and the surface area of the catalysts calculated from N2 adsorption–desorption analysis were summarized in Table 2. The surface area of Ni/NaY was determined at 415 m2 g−1 followed with Ni/NaZSM-5 at 315 m2 g−1, Ni/NaBEA at 264 m2 g−1 and Ni/NaA at 6 m2 g−1.
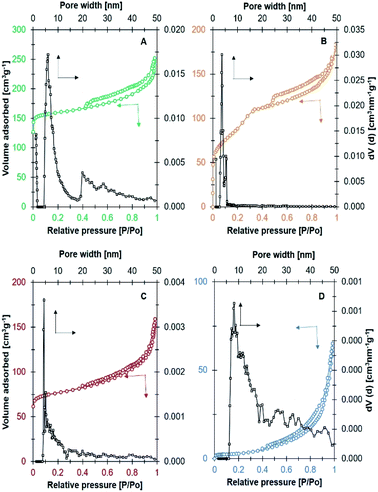 |
| | Fig. 3 N2 adsorption–desorption isotherm and NLDFT pore size distribution on catalyst (A) Ni/NaY, (B) Ni/NaZSM-5, (C) Ni/NaBEA, and (D) Ni/NaA used in CO2 methanation. | |
Morphology analysis
FESEM analysis was used to determine the morphology of the catalysts (Fig. 4). NaY, NaZSM-5, and NaBEA showed the formation of large crystallites with the average diameter was determined at ∼100–300 nm. However, NaA showed the formation of nanosperical aggregates deposited on a well-defined cubic crystallite. The size of cubic crystallite was determined at ∼500 nm. The EDX analysis of the catalysts showed the homogeneous distribution of Ni nanoparticles on the zeolite surfaces. Ni/NaY was also analysed using HRTEM analysis to determine the average size of NiO particles. NiO was homogeneously dispersed on NaY with the average diameter was determined at ∼21 ± 5.4 nm. The diameter determined from TEM analysis was in agreement with the calculated NiO size determined using Scherrer equation (Table 2).
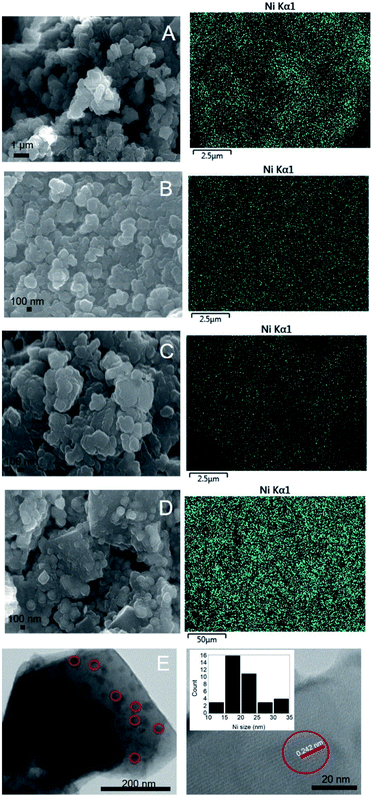 |
| | Fig. 4 FESEM images of catalyst (A) Ni/NaY, (B) Ni/NaZSM-5, (C) Ni/NaBEA, (D) Ni/NaA and (E) HRTEM images of Ni/NaY. | |
H2-TPR analysis
H2-TPR analysis of the catalysts provided information on the reducibility and the dispersion of Ni nanoparticles (Fig. 5). All Ni/zeolite catalysts showed two main reduction peaks at 300–450 °C and 550–650 °C. The H2-TPR peak of Ni impregnated onto NaY, NaZSM-5, and NaA were observed at ∼400 °C suggested that NiO was mostly occupied on the external surface of zeolite.16,46 However, Ni/NaBEA showed the first reduction peak at 380 °C with significantly lower H2 uptake which may be originated from the formation of oxygen vacancies.47 The second peak was observed at 665 °C with relatively high H2 uptake implied the Ni/NaBeA has high activation energy compared to the rest of the catalysts. Ni/NaZSM-5 showed the presence of three NiO species that may be due to the formation of Ni on the external surface and within the pores. The TPR peak observed at 423 °C was corresponded to the reduction of the external NiO, meanwhile the peak at 453 °C indicated the reduction of NiO deposited within the ZSM-5 mesopores. The peak observed at 563 °C was corresponded to the reduction of NiO particles that presumably were octahedrally coordinated with the six framework atoms of zeolite, which were more stable than the tetrahedral coordinated NiO.30,48 H2-TPR analysis also revealed the amount of H2 uptake for Ni/NaY was significantly higher than Ni/NaZSM, Ni/NaBeA and Ni/NaA. The amount of Ni active sites and the dispersion degree (DD) were determined based on the amount of H2 pulse chemisorption analysis and summarized in Table 2. The degree of dispersion was significantly improved when Ni was impregnated on high surface of zeolite, following the order of Ni/NaY > Ni/NaZSM-5 > Ni/NaBeA > Ni/NaA.
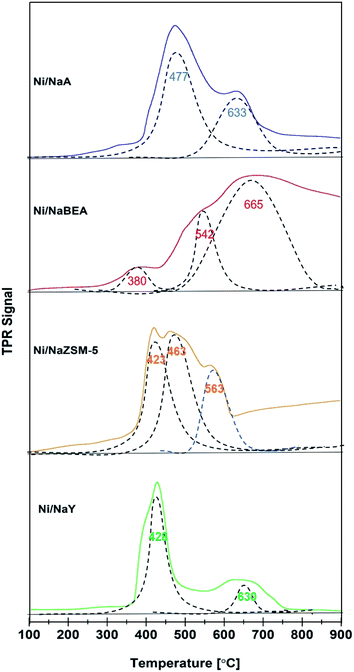 |
| | Fig. 5 H2-TPR profiles on catalyst used in CO2 methanation. | |
CO2-TPD analysis
CO2-TPD analysis provided information of the CO2 adsorption capacity and the strength of the basic sites (Fig. 6). Since CO2 is a weak Lewis acid, the amount of CO2 desorption represented to the number of basic sites, meanwhile the CO2 desorption temperature indicated the strength of the basic sites. Desorption of CO2 was observed on Na/NaY at temperature below 300 °C, which was corresponded to the presence of weak and medium strength basicity. Ni/ZSM-5 and Ni/BEA showed a broad CO2 desorption peak at 400–600 °C, which was consistent with the presence of strong basic sites. The CO2 desorption peak of Ni/NaA was observed at much higher temperature ∼700–800 °C which implied a much stronger interaction between the basic sites of NaA with CO2. The number of basic sites calculated from CO2 uptake showed the Ni/NaY has a large number of basic sites, followed with Ni/ZSM-5, Ni/NaBEA and Ni/NaA (Table 2). In principle, the presence of basic sites facilitated the adsorption of CO2 during catalytic reaction. However, when CO2 was strongly adhered on the zeolite, the mobility may be reduced and therefore restricting the diffusion of CO2 during CO2 methanation. For low temperature CO2 methanation, the presence of weak basicity was crucial to enhance the diffusion of CO2.49
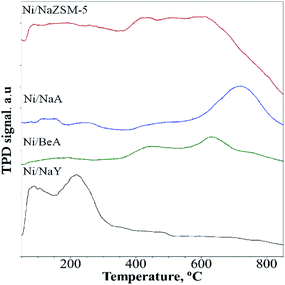 |
| | Fig. 6 CO2-TPD profiles on catalyst used in CO2 methanation. | |
CO2 methanation at 200–500 °C
CO2 methanation was carried out at 200–500 °C to determine the activity of Ni/zeolite catalysts (Fig. 7A). Ni/NaY showed ∼21% of CO2 conversion at 200 °C with 100% selectivity towards methane. The conversion was significantly higher when compared with Ni impregnated on NaZSM-5 (11%), NaBEA (10%) and NaA (5%). However, when the temperatures were increased to 250 °C and 300 °C, Ni/NaZSM-5 showed a higher CO2 conversion than Ni/NaY. All the catalysts reached optimum CO2 conversion at 400 °C. When the temperature was increased to 500 °C, the CO2 conversion was slightly reduced due to the thermodynamic limitation of CO2 methanation.19,50 Fig. 7B showed the yield and the selectivity of CH4 at elevated temperatures on the Ni/zeolite catalysts. All the catalysts showed 100% selectivity towards methane from 200 °C to 400 °C apart from Ni/NaA. CO was produced at 450 °C presumably due to the steam-methane reforming (SR) or the reversed water gas shift reaction (RWGS) (eqn (2)). At the optimum reaction temperature i.e., 400 °C, the catalytic activity of the catalysts were increased in the order of Ni/NaA < Ni/NaBEA < Ni/NaZSM-5 < Ni/NaY.
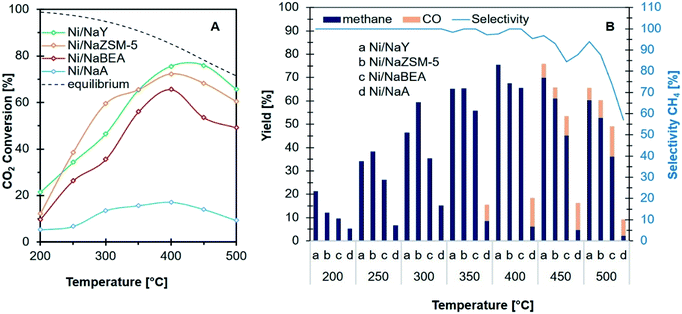 |
| | Fig. 7 Catalytic performance (A) conversion of CO2 and (B) product distribution and selectivity of CH4 of catalysts used in CO2 methanation. | |
The stability of the catalysts
The activity of Ni/zeolite catalysts were further investigated at 400 °C for 40 h in order to determine the effect of zeolite porosity in improving the stability of the catalysts (Fig. 8). Ni/NaY as microporous zeolite catalyst exhibited 75% of CO2 conversion, however the conversion was slightly reduced to 70% after 30 h. Ni/NaA was deactivated within 10 h of reaction due to the size of micropore was smaller than CO2 molecules, thus reducing the efficiency of CO2 diffusion. Ni/NaZSM-5 as mesoporous zeolite showed 69% of CO2 conversion with similar catalytic performance up to 40 h of reaction. Temperature Program Oxidation (TPO) was used to analyse the amount of carbon coke on the catalysts after reaction (Fig. 9). In general, coke can be divided into light coke (coke I) that oxidized at relatively low temperatures ∼300–500 °C, and heavy coke (coke II) that required oxidation at much higher temperatures ∼525–650 °C. Light coke was consisted of the hydrogenated carbon species whereas heavy coke was often caused by the deposition of polycondensed aromatic or graphitic carbon.51,52 The coke analyzed on Ni/NaY, Ni/NaA, and Ni/NaZSM-5 were characterized as hydrogenated carbon species based on the decomposition peak appeared at temperature below 500 °C. During CO2 hydrogenation, coke was produced at high temperatures via Boudouard reaction (eqn (6)),53 methane cracking/pyrolysis (eqn (7)),54 and CO2 or CO reduction (eqn (8) and (9)).55,56 The amount of O2 uptake was measured at ∼0.44 mmol g−1 for Ni/NaZSM-5 catalyst, which was significantly lower compared to Ni/NaY (0.98 mmol g−1) and NaA (2.91 mmol g−1). The TPO analysis of Ni/NaA catalysts recovered from the reaction revealed the deactivation in 10 h was due to the deposition of large quantity of carbon coke on the catalyst surface. The results also showed the important role of mesopores in NaZSM-5 in enhancing the stability of the catalysts. The deactivation predominantly was initiated by the deposition of coke on the active sites or the blocking of pore opening, which consequently hindering the mass transfer within the zeolite.| | |
2CO (g) ↔ C (s) + CO2 (g) ΔH298 K = −172.4 kJ mol−1
| (6) |
| | |
CH4 (g) ↔ C (s) + 2H2 (g) ΔH298 K = 74.6 kJ mol−1
| (7) |
| | |
CO2 (g) + 2H2 (g) ↔ C (s) + 2H2O (g) ΔH298 K = −90.1 kJ mol−1
| (8) |
| | |
CO (g) + H2 (g) ↔ C (s) + H2O (g) ΔH298 K = −131.3 kJ mol−1
| (9) |
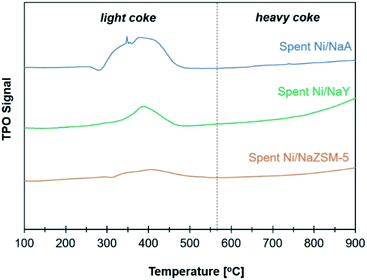 |
| | Fig. 8 TPO profiles on catalyst used in CO2 methanation. | |
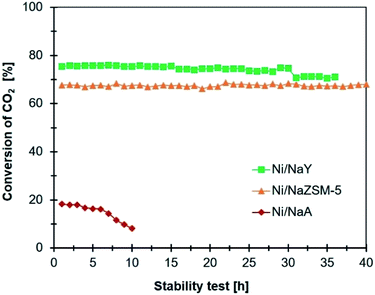 |
| | Fig. 9 Comparison stability test of catalyst (reaction conditions: reaction temperature: 400 °C, GHSV = 24![[thin space (1/6-em)]](https://www.rsc.org/images/entities/char_2009.gif) 900 mL g−1 h−1, 1 atm, and H2/CO2 = 4/1). 900 mL g−1 h−1, 1 atm, and H2/CO2 = 4/1). | |
Mechanistic study of CO2 methanation
In situ FTIR analysis of CO2 methanation (Fig. 10) was performed to determine the intermediate species produced during the reaction that can be used to propose the reaction mechanism. The intermediate species and their corresponding absorption band were summarized in Table 3. A plausible mechanism of CO2 methanation derived from in situ FTIR analysis was shown in Scheme 1. The absorption band at ∼2400–2300 cm−1 was assigned to the vibration of adsorbed CO2 on zeolite support.57 CO2 adsorption occurred via electrostatic interaction onto Na+ or EFAL (Al–O) on Na-zeolite as evidenced from the formation of bidentate carbonate species at 1681 cm−1. However, the peak was only observed on Ni/NaY suggesting the high density of weak basic site of NaY have facilitated the formation of bidentate carbonate at low temperature. The peak of the bidentate carbonate on Ni/NaY was reduced when the temperature was increased to 350 °C, meanwhile the peaks at 1627 and 1430 cm−1 showed the increase of intensity due to the formation of hydrogen carbonate species.58 CO2 can also undergo disproportionation reaction (eqn (10)) or dissociation reaction to form CO (eqn (11)). The adsorbed bidentate carbonate was then reacted with the dissociated hydrogen to form hydrogen carbonate. The transition of bidentate carbonate to hydrogen carbonate was observed at room temperature on NaY. However, the transition was negligible on NaZSM-5, NaBeA and NaA. The formation of hydrogen carbonate was catalysed by metallic Ni0 nanoparticles. Hydrogen gas was dissociated on Ni0 into H atoms,59–62 and spilled over onto the zeolite support.14,22 NaZSM-5, NaBeA and NaA catalysts only showed hydrogen carbonate species with the intensity increased with temperatures. Subsequently, the dissociated hydrogen atom was reacted with the hydrogen carbonate to generate bidentate formats (eqn (12)).29 The formation of formate intermediate was confirmed by the presence of shoulder peak at 1546 cm−1 on Ni/NaY catalyst. Formate can decompose to CO at high temperature according to eqn (13) (ref. 58) or further hydrogenated to form methane (eqn (14)). The presence of formate was negligible on NaZSM-5, NaBeA and NaA. Ni/NaZSM-5 and Ni/NaA showed the appearance of CO carbonyl band at 1930 cm−1 suggesting the CO2 methanation reaction occurred via the CO formation route. The plausible reaction mechanism that was derived from the in situ FTIR analysis was illustrated in Scheme 1. In situ FTIR analysis suggested two types of reaction mechanism on Ni/zeolite catalysts:
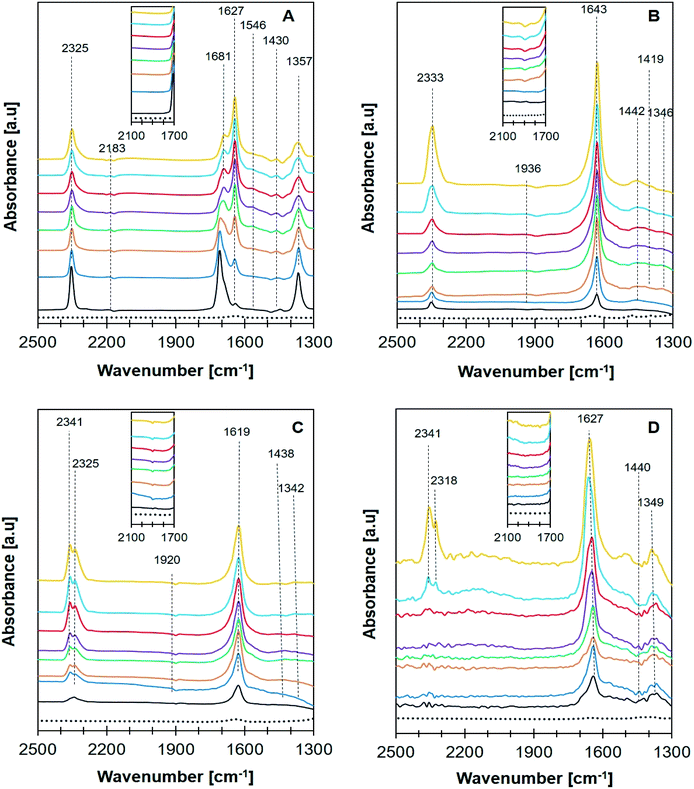 |
| | Fig. 10 FTIR in situ spectra recorded of CO2 + H2 adsorption over catalyst (A) Ni/NaY, (B) Ni/NaZSM-5, (C) Ni/NaBEA, and (D) Ni/NaA at room temperature (black), 50 °C (blue), 100 °C (orange), 150 °C (green), 200 °C (purple), 250 °C (red), 300 °C (light blue), 350 °C (yellow), and blank for no adsorption (…). | |
Table 3 Reaction intermediates in CO2 methanation
| Adsorption species |
Vibration mode |
Wavenumber (cm−1) |
Ref. |
| Ni/NaY |
Ni/NaZSM-5 |
Ni/NaBEA |
Ni/NaA |
| Bidentate carbonate |
νas(CO3) |
1681 |
— |
— |
— |
20 and 64 |
| Bicarbonate HCO3− |
νas(CO3) |
1627 |
1643 |
1619 |
1627 |
20 and 65 |
| νs(CO3) |
1430 |
1440 |
— |
1440 |
| Bidentate formate HCOO− |
νs(CO2) |
1546 |
— |
— |
— |
20 and 66 |
| Monodentate carbonate |
|
1357 |
1346 |
1369 |
1342 |
49 |
| CO2 gas vibration |
— |
2183, 2325 |
2333 |
2329, 2333 |
2318, 2341 |
8 and 67 |
| Carbonyl |
— |
— |
1936 |
1920 |
— |
66 |
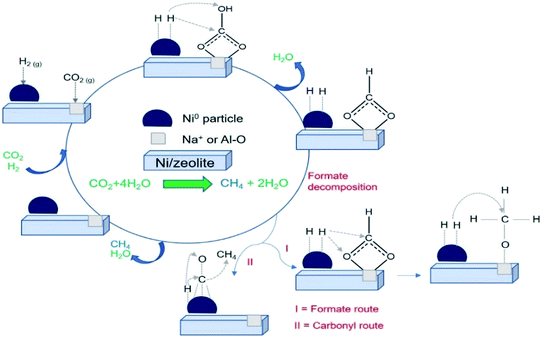 |
| | Scheme 1 Plausible mechanism of CO2 methanation for Ni/zeolite catalysts. | |
(i) CO2 methanation to CH4 via formate intermediate
(ii) CO2 methanation to CH4 via CO intermediate
High interfacial interaction that was developed between Ni and zeolite has efficiently directed the hydrogen atom to react with the adsorbed carbonate. There is a possibility that Ni/NaY followed the formate intermediate pathway, meanwhile Ni/NaBEA and Ni/NaZSM-5 followed the CO intermediate pathway. The formation of formate species were proved to be the pivotal intermediate species.63 Due to the instability of formate, the increasing of interfacial interaction between metal and zeolite support was crucially important to enhance the reaction between dissociated hydrogen with formate to form methane. Methane formation occurred via multiple hydrogen insertion and C–O dissociation.
| | |
2CO2(ads) → CO(ads) + CO3(ads)
| (10) |
| | |
CO2(ads) → CO(ads) + O(ads)
| (11) |
| | |
CO32−(ads) + 2H(ads) → HCOO−(ads) + OH(ads)
| (12) |
| | |
HCOO−(ads) ↔ HCO−(ads) + O(ads) ↔ CO(ads) + OH(ads)
| (13) |
| | |
HCOO−(ads) + 4H(ads) ↔ CH4(ads) + HO(ads)
| (14) |
Discussion
Impregnation of Ni on NaY has enhanced the conversion of CO2 to methane at 200 °C. NaY synthesized from kaolin as aluminosilicate precursor exhibited high surface area, microporosity and medium strength basicity. The increased of basicity enhanced the donation of the electron pair from the lattice oxygen during CO2 methanation to produce bidentate carbonate. In Ni/NaY catalyst, CO2 was adsorbed via the formation of bidentate carbonate which was suggested to reduce the activation energy for the formation of formate.49 The low energy level of the adsorbed CO2 efficiently accepted the electron from the Lewis base, consequently reduced the C–O strength during hydrogenation.64 The dissociation of C–O bond was also improved at high temperature, mainly due to the formation oxygen vacancies resulting from the dehydroxylation of zeolite, thus further enhanced the C–O bond dissociation.63
Another important parameter that enhanced Ni activity at low temperature was the dispersion of Ni nanoparticles. Fig. 11 illustrates the relationship between metal dispersion and surface basicity of the catalysts with the production of methane. Ni dispersion was significantly enhanced on high surface area zeolite, however mesoporosity has negligible effect in increasing the dispersion. The dispersion degree of Ni/NaY was estimated at ∼85%, which was significantly higher than the rest of the catalysts. NaY increased the dispersion degree of Ni which is a highly significant parameter to improve Ni/zeolite interfacial interaction. CO2 molecule is very unlikely to be strongly adsorbed on Ni, but Ni can catalyse H2 dissociation.68 The formation of well-dispersed Ni nanoparticles created a higher interfacial contact with zeolite support, hence accelerating the spillover of the dissociated hydrogen to the zeolite surface to react with the bidentate carbonate.69 Summary of the previous work on Ni/zeolite catalysts in Table 4 revealed that most of the catalysts showed negligible activity at 200 °C. Our previous work on Ni while using 5% loading also showed almost no activity at temperature below 250 °C.36
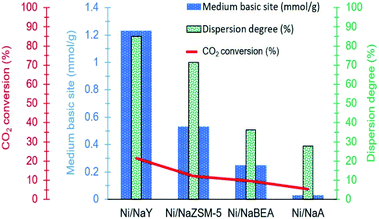 |
| | Fig. 11 Relationship between dispersion degree and surface basicity towards CH4 production. | |
Table 4 Summary of CO2 methanation on Ni catalysts at low temperature reaction
| Support |
Ni loading (%) |
Temperature (°C) |
GHSV (h−1) |
XCO2 (%) |
YCH4 (%) |
SCH4 (%) |
References |
| Zeolite X – fly ash |
10 |
200 |
12![[thin space (1/6-em)]](https://www.rsc.org/images/entities/char_2009.gif) 000 000 |
ND |
— |
— |
31 |
| 250 |
0 |
| Na-beta |
9.5 |
200 |
10![[thin space (1/6-em)]](https://www.rsc.org/images/entities/char_2009.gif) 000 000 |
0 |
— |
— |
29 |
| 250 |
1 |
| Na–Y |
9.9 |
200 |
10![[thin space (1/6-em)]](https://www.rsc.org/images/entities/char_2009.gif) 000 000 |
0 |
— |
— |
29 |
| 250 |
3 |
| USY |
5 |
200 |
43![[thin space (1/6-em)]](https://www.rsc.org/images/entities/char_2009.gif) 000 000 |
ND |
— |
— |
71 |
| 250 |
3 |
| USY |
15 |
200 |
43![[thin space (1/6-em)]](https://www.rsc.org/images/entities/char_2009.gif) 000 000 |
ND |
— |
— |
26 |
| 250 |
8 |
8 |
99 |
| NaY–M |
5 |
200 |
12![[thin space (1/6-em)]](https://www.rsc.org/images/entities/char_2009.gif) 500 500 |
0 |
0 |
0 |
36 |
| 250 |
3 |
3 |
100 |
| NaY–WM |
5 |
200 |
12![[thin space (1/6-em)]](https://www.rsc.org/images/entities/char_2009.gif) 500 500 |
0 |
0 |
0 |
36 |
| 250 |
13 |
13 |
100 |
| NaY |
15 |
200 |
12![[thin space (1/6-em)]](https://www.rsc.org/images/entities/char_2009.gif) 500 500 |
21 |
21 |
100 |
This work |
| 250 |
33 |
33 |
100 |
The effect of pore structure of zeolite can be seen on the stability of the catalysts. NaA with a very narrow pore opening was deactivated within 10 h of reaction, meanwhile mesoporous ZSM-5 showed catalytic stability up to 40 h. The space confinement of the micropores have altered the thermodynamic of the reaction and the transport properties of the reactants/intermediates.70 Although in principle the mesoporous ZSM-5 increased the diffusion of CO2 and CH4, the lack of activity compared to NaY at low temperature was due to the low basicity of the support that reduced the ability for CO2 adsorption. Nevertheless, the benefit of mesoporosity was observed on the enhanced mass transfer consequently reducing the amount of carbon coke.
Conclusions
Utilisation of zeolite with high surface area, porosity and basicity as support for Ni nanoparticles have enhanced the catalytic activity for CO2 methanation at 200 °C. The improved conversion was due to the synergistic effect between the highly dispersed Ni as hydrogen dissociation centre and the basicity of zeolite as CO2 adsorption site. Microporous NaY derived from kaolin effectively dispersed Ni nanoparticles on the external surface of NaY, created a higher degree of interfacial interaction with the basic sites of NaY. NaY adsorbed CO2 at low temperature via the formation of bidentate carbonate, followed with the subsequent hydrogenation at Ni/NaY interface to give 21% of methane production at 200 °C. Although the mesoporosity of zeolite has a very little effect in increasing the dispersion and the activity at low temperatures, the efficient product/reactant diffusion in the mesopores has contributed to the stability of Ni/NaZSM-5 for up to 40 h at 400 °C. In situ FTIR analysis indicated that Ni catalysts followed two different reaction pathways either via CO or formate hydrogenation depending on the surface basicity of the zeolite support. The results highlighted the crucial role of zeolite as support, which was primarily responsible to adsorb CO2 during methanation reaction.
Conflicts of interest
There are no conflicts to declare.
Acknowledgements
The authors would like to acknowledge the help of Nurul Asikin Mijan for the discussion. The research was supported by the Ministries of Research, Technology, and Higher Education Republic of Indonesia [PMDSU No. 5/EI/KP.PTNBH/2019, 27/EI/KPT/2020 and World Class Research (WCR) No. 080/SP2H/LT/DRPM/2021], Universiti Brunei Darussalam [UBD/RSCH/URC/RG(b)/2019/012], Universiti Teknologi Malaysia [Transdisciplinary 06G52 and 06G53], and Universiti Putra Malaysia [LRSG NanoMITE No. 5526308].
Notes and references
- J. Y. Ahn, S. W. Chang, S. M. Lee, S. S. Kim, W. J. Chung, J. C. Lee, Y. J. Cho, K. S. Shin, D. H. Moon and D. D. Nguyen, Fuel, 2019, 250, 277–284 CrossRef CAS.
- C. C. Truong and D. K. Mishra, J. CO2 Util., 2020, 41, 101252 CrossRef CAS.
- H. Bahruji, M. Bowker, G. Hutchings, N. Dimitratos, P. Wells, E. Gibson, W. Jones, C. Brookes, D. Morgan and G. Lalev, J. Catal., 2016, 343, 133–146 CrossRef CAS.
- H. Bahruji, R. D. Armstrong, J. Ruiz Esquius, W. Jones, M. Bowker and G. J. Hutchings, Ind. Eng. Chem. Res., 2018, 57, 6821–6829 CrossRef CAS.
- J. R. Esquius, H. Bahruji, M. Bowker and G. Hutchings, Faraday Discuss., 2021 Search PubMed.
- J. B. Branco, P. E. Brito and A. C. Ferreira, Chem. Eng. J., 2020, 380, 122465 CrossRef CAS.
- S. Kumar, R. Srivastava and J. Koh, J. CO2 Util., 2020, 41, 101251 CrossRef CAS.
- M. Aziz, A. Jalil, S. Triwahyono and S. Sidik, Appl. Catal., A, 2014, 486, 115–122 CrossRef CAS.
- R. Lippi, S. C. Howard, H. Barron, C. D. Easton, I. C. Madsen, L. J. Waddington, C. Vogt, M. R. Hill, C. J. Sumby and C. J. Doonan, J. Mater. Chem. A, 2017, 5, 12990–12997 RSC.
- X. Guo, A. Traitangwong, M. Hu, C. Zuo, V. Meeyoo, Z. Peng and C. Li, Energy Fuels, 2018, 32, 3681–3689 CrossRef CAS.
- P. Frontera, A. Macario, M. Ferraro and P. Antonucci, Catalysts, 2017, 7, 59 CrossRef.
- K. Jalama, Catal. Rev., 2017, 59, 95–164 CrossRef CAS.
- H. Ma, K. Ma, J. Ji, S. Tang, C. Liu, W. Jiang, H. Yue and B. Liang, Chem. Eng. Sci., 2019, 194, 10–21 CrossRef CAS.
- C. Lv, L. Xu, M. Chen, Y. Cui, X. Wen, C.-e. Wu, B. Yang, F. Wang, Z. Miao and X. Hu, Fuel, 2020, 278, 118333 CrossRef CAS.
- M. Mihet and M. D. Lazar, Catal. Today, 2018, 306, 294–299 CrossRef CAS.
- T. A. Le, J. Kim, J. K. Kang and E. D. Park, Catal. Today, 2020, 348, 80–88 CrossRef CAS.
- L. Falbo, C. G. Visconti, L. Lietti and J. Szanyi, Appl. Catal., B, 2019, 256, 117791 CrossRef CAS.
- R. Lippi, A. M. D’Angelo, C. Li, S. C. Howard, I. C. Madsen, K. Wilson, A. F. Lee, C. J. Sumby, C. J. Doonan and J. Patel, Catal. Today, 2020, 368, 66–77 CrossRef.
- J. Lin, C. Ma, Q. Wang, Y. Xu, G. Ma, J. Wang, H. Wang, C. Dong, C. Zhang and M. Ding, Appl. Catal., B, 2019, 243, 262–272 CrossRef CAS.
- X. Jia, X. Zhang, N. Rui, X. Hu and C.-j. Liu, Appl. Catal., B, 2019, 244, 159–169 CrossRef CAS.
- L. Hu and A. Urakawa, J. CO2 Util., 2018, 25, 323–329 CrossRef CAS.
- A. Cárdenas-Arenas, A. Quindimil, A. Davó-Quiñonero, E. Bailón-García, D. Lozano-Castello, U. De-La-Torre, B. Pereda-Ayo, J. A. González-Marcos, J. R. González-Velasco and A. Bueno-López, Appl. Catal., B, 2020, 265, 118538 CrossRef.
- Z. Bian, Y. M. Chan, Y. Yu and S. Kawi, Catal. Today, 2018, 347, 31–38 CrossRef.
- R.-P. Ye, Q. Li, W. Gong, T. Wang, J. J. Razink, L. Lin, Y.-Y. Qin, Z. Zhou, H. Adidharma and J. Tang, Appl. Catal., B, 2020, 268, 118474 CrossRef CAS.
- X. Wang, L. Zhu, Y. Liu and S. Wang, Sci. Total Environ., 2018, 625, 686–695 CrossRef CAS PubMed.
- M. Yang, Z. Lingjun, Z. Xiaonan, R. Prasert and W. Shurong, J. CO2 Util., 2020, 42, 101304 CrossRef CAS.
- M. Bacariza, M. Maleval, I. Graça, J. Lopes and C. Henriques, Microporous Mesoporous Mater., 2019, 274, 102–112 CrossRef CAS.
- F. Azzolina-Jury, D. Bento, C. Henriques and F. Thibault-Starzyk, J. CO2 Util., 2017, 22, 97–109 CrossRef CAS.
- A. Quindimil, U. De-La-Torre, B. Pereda-Ayo, J. A. Gonzalez-Marcos and J. R. Gonzalez-Velasco, Appl. Catal., B, 2018, 238, 393–403 CrossRef CAS.
- M. Bacariza, I. Graça, S. Bebiano, J. Lopes and C. Henriques, Chem. Eng. Sci., 2018, 175, 72–83 CrossRef CAS.
- N. Czuma, K. Zarębska, M. Motak, M. E. Galvez and P. Da Costa, Fuel, 2020, 267, 117139 CrossRef CAS.
- A. Borgschulte, N. Gallandat, B. Probst, R. Suter, E. Callini, D. Ferri, Y. Arroyo, R. Erni, H. Geerlings and A. Züttel, Phys. Chem. Chem. Phys., 2013, 15, 9620–9625 RSC.
- S. Li, G. Liu, S. Zhang, K. An, Z. Ma, L. Wang and Y. Liu, J. Energy Chem., 2020, 43, 155–164 CrossRef.
- S. Zhang, Q. Liu, Y. Yang, D. Wang, J. He and L. Sun, Appl. Clay Sci., 2017, 147, 117–122 CrossRef CAS.
- Q. Li, Y. Zhang, Z. Cao, W. Gao and L. Cui, Pet. Sci., 2010, 7, 403–409 CrossRef CAS.
- N. A. Sholeha, L. Jannah, H. N. Rohma, N. Widiastuti, D. Prasetyoko, A. A. Jalil and H. Bahruji, Clays Clay Miner., 2020, 68, 513–523 CrossRef.
- D. T. Kusumaningtyas, D. Prasetyoko, S. Suprapto, S. Triwahyono, A. A. Jalil and A. Rosidah, Bull. Chem. React. Eng. Catal., 2017, 12, 243–250 CrossRef CAS.
- A. A. Pour, S. Sharifnia, R. N. Salehi and M. Ghodrati, J. Nat. Gas Sci. Eng., 2016, 36, 630–643 CrossRef.
- D. Prasetyoko, Z. Ramli, S. Endud, H. Hamdan and B. Sulikowski, Waste Manage., 2006, 26, 1173–1179 CrossRef CAS PubMed.
- M. Y. S. Hamid, A. A. Jalil, A. F. A. Rahman and T. A. T. Abdullah, React. Chem. Eng., 2019, 4, 1126–1135 RSC.
- Z. G. L. V. Sari, H. Younesi and H. Kazemian, Appl. Nanosci., 2015, 5, 737–745 CrossRef CAS.
- C. A. Rios, C. D. Williams and M. A. Fullen, Appl. Clay Sci., 2009, 42, 446–454 CrossRef CAS.
- F. Hasan, R. Singh and P. A. Webley, Microporous Mesoporous Mater., 2012, 160, 75–84 CrossRef CAS.
- A. Talebian-Kiakalaieh and S. Tarighi, J. Ind. Eng. Chem., 2020, 88, 167–177 CrossRef CAS.
- S. Fernandez, M. L. Ostraat, J. A. Lawrence III and K. Zhang, Microporous Mesoporous Mater., 2018, 263, 201–209 CrossRef CAS.
- T. A. Le, J. Kim, J. K. Kang and E. D. Park, Catal. Today, 2020, 356, 622–630 CrossRef CAS.
- M. Hamid, M. Firmansyah, S. Triwahyono, A. A. Jalil, R. Mukti, E. Febriyanti, V. Suendo, H. Setiabudi, M. Mohamed and W. Nabgan, Appl. Catal., A, 2017, 532, 86–94 CrossRef CAS.
- M. Bacariza, I. Graça, J. Lopes and C. Henriques, Microporous Mesoporous Mater., 2018, 267, 9–19 CrossRef CAS.
- S. M. Lee, Y. H. Lee, D. H. Moon, J. Y. Ahn, D. D. Nguyen, S. W. Chang and S. S. Kim, Ind. Eng. Chem. Res., 2019, 58, 8656–8662 CAS.
- W. Gac, W. Zawadzki, M. Rotko, M. Greluk, G. Słowik and G. Kolb, Catal. Today, 2019, 357, 468–482 CrossRef.
- L. Emdadi, L. Mahoney, I. C. Lee, A. C. Leff, W. Wu, D. Liu, C. K. Nguyen and D. T. Tran, Appl. Catal., A, 2020, 595, 117510 CrossRef CAS.
- P. Guerra, A. Zaker, P. Duan, A. R. Maag, G. A. Tompsett, A. B. Brown, K. Schmidt-Rohr and M. T. Timko, Appl. Catal., A, 2020, 590, 117330 CrossRef CAS.
- Z. Li, X. Hu, L. Zhang, S. Liu and G. Lu, Appl. Catal., A, 2012, 417, 281–289 CrossRef.
- C. Mebrahtu, S. Perathoner, G. Giorgianni, S. Chen, G. Centi, F. Krebs, R. Palkovits and S. Abate, Catal. Sci. Technol., 2019, 9, 4023–4035 RSC.
- C. Mebrahtu, F. Krebs, S. Abate, S. Perathoner, G. Centi and R. Palkovits, in Studies in surface science and catalysis, Elsevier, 2019, vol. 178, pp. 85–103 Search PubMed.
- S. Rönsch, J. Schneider, S. Matthischke, M. Schlüter, M. Götz, J. Lefebvre, P. Prabhakaran and S. Bajohr, Fuel, 2016, 166, 276–296 CrossRef.
- C. Liang, Z. Gao, H. Lian, X. Li, S. Zhang, Q. Liu, D. Dong and X. Hu, Int. J. Hydrogen Energy, 2020, 45, 16153–16160 CrossRef CAS.
- A. Westermann, B. Azambre, M. Bacariza, I. Graça, M. Ribeiro, J. Lopes and C. Henriques, Appl. Catal., B, 2015, 174, 120–125 CrossRef.
- A. Westermann, B. Azambre, M. Bacariza, I. Graça, M. Ribeiro, J. Lopes and C. Henriques, Catal. Today, 2017, 283, 74–81 CrossRef CAS.
- P. U. Aldana, F. Ocampo, K. Kobl, B. Louis, F. Thibault-Starzyk, M. Daturi, P. Bazin, S. Thomas and A. Roger, Catal. Today, 2013, 215, 201–207 CrossRef CAS.
- M. Agnelli, H. Swaan, C. Marquez-Alvarez, G. Martin and C. Mirodatos, J. Catal., 1998, 175, 117–128 CrossRef CAS.
- F. Solymosi and A. Erdöhelyi, in Studies in Surface Science and Catalysis, Elsevier, 1981, vol. 7, pp. 1448–1449 Search PubMed.
- I. Balint, M.-A. Springuel-Huet, K.-i. Aika and J. Fraissard, Phys. Chem. Chem. Phys., 1999, 1, 3845–3851 RSC.
- K. Coenen, F. Gallucci, B. Mezari, E. Hensen and M. van Sint Annaland, J. CO2 Util., 2018, 24, 228–239 CrossRef CAS.
- H. Takano, Y. Kirihata, K. Izumiya, N. Kumagai, H. Habazaki and K. Hashimoto, Appl. Surf. Sci., 2016, 388, 653–663 CrossRef CAS.
- Y. Dai, M. Xu, Q. Wang, R. Huang, Y. Jin, B. Bian, C. Tumurbaatar, B. Ishtsog, T. Bold and Y. Yang, Appl. Catal., B, 2020, 277, 119271 CrossRef CAS.
- C. Liang, L. Zhang, Y. Zheng, S. Zhang, Q. Liu, G. Gao, D. Dong, Y. Wang, L. Xu and X. Hu, Fuel, 2020, 262, 116521 CrossRef CAS.
- M. Pozzo and D. Alfe, Int. J. Hydrogen Energy, 2009, 34, 1922–1930 CrossRef CAS.
- J. Li, E. Croiset and L. Ricardez-Sandoval, J. Phys. Chem. C, 2013, 117, 16907–16920 CrossRef CAS.
- T. Le, A. Striolo, C. H. Turner and D. R. Cole, Sci. Rep., 2017, 7, 1–12 CrossRef PubMed.
- M. C. Bacariza, I. s. Graça, S. S. Bebiano, J. M. Lopes and C. Henriques, Energy Fuels, 2017, 31, 9776–9789 CrossRef CAS.
|
| This journal is © The Royal Society of Chemistry 2021 |
Click here to see how this site uses Cookies. View our privacy policy here.  Open Access Article
 a,
Surahim Mohamad
 b,
Hasliza Bahruji
 c,
Didik Prasetyoko
 *a,
Nurul Widiastuti
 a,
Nor Aiza Abdul Fatahd,
Aishah Abdul Jalil
 de and
Yun Hin Taufiq-Yap
 b
b
![[thin space (1/6-em)]](https://www.rsc.org/images/entities/char_2009.gif) cos
cos![[thin space (1/6-em)]](https://www.rsc.org/images/entities/char_2009.gif) θ
θ
![[thin space (1/6-em)]](https://www.rsc.org/images/entities/char_2009.gif) :
:![[thin space (1/6-em)]](https://www.rsc.org/images/entities/char_2009.gif) 1 ratio) was fed at the GHSV of 50
1 ratio) was fed at the GHSV of 50![[thin space (1/6-em)]](https://www.rsc.org/images/entities/char_2009.gif) 000 mL g−1 h−1. On-line GC (7820 N Agilent gas chromatograph) equipped with moisture trap and Carboxen 1010 TCD was used to analyze the gas composition. The gas was analyzed after approximately 10 min when each temperature reached the steady-state operation. The conversion of CO2 and the selectivity of CH4 were calculated using eqn (4) and (5).
000 mL g−1 h−1. On-line GC (7820 N Agilent gas chromatograph) equipped with moisture trap and Carboxen 1010 TCD was used to analyze the gas composition. The gas was analyzed after approximately 10 min when each temperature reached the steady-state operation. The conversion of CO2 and the selectivity of CH4 were calculated using eqn (4) and (5).


![[thin space (1/6-em)]](https://www.rsc.org/images/entities/char_2009.gif) 900 mL g−1 h−1, 1 atm, and H2/CO2 = 4/1).
900 mL g−1 h−1, 1 atm, and H2/CO2 = 4/1).![[thin space (1/6-em)]](https://www.rsc.org/images/entities/char_2009.gif) 000
000![[thin space (1/6-em)]](https://www.rsc.org/images/entities/char_2009.gif) 000
000![[thin space (1/6-em)]](https://www.rsc.org/images/entities/char_2009.gif) 000
000![[thin space (1/6-em)]](https://www.rsc.org/images/entities/char_2009.gif) 000
000![[thin space (1/6-em)]](https://www.rsc.org/images/entities/char_2009.gif) 000
000![[thin space (1/6-em)]](https://www.rsc.org/images/entities/char_2009.gif) 500
500![[thin space (1/6-em)]](https://www.rsc.org/images/entities/char_2009.gif) 500
500![[thin space (1/6-em)]](https://www.rsc.org/images/entities/char_2009.gif) 500
500


