
 Open Access Article
 This Open Access Article is licensed under a Creative Commons Attribution-Non Commercial 3.0 Unported Licence
Thermal decomposition of ammonium perchlorate-based molecular perovskite from TG-DSC-FTIR-MS and ab initio molecular dynamics†
Pengfei Zhai ab,
Chengying Shia,
Shengxiang Zhao*b,
Wenbin Liua,
Wenxin Wangc and
Lina Yaob
ab,
Chengying Shia,
Shengxiang Zhao*b,
Wenbin Liua,
Wenxin Wangc and
Lina Yaob
aXi'an High-tech Research Institute, Xi'an 710025, People's Republic of China. E-mail: zhaipengfei104@163.com; shichengying104@163.com
bXi'an Modern Chemistry Research Institute, Xi'an 710065, People's Republic of China. E-mail: xamcri@126.com
cSichuan Honghua Industrial Co., Ltd., Chengdu 611130, People's Republic of China
First published on 4th May 2021
Abstract
(H2dabco)[NH4(ClO4)3] (DAP, dabco = 1,4-diazabicyclo[2.2.2]octane) is a recently synthesized ammonium perchlorate-based molecular perovskite energetic material. The high-symmetry perovskite configuration assembles the oxidant ClO4− and fuel H2dabco2+ into a compact cubic crystal, realizing a high energy-releasing efficiency. In this study, the thermal decomposition of DAP has been investigated by thermogravimetric analysis (TG) and differential scanning calorimetry (DSC) coupled with Fourier transform infrared (FTIR) spectroscopy and mass spectroscopy (MS). The TG-DSC profiles show that DAP has an intense one-stage heat release process with a weight loss of 94.7%. The evolved gas products are identified as H2O, CO2, CO, HCl, HCN, NH3, HNCO by FTIR spectrum, in which the infrared characteristic peak at 2283 and 2250 cm−1 is clarified not from N2O and assigned to HNCO. The principal products are H2O and CO2 together with significant amounts of HCl, HCN, NH3 in MS, while few nitrogen oxides and O2 are detected. The experimental results show that organic components have been the prominent media for the degradation of ClO4−. To refine the mechanism observed in experiment, ab initio molecular dynamics simulations are carried out to reveal the atomistic reaction mechanisms. The decomposition of DAP starts with proton transfer from NH4+ and H2dabco2+ to ClO4−. The deprotonated carbon skeleton is preferable to NH3 in capturing O atoms, realizing a faster consumption of O atoms. Amounts of H atoms enter the environment being active free radicals, realizing an efficient autocatalytic chain propagation of degradation of ClO4−. The atomistic thermal decomposition reaction mechanism of DAP uncovers the role of organic components in promoting the degradation of ClO4−, which will help improve the synthesis strategy of molecular perovskite energetic materials with improved performance.
1. Introduction
Ammonium perchlorate (AP), as a powerful oxidant, can produce a self-sustaining deflagration reaction when mixed with fuel, and is the most commonly used energetic component of solid composite propellants.1 The deflagration performance of a propellant is directly related to the complex thermal decomposition mechanism of AP. People have been committed to enhancing the combustion rate by reducing the high-temperature decomposition (HTD) temperature and increasing the apparent heat release of AP.1–3 One of the most commonly used methods is nano-additives, whose catalytic activity can effectively reduce the HTD temperature of AP. The two-stage thermal decomposition reaction of AP can be merged into one-stage one with appropriate amount of addition, so the heat release of AP is more concentrated. Among various nano-additives, carbon materials such as carbon nanotubes and graphene that can combust exothermically like a fuel with oxidizing gas products generated from the thermal decomposition of AP, realize a much higher apparent heat release (>3000 J g−1).2,3 As the amount of addition is further increased, the thermal decomposition temperature can be further reduced, but the heat release is also reduced, indicating that the main heat source is still from AP. Therefore, although the combustion heat of carbon materials contributes to the higher heat release, the additional oxygen-consuming reaction, which greatly promote the thermal decomposition of AP, should be the main reason.Another method is crystal engineering, which assembles AP molecules with appropriate ligand molecules at the molecular level to obtain the desired improvement. Cocrystal is a new crystal formed by combining two or more known neutral molecules at a certain stoichiometric ratio through non-bonding interaction.4 Three cocrystals of AP and crown ethers – AP/18-crown-6, AP/benzo-18-crown-6 and AP/dibenzo-18-crown-6, have been synthesized.5 The last two cocrystals have a single obvious exothermic process at a lower temperature, with heat release increased to 1304.2 J g−1 and 1488.4 J g−1. Looking into the spatial configuration, the large and stretched ring skeletons of crown ethers are packed disorderly and thus the space of crystal is filled with many free volumes. Consequently, the crystal density is decreased far below that of AP and so is the corresponding energy density. Therefore, although the heat release of the cocrystal is increased relative to AP, which can be attributed to the catalytic effect of organic component and its exothermic combustion, the low crystal density limits the heat release to a low level.
Different from the direct “mixing” of cocrystal, molecular perovskites assemble molecules by introducing organic molecular unit into the perovskite architecture.6 (H2dabco)[NH4(ClO4)3] (DAP, dabco = 1,4-diazabicyclo[2.2.2]octane) introduces organic cation H2dabco2+ as A component, with NH4+ cation as B component and ClO4− anion as X component, to assemble a high symmetry ternary perovskite ABX3 structure,7,8 which realize a homogeneous mixing of fuel and oxidant at the molecular level.9 The organic component H2dabco2+ cation also has a ring skeleton but small and compact. And the electrostatic interaction between cation and anion is stronger than neutral molecules. Thus, the compact cubic crystal has a density close to AP, far above that of cocrystal. Furthermore, DAP is easier to be modified by replacing A, B or X component.10,11 Compared with AP, DAP has a lower thermal decomposition temperature and a single intense exothermic process, and its heat release has reached the level of nano-additives of carbon materials (>3000J g−1).12,13 These lay a good foundation for the further modification and application of DAP.14,15
The catalytic performance of nano-additives depends on the effective contact area and the number of active sites with AP. Simply mixing their nanoparticles or making them porous nanocomposites, in essence, is physically mixed and subject to the strength of interaction and the uniformity of dispersion. The cocrystals of AP and crown ethers suffer from low crystal density, so more types of cocrystal need to be synthesized with more suitable ligand molecules. DAP seemingly integrate the advantages of all above methods. More importantly, it is evident that the organic components play a key role in the thermal decomposition of AP, which need to be further revealed by studying the thermal decomposition mechanism of DAP.
The structure changes of DAP have been studied by in situ FTIR in heating process.13 The cage skeleton constructed by NH4+ and ClO4− ions decomposes before the organic moiety and determines the decomposition process. The combustion flames photographed with high speed photography and the gas release process recorded by TG-FTIR show a fierce one-stage energy-releasing effect of DAP.12 However, the chemical reactions during the decomposition process of DAP still remain unclear. The infrared characteristic peaks of gas products in the FTIR spectra show significant changes compared with AP.12 But the gas composition has not been identified, nor has the reason been given for these changes. To examine the thermal decomposition reaction process of DAP, thermogravimetric analysis and differential scanning calorimetry coupled with Fourier transform infrared spectroscopy and mass spectroscopy (TG-DSC-FTIR-MS) experiments and ab initio molecular dynamics simulations are carried out to identify the evolved gas products. The concentration–time profile of gas products gives clues about the elementary reactions,16 while the ab initio molecular dynamics simulations trace the breaking and formation of bond on atomic scale.17–19 Theoretical calculations can well make up for the insufficiency of macroscopic experiments on the exploration of microscopic mechanism, while the corresponding results of macroscopic experiments verify the reliability of theoretical calculations.
2. Experimental and computational details
2.1 Experiments
2.2 Ab initio calculations
The lattice parameters of DAP (CCDC No. 1528108) determined by Chen et al.9 are used to construct the crystal model. The spatial configuration and molecular composition of DAP crystal are shown in Fig. 1. DAP molecule is composed of five elements – C, H, O, N, and Cl. They are described by first-principles pseudopotentials constructed by projection augmented waves.26,27 C 2s2p, H 1 s, N 2s2p, O 2s2p, Cl 3s3p are considered as valence state. The exchange correlation functional adopts the generalized gradient estimation (GGA) in the form of Perdew, Burke, and Ernzerhof formulation (PBE).28 The cutoff energy of the plane wave basis set is set to 600 eV. Grimme's DFT-D2 (ref. 29) method is used to correct long-range dispersion interaction. Considering that the DAP unit cell contains 336 atoms, which is bigger than the supercell of common energetic material crystals used for ab initio molecular dynamics simulations,30 the DAP unit cell is large enough to be used as the crystal model for ab initio molecular dynamics simulations with single Gamma point. In order to verify the applicability of the single Gamma point calculation to the DAP unit cell, the conjugate gradient method was used to perform complete structural relaxation (lattice and atom relaxed at the same time). The electronic iteration and ion relaxation convergence criteria are set to 1 × 10⁻⁷ and 1 × 10⁻⁶ eV. The optimized lattice parameters are in good agreement with the experimental values (see Table 1), which proves the reliability of the DAP calculation. Furthermore, the consistency of gas products obtained by experiment and calculation also verify the reliability of the calculation method. The Verlet algorithm is used for molecular dynamics integration with a time-step of 0.25 fs. The Nose–Hoover thermostat is used to realize a canonical ensemble (NVT). The optimized DAP unit cell is firstly relaxed at 300 K for 0.5 ps to eliminate the unreasonable internal stress. After that, the temperature is rapidly increased to 3000 K within 0.25 ps and the relaxed DAP unit cell is maintained at the temperature for 9 ps to be fully decomposed. In order to trace the evolution of product clusters, the cluster analysis method proposed by Lu et al.30 is used. If the distance between two atoms is less than 1.33 times the normal covalent bond length31 and maintained for 25 fs (with hydrogen atoms bonded) or 50 fs (without hydrogen atoms bonded),32 the two atoms are considered bonded. | ||
| Fig. 1 Spatial configuration (a) and molecular composition (b) of DAP. C, H, N, O, Cl are represented by gray, wight, blue, red, and greenyellow balls respectively. For clarity, only one ClO4− is shown with O atoms and one H2dabco2+ and NH4+ are shown with H atoms. | ||
For comparison, the decomposition of AP is also simulated. The lattice parameters of AP (CCDC No. 725655) determined by Kumar et al.33 are used to construct the crystal model. Since the AP unit cell contains only 40 atoms, a 2 × 1 × 1 supercell constructed from the optimized unit cell is used for the sing le Gamma point ab initio molecular dynamics simulation, while all other parameter settings are consistent with that of DAP.
3. Results and discussion
3.1 Experimental results
PXRD are often used for structural analysis. Pure substances have unique spatial configurations and crystal plane arrangements, which are depicted by certain diffraction peaks in PXRD figures like fingerprints. Fig. 2 shows the PXRD peaks of the prepared DAP samples and the DAP crystal model. The distribution of diffraction peaks of samples is consistent with that of crystal model, indicating that DAP has been successfully synthesized. The TG-DSC curves in Fig. 3 depicts the weight loss and energy release characteristics of DAP in the thermal decomposition process. The mass change of DAP samples starts at 292.7 °C and end at 402.6 °C with a weight loss of 94.7%. The weight loss curve has only one steep downward stage and so there is a single sharp exothermic peak on the DSC curve. The exothermic peak temperature is 381.8 °C. The thermal decomposition of DAP shows a rapid and concentrated one-stage heat release process different from that of AP.34–36 | ||
| Fig. 2 PXRD of crystal model and prepared samples for DAP (red line for crystal model, black line for prepared samples). | ||
 | ||
| Fig. 3 Weight loss and heat release for DAP decomposed at the heating rate of 10 °C min−1 (black line for TG, red line for DSC). | ||
The infrared characteristic peaks in the FTIR spectrum correspond to certain characteristic vibrations of gas molecules which are fingerprints to identify the chemical species of gas products. By comparing the infrared characteristic peaks of gas products of DAP at 381.8 °C (Fig. S1(b)†) with the standard gas infrared data provided in HITRAN2016 molecular spectroscopic database (Fig. S1(a)†),37 the gas components can be clearly identified to include CO2, CO, H2O, HCl, HCN, NH3. It should be noted that high temperature will broaden the infrared characteristic peaks of some gases, but the central locations are almost unchanged (Fig. S2†). Since the temperature of FTIR gas cell is only maintained at 210 °C, for the infrared characteristic peaks not overlapped, the temperature-induced uncertainty can be ignored. More difficult is the identification of HNCO and N2O, which are the key to understanding the thermal decomposition mechanism of DAP. N2O is a symbolic gas product for AP and has the strongest infrared characteristic peak at 2239 and 2204 cm−1 (Fig. S3†). For DAP, the infrared characteristic peak at 2283 and 2250 cm−1 (Fig. S1(b)†) is also the strongest and has a similar profile with that of N2O. Considering that DAP contains the same component with AP, it is easy to jump to conclusions and identify it as N2O. However, the latter has an obvious shift to high wavenumber region, which is more consistent with that of HNCO. At the same time, the second characteristic peak of N2O at 1303 and 1269 cm−1 is absent, while that of HNCO appears at 3525 cm−1. Furthermore, the infrared characteristic peaks of CO2 and HNCO are partially overlapped in the range of 2200–2400 cm−1, which is consistent with the FTIR spectrum in.16,38,39 The infrared characteristic peaks of CO2 and N2O are clearly not overlapped even under high temperature (Fig. S4†), which is consistent with the FTIR spectrum in.16,39 Therefore, the infrared characteristic peak at 2283 and 2250 cm−1 is assigned to HNCO. The gas products in the thermal decomposition process of DAP include CO2, CO, H2O, HCl, HCN, NH3, HNCO (Fig. 4).
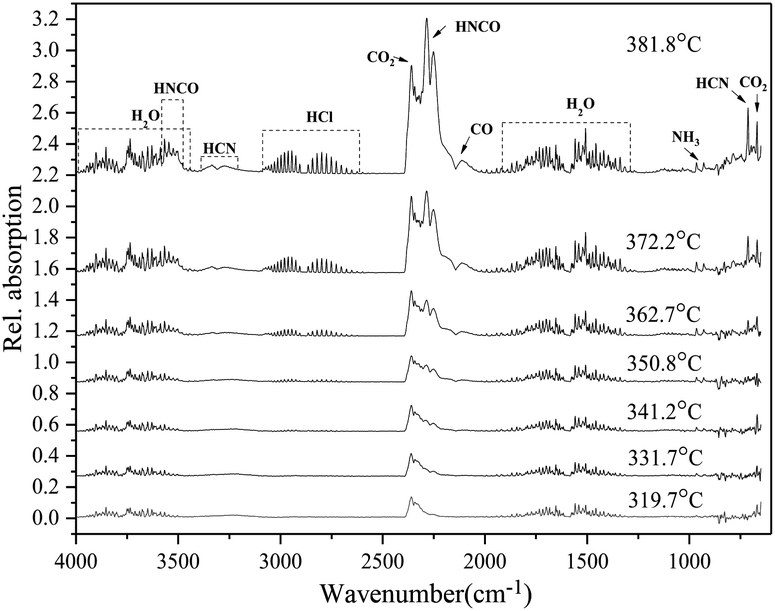 | ||
| Fig. 4 Evolution of gas products from FTIR spectrum for DAP decomposed at the heating rate of 10 °C min−1. | ||
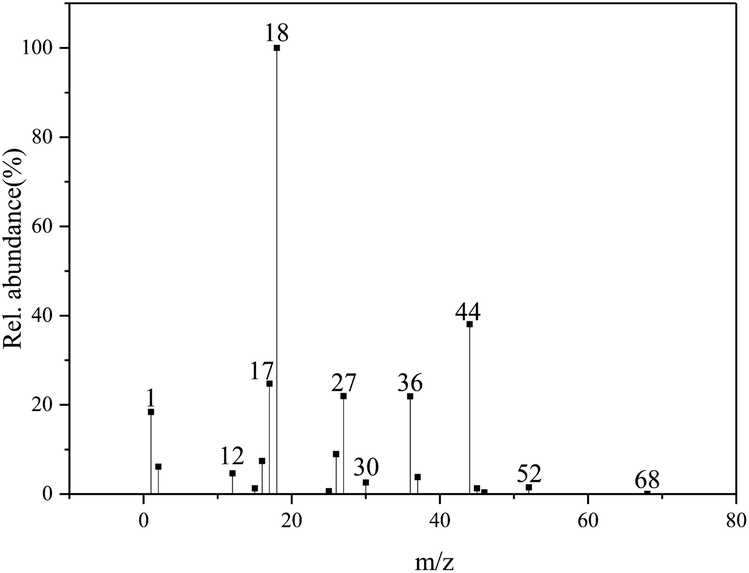
The concentration–time profiles obtained from mass spectrum show the evolution of product fragments. In Fig. 5, the product fragments all concentrate at 381.8 °C, indicating a fierce thermal decomposition of DAP. It should be noted that the relative abundance of O2 (m/z = 32) shows a negative increase at 381.8 °C. O2 is a common gas product in the thermal decomposition process of AP.40 The rupture of Cl–O bond will produce many oxygen free radicals like O, O2 and O3. Their strong oxidation activity can oxidize NH3 into various nitrogen oxides, which is a representation of oxidizing ability of AP. The negative increase of O2 here indicates that there is no O2 newly generated, but the O2 from background gases is consumed by certain gas products. Considering that there is no fragments peak of CO (m/z = 28) in the mass spectrum, but the infrared characteristic peaks of CO do appear in the FTIR spectrum, it can be speculated that CO has been oxidized by O2 in mass spectrometer. On the other hand, the absence of O2 indicates that there may be few higher-order oxygen radicals generated in the thermal decomposition process of DAP. The single O radicals generated first from the rupture of Cl–O bond are quickly consumed, so there is no enough time for them to gather to higher-order oxygen radicals.
 | ||
| Fig. 5 Evolution of product fragments from MS for DAP decomposed at the heating rate of 10 °C min−1. | ||
The chemical species of product fragments at 381.8 °C are deduced from the mass-to-charge ratio (Table 2). Combined with FTIR spectrum, CO2, H2O, HCl, HCN, NH3 are confirmed to sole principal species, but there are no mass-to-charge ratios correspond to CO and HNCO. The absence of CO has been explained above. One possible reason for the absence of HNCO is that HNCO has been ionized to H2NCO+ (m/z = 44) by adding H+, who will be covered by the fragments peak of CO2, since there are many fragments of H+ in the mass spectrometer. In the molecular dynamics simulation, HNCO eventually exists in the form of HNCO ![[left over right harpoons]](https://www.rsc.org/images/entities/char_21cb.gif) H2NCO, indicating that it is easy for HNCO to capture another H. But high-precision mass spectrometry experiments are needed to confirm this. The relative abundance of primary product fragments is shown in Fig. 6. H2O has the largest abundance more than twice the second largest one of CO2, indicating a large amount of O atoms decomposed from ClO4− have been captured by H atoms. In the decomposition of AP, H2O is also aprincipal product.40 The decomposition of AP starts with the proton transfer from NH4+ to ClO4− and HClO4 is degraded from high-order oxychloride or oxyacid to low-order ones, in which H atoms play an important role in the autocatalytic chain propagation.41 Since the cage skeleton constructed by NH4+ and ClO4− ions determines the decomposition process of DAP,13 it can be speculated that the decomposition also start with the proton transfer from NH4+ to ClO4−. The presence of HClO and HClO2 indicates that the degradation of HClO4 is also an autocatalytic chain propagation from high-order oxychloride or oxyacid to low-order ones. More abundant H2O origins from the organic components and higher proportion of ClO4−. N2O has been identified not included in the gas products by FTIR spectrum. Although there are fragments peaks with m/z = 30 and 46, which possibly belong to NO and NO2 respectively, their abundance is too small. Therefore, nitrogen oxides, which are the main oxygen-consuming products in the decomposition of AP,34,35 have been replaced by carbon oxides. NH3, HCN and HCl have close and significant relative abundance. NH3 comes from the deprotonated NH4+. HCl is a symbolic product for the degradation of ClO4−. And HCN comes from the polyazine unit in the carbon-nitrogen heterocycle of H2dabco2+, which is a common decomposition product of carbon-nitrogen heterocyclic molecules like RDX, HMX and CL-20.16,42 HNCO often accompanies with HCN, which is derived from the amide unit after the carbon skeleton is oxidized by O atoms. Another important gas product generated from the decomposition of carbon-nitrogen heterocycle is CH2O. But it cannot be identified in the FTIR spectrum. The relative abundance of fragments with m/z = 30 is also much smaller than that of CO2. This indicates that H2dabco2+ may lose H atoms first before the ring skeleton breaks or is oxidized by O atoms. So H2dabco2+ is more stable than its precursor of dabco under the confinement of cage skeleton.
H2NCO, indicating that it is easy for HNCO to capture another H. But high-precision mass spectrometry experiments are needed to confirm this. The relative abundance of primary product fragments is shown in Fig. 6. H2O has the largest abundance more than twice the second largest one of CO2, indicating a large amount of O atoms decomposed from ClO4− have been captured by H atoms. In the decomposition of AP, H2O is also aprincipal product.40 The decomposition of AP starts with the proton transfer from NH4+ to ClO4− and HClO4 is degraded from high-order oxychloride or oxyacid to low-order ones, in which H atoms play an important role in the autocatalytic chain propagation.41 Since the cage skeleton constructed by NH4+ and ClO4− ions determines the decomposition process of DAP,13 it can be speculated that the decomposition also start with the proton transfer from NH4+ to ClO4−. The presence of HClO and HClO2 indicates that the degradation of HClO4 is also an autocatalytic chain propagation from high-order oxychloride or oxyacid to low-order ones. More abundant H2O origins from the organic components and higher proportion of ClO4−. N2O has been identified not included in the gas products by FTIR spectrum. Although there are fragments peaks with m/z = 30 and 46, which possibly belong to NO and NO2 respectively, their abundance is too small. Therefore, nitrogen oxides, which are the main oxygen-consuming products in the decomposition of AP,34,35 have been replaced by carbon oxides. NH3, HCN and HCl have close and significant relative abundance. NH3 comes from the deprotonated NH4+. HCl is a symbolic product for the degradation of ClO4−. And HCN comes from the polyazine unit in the carbon-nitrogen heterocycle of H2dabco2+, which is a common decomposition product of carbon-nitrogen heterocyclic molecules like RDX, HMX and CL-20.16,42 HNCO often accompanies with HCN, which is derived from the amide unit after the carbon skeleton is oxidized by O atoms. Another important gas product generated from the decomposition of carbon-nitrogen heterocycle is CH2O. But it cannot be identified in the FTIR spectrum. The relative abundance of fragments with m/z = 30 is also much smaller than that of CO2. This indicates that H2dabco2+ may lose H atoms first before the ring skeleton breaks or is oxidized by O atoms. So H2dabco2+ is more stable than its precursor of dabco under the confinement of cage skeleton.
| m/z | Ion current/×10−10 A | Species | m/z | Ion current/×10−10 A | Species |
|---|---|---|---|---|---|
| 1 | 1.011 | H | 30 | 0.143 | NO, CH2O |
| 2 | 0.337 | H2 | 36 | 1.202 | HCl |
| 12 | 0.256 | C | 37 | 0.210 | 37Cl |
| 15 | 0.070 | NH, CH3 | 44 | 2.091 | CO2, N2O |
| 16 | 0.408 | O, NH2, CH4 | 45 | 0.07 | HCO2, HN2O |
| 17 | 1.359 | OH, NH3 | 46 | 0.021 | NO2 |
| 18 | 5.493 | H2O, NH4 | 52 | 0.083 | HClO |
| 25 | 0.036 | C2H | 68 | 0.003 | HClO2 |
| 26 | 0.492 | CN | |||
| 27 | 1.206 | HCN |
 | ||
| Fig. 6 Fragments of gas products from MS for DAP decomposed at 381.8 °C. | ||
In the thermal decomposition process of ClO4−, the highly reactive transient radicals ClOx (x = 1–3) can only survive for a very short time and few of them can escape in the form of gas. Therefore, they can hardly be detected by FTIR and quadrupole electron impact MS (the MS used in the paper).
In the paper,36 the author summarized the detection results of various FTIR and MS methods on the thermal decomposition products of AP. Only the state-of-the-art single vacuum ultraviolet (VUV) photoionization coupled with reflectron time-of-flight mass spectrometry (PI-ReTOF-MS) can detect all ClOx (x = 1–3) radicals, though the intensity of signal is much weaker than that of primary gas products. The FTIR and quadrupole electron impact MS can hardly detect the ClOx (x = 1–3) radicals.
In the following simulations, the reason why ClOx (x = 1–3) seem to have good half-lives is that they are transformed continuously from ClO4−. When ClO4− is degraded completely, ClOx (x = 1–3) disappear almost at the same time. Therefore, a single ClOx can only survive for a very short time. Only HClO exists for a certain time after all ClOx (x = 1–4) and HClOx (x = 2–4) disappear, so it has a relatively good half-life. This is why for the only two HClOx detected by MS, the intensity of signal of HClO is much stronger than that of HClO2, but is still much weaker than that of primary gas products. This is consistent with detection results of AP, in which only HClO can be detected even with PI-ReTOF-MS.
3.2 Ab initio calculation results
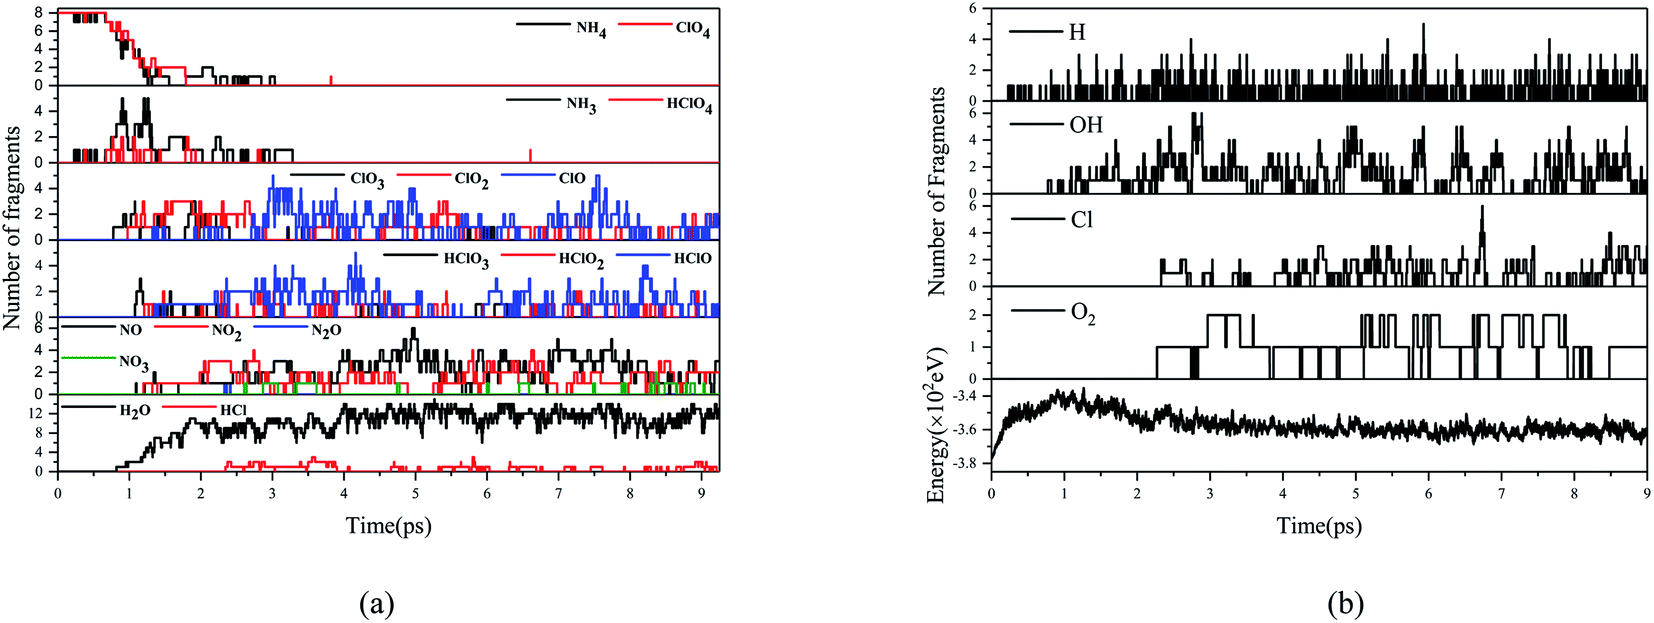
Fig. 7 and 8 show the evolution of prominent atomic clusters and potential energy respectively for DAP and AP decomposed at 3000 K. The chemical species for AP include NH3, HClOx (x = 1,2,3,4), ClOx (x = 1,2,3), NOx (x = 1,2,3), N2O, H2O, HCl, while for DAP including NH3, hdabco, dabco, HClOx (x = 1,2,3,4), ClOx (x = 1,2,3), NOx (x = 1,2), HCN, HNCO, H2O, HCl, COx (x = 1,2). The products composition and content are consistent with the thermal decomposition experiments of AP and DAP, which verifies the reliability of ab initio molecular dynamics simulations. The presence of CO and HNCO verifies the experimental inference. When the temperature is heated to 3000 K, DAP decomposes quickly, while AP does not until 0.662 ps. AP has been heated to its HTD reaction, whose onset temperature is higher than that of DAP. The first appearance of NH3 and HClO4 indicates that the thermal decomposition of AP and DAP both begin with the proton transfer from NH4+ to ClO4−. For DAP, the cage skeleton collapses soon after the proton transfer and loses its confinement on h2dabco2+. h2dabco2+ is deprotonated to Hdabco+ and dabco almost simultaneously with the proton transfer, so H2dabco2+ is also an important proton donor. It is worth mentioning that H2dabco2+ seemingly prefers to lose the C-terminal H atoms instead of N-terminal H atoms, since there are more HNCO than HCN in the products. In fact, it's easy for H atoms to escape short-lived from X–H bond under thermal stimulation due to its minor mass. When losing H atoms, the exposed C atoms are easier to be oxidized by O atoms than N atoms, which produces –CO– groups instead of –NO– groups on the ring skeleton. Therefore, the C atoms have superiority over N atoms in the competition for O atoms. Although the decomposition starts from between NH4+ and ClO4−, only few nitrogen oxides generated and a significant amount of NH3 exit till the end of reaction, which is opposite to that of AP. The degradation of HClO4, which gradually changes from higher-order oxychloride or oxyacid to low-order ones, is a process of losing O atoms. When the cage skeleton collapsed, H2dabco2+ loses H atoms first. Part of H atoms transfer to ClO4−, while most of them enter the environment. The H atoms in the environment is maintained at a high level, which realize a more efficient autocatalytic chain propagation process, that is, a faster consumption of O atoms. This can be verified by the evolution of oxygen radicals. There are mainly single O radicals for DAP but O2 radicals for AP in the environment, indicating that the O atoms are consumed much faster in the thermal decomposition process of DAP, so there is no enough time for them to gather to form higher-order oxygen radicals. The first appearance of H2O means that O atoms are first captured by H atoms. The number of OH radicals rise rapidly until the appearance of Cl atoms, which will be captured by H atoms to produce HCl. From the perspective of energy release, the inflection point of potential energy of AP lags behind and there is a second-stage energy release process when Cl atoms appear. On the one hand, NH3 is relatively inert and it requires more energy to break N–H bond; on the other hand, breaking the last Cl–O bond to produce Cl atoms also requires more energy. However, it is much easier for C–H bond to break in DAP, and the rapid oxygen-consuming process accumulates enough heat to make the last Cl–O bond break earlier. Therefore, the appearance of Cl atoms is almost at the inflection point and the potential energy release is more concentrated and smoothed. The main energy release of DAP is finished when oxychloride or oxyacid are degraded completely (approach 3 ps), but the energy release of AP is insufficient due to the incomplete degradation of HClO4. | ||
| Fig. 7 Evolution of key chemical species (a), free radicals and potential energy (b) for DAP decomposed at 3000 K. | ||
 | ||
| Fig. 8 Evolution of key chemical species (a), free radicals and potential energy (b) for AP decomposed at 3000 K. | ||
4. Conclusions
In summary, the thermal decomposition of DAP starts with proton transfer from NH4+ and H2dabco2+ to ClO4−, however, the degradation pathway of ClO4− has been changed by organic components compared with that of AP. Firstly, the deprotonated carbon skeleton is preferable to NH3 in capturing O atoms, which realizes a faster consumption of O atoms. Secondly, amounts of H atoms released from H2dabco2+ enter the environment being active free radicals, realizing an efficient autocatalytic chain propagation of degradation of ClO4−. Therefore, the generation of gas products is fast and concentrated, and so is the energy release. Molecular perovskites have provided a novel assembly strategy for energetic molecules that can achieve high energy release.Conflicts of interest
There are no conflicts of interest to declare.Notes and references
- Q. L. Yan, F. Q. Zhao, K. K. Kuo, X. H. Zhang, S. Zeman and L. T. DeLuca, Catalytic effects of nano additives on decomposition and combustion of RDX-, HMX-, and AP-based energetic compositions, Elsevier Ltd, 2016, vol. 57 Search PubMed.
- J. Chen, S. He, B. Huang, L. Zhang, Z. Qiao, J. Wang, G. Yang, H. Huang and Q. Hao, Appl. Surf. Sci., 2018, 457, 508–515 CrossRef CAS.
- W. Zhang, Q. Luo, X. Duan, Y. Zhou and C. Pei, Mater. Res. Bull., 2014, 50, 73–78 CrossRef CAS.
- R. A. Wiscons and A. J. Matzger, Cryst. Growth Des., 2017, 17, 901–906 CrossRef CAS.
- M. Cheng, X. Liu, Q. Luo, X. Duan and C. Pei, CrystEngComm, 2016, 18, 8487–8496 RSC.
- G. Kieslich and A. L. Goodwin, Mater. Horiz., 2017, 4, 362–366 RSC.
- L. Cao, X. Liu, Y. Li, X. Li, L. Du, S. Chen, S. Zhao and C. Wang, Front. Phys., 2021, 16, 33201 CrossRef.
- N. Mercier, S. Poiroux, A. Riou and P. Batail, Inorg. Chem., 2004, 43, 8361–8366 CrossRef CAS PubMed.
- S. L. Chen, Z. R. Yang, B. J. Wang, Y. Shang, L. Y. Sun, C. T. He, H. L. Zhou, W. X. Zhang and X. M. Chen, Sci. China Mater., 2018, 61, 1123–1128 CrossRef CAS.
- Y. Shang, Z.-H. Yu, R.-K. Huang, S.-L. Chen, D.-X. Liu, X.-X. Chen, W.-X. Zhang and X.-M. Chen, Engineering, 2020, 6, 1013–1018 CrossRef CAS.
- Y. Shang, R. Huang, S. Chen, C. He, Z. Yu, Z. Ye, W. Zhang and X.-M. Chen, Cryst. Growth Des., 2020, 20, 1891–1897 CrossRef CAS.
- P. Deng, H. Wang, X. Yang, H. Ren and Q. Jiao, J. Alloys Compd., 2020, 827, 154257 CrossRef CAS.
- J. Zhou, L. Ding, F. Zhao, B. Wang and J. Zhang, Chin. Chem. Lett., 2019, 31, 554–558 CrossRef.
- K. Han, X. Zhang, P. Deng, Q. Jiao and E. Chu, Vacuum, 2020, 180, 109572 CrossRef CAS.
- Q. Jia, X. Bai, S. Zhu, X. Cao, P. Deng and L. Hu, J. Energ. Mater., 2020, 38, 377–385 CrossRef CAS.
- T. B. Brill, Combust. Flame, 1985, 62, 213–224 CrossRef.
- Q. An, W. G. Liu, W. A. Goddard, T. Cheng, S. V. Zybin and H. Xiao, J. Phys. Chem. C, 2014, 118, 27175–27181 CrossRef CAS.
- Z. Lu, Y. Xiong, X. Xue and C. Zhang, J. Phys. Chem. C, 2017, 121, 27874–27885 CrossRef CAS.
- L. Meng, Z. Lu, X. Wei, X. Xue, Y. Ma, Q. Zeng, G. Fan, F. Nie and C. Zhang, CrystEngComm, 2016, 18, 2258–2267 RSC.
- P. Zhai, C. Shi, S. Zhao, Z. Mei and Y. Pan, RSC Adv., 2019, 9, 19390–19396 RSC.
- M. Wu, Y. Chen, H. Lin, L. Zhao, L. Shen, R. Li, Y. Xu, H. Hong and Y. He, Water Res., 2020, 181, 115932 CrossRef CAS PubMed.
- Y. Long, G. Yu, L. Dong, Y. Xu, H. Lin, Y. Deng, X. You, L. Yang and B. Q. Liao, Water Res., 2021, 189, 116665 CrossRef CAS PubMed.
- Y. Xu, Y. Xiao, W. Zhang, H. Lin, L. Shen, R. Li, Y. Jiao and B. Q. Liao, J. Membr. Sci., 2021, 618, 118726 CrossRef CAS.
- R. Li, J. Li, L. Rao, H. Lin, L. Shen, Y. Xu, J. Chen and B. Q. Liao, J. Membr. Sci., 2021, 619, 118790 CrossRef CAS.
- Y. Liu, L. Shen, H. Lin, W. Yu, Y. Xu, R. Li, T. Sun and Y. He, J. Membr. Sci., 2020, 612, 118378 CrossRef CAS.
- P. E. Blöchl, Phys. Rev. B: Condens. Matter Mater. Phys., 1994, 50, 17953–17979 CrossRef PubMed.
- D. Joubert, Phys. Rev. B: Condens. Matter Mater. Phys., 1999, 59, 1758–1775 CrossRef.
- J. P. Perdew, K. Burke and M. Ernzerhof, Phys. Rev. Lett., 1996, 77, 3865–3868 CrossRef CAS PubMed.
- A. Allouche, J. Comput. Chem., 2012, 32, 174–182 CrossRef PubMed.
- Z. Lu, Y. Xiong, X. Xue and C. Zhang, J. Phys. Chem. C, 2017, 121, 27874–27885 CrossRef CAS.
- P. Pyykkö and M. Atsumi, Chem.–Eur. J., 2009, 15, 186–197 CrossRef PubMed.
- M. R. Manaa, E. J. Reed, L. E. Fried and N. Goldman, J. Am. Chem. Soc., 2009, 131, 5483–5487 CrossRef CAS PubMed.
- D. Kumar, I. P. S. Kapoor, G. Singh and R. Fröhlich, Int. J. Energ. Mater. Chem. Propul., 2010, 9, 549–560 Search PubMed.
- L. Mallick, S. Kumar and A. Chowdhury, Thermochim. Acta, 2015, 610, 57–68 CrossRef CAS.
- L. Mallick, S. Kumar and A. Chowdhury, Thermochim. Acta, 2017, 653, 83–96 CrossRef CAS.
- S. Góbi, L. Zhao, B. Xu, U. Ablikim, M. Ahmed and R. I. Kaiser, Chem. Phys. Lett., 2018, 691, 250–257 CrossRef.
- I. E. Gordon, L. S. Rothman and C. Hill, et al., J. Quant. Spectrosc. Radiat. Transfer, 2017, 203, 3–69 CrossRef CAS.
- M. S. Lowenthal, R. K. Khanna and M. H. Moore, Spectrochim. Acta, Part A, 2002, 58, 73–78 CrossRef CAS.
- Y. Oyurni, B. Brill and L. Rheingold, J. Phys. Chem., 1985, 2309–2315 Search PubMed.
- V. R. P. Verneker and J. N. Maycock, J. Chem. Phys., 1967, 47, 3618–3621 CrossRef CAS.
- V. V. Boldyrev, Thermochim. Acta, 2006, 443, 1–36 CrossRef CAS.
- D. G. Patil and T. B. Brill, Combust. Flame, 1993, 92, 456–458 CrossRef CAS.
Footnote |
| † Electronic supplementary information (ESI) available. See DOI: 10.1039/d0ra10559g |
| This journal is © The Royal Society of Chemistry 2021 |