DOI:
10.1039/D1RA00955A
(Paper)
RSC Adv., 2021,
11, 12058-12065
A 1D binary photonic crystal sensor for detecting fat concentrations in commercial milk
Received
4th February 2021
, Accepted 15th March 2021
First published on 24th March 2021
Abstract
Our goal in this study is to design an efficient sensor to detect the fat volume in commercial milk. We used a one-dimensional binary photonic crystal to design the sensor and the Transfer Matrix Method to study theoretically its optical response as the refractive index of milk samples changes due to the change in fat concentration. We found that the proposed sensor is efficient in sensing the fat concentration in milk. The optimum defect layer thickness is found to be 1.20 μm and the sensitivity of the sensor improved as the angle of incidence of radiation increased up to 60°. Besides, we proposed an empirical formula that can be used to estimate the fat concentration in milk. The efficiency of our sensor is based on the quick response of the sensor to the changes in the fat concentration in milk. The output signal of the sensor would be processed in a signal processing unit that will give an accurate estimation of the fat concentration in milk. The sensor is easy to fabricate, cost-effective, and user-friendly.
Introduction
Milk and dairy-related products are the most common components of many food products, hence, controlling their qualities is a vital matter. Researchers have been working on detecting and quantifying the adulterants in milk such as added water, whey, formalin, starch, sodium citrate, formaldehyde and sucrose, indigenous vegetable oils, etc.1–7 The refractive index of milk is dependent on the concentrations of its constituents. As an example, the refractive index of milk changes upon changing fat concentration.8–11 Thus, knowing the refractive index of milk helps in determining the fat concentration.
Estimating the refractive index of a liquid is traditionally based on the use of a commercial Abbe refractometer. This experimental method relies on the detection of the critical angle of total reflection in a liquid-prism interface and will be a more accurate and reliable method for transparent liquids. Due to the inaccuracy in detecting the critical angle, it is not possible to use the Abbe refractometer for determining the refractive index of absorbing and turbid liquids.12,13 Other refractometer systems have been developed to assess the refractive index of absorbing and turbid liquids such as milk.14–18 However, the accuracy of these systems is dependent on some conditions such as the polarization of incident light and the oscillation of the reflectance which depends on the size of solids in liquids.
The current methods and systems used in the food industries for quality control are very time-consuming and highly expensive. Recently, researchers have been exploring a new field of research of optical sensing; like refractive-index sensor,9 biosensor,19 chemical and biochemical sensors,20 etc. In recent years, optical sensors based on the photonic crystals (PCs) structures have been developed by researchers to meet the needs of certain applications in biomedicine,19 environmental bio-sensing,21–23 optoelectronics24 and optical communication.25 Several successful attempts have been carried out to fabricate the photonic crystals using different experimental setups to suit certain applications.26–28 The main attractive optical feature of the PC is the photonic bandgap (PBG) where the incident light of a certain wavelength range is hindered from transmitting through the PC.29,30 The spectral width of the PBG depends on some structural parameters of the PC such as the thicknesses and spatial refractive indices of the PC constituents.31–33 For sensing applications, however, the structure of the PC has to be modified as the wide PBG is not suitable for sensing purposes. Introducing a defect layer in the PC structure will produce a resonant optical mode in the transmittance spectrum of the PC.34,35 The incident radiation having the resonant wavelength within the PBG can propagate through the PC. The resonant wavelength is sensitive to any minute change in the refractive index of the defect layer, as such this property makes the defected PC a suitable device for sensing use.9,36 One, two and three dimensional PC structures have been proposed34,37 and the transmittance spectrum has been theoretically simulated using different simulation techniques.38–41 Since the PC structure consists of a finite number of alternating layers, the transfer matric method (TMM) is widely used in calculating numerically the transmittance spectrum of the PC.31,33,42
In this work, a 1D defective photonic crystal sensor structure is proposed to detect the fat volume concentrations in commercial milk. An empirical relation is developed to estimate the fat volume concentrations in commercial milk as a function of the refractive index. Hence, the proposed sensor can be efficiently used in quality control in the food-processing industry. The proposed design is very simple and easy to fabricate as it comprises only one single defective PC. Furthermore, it has a fast response with a high sensitivity and quality factor.
Proposed design and theory
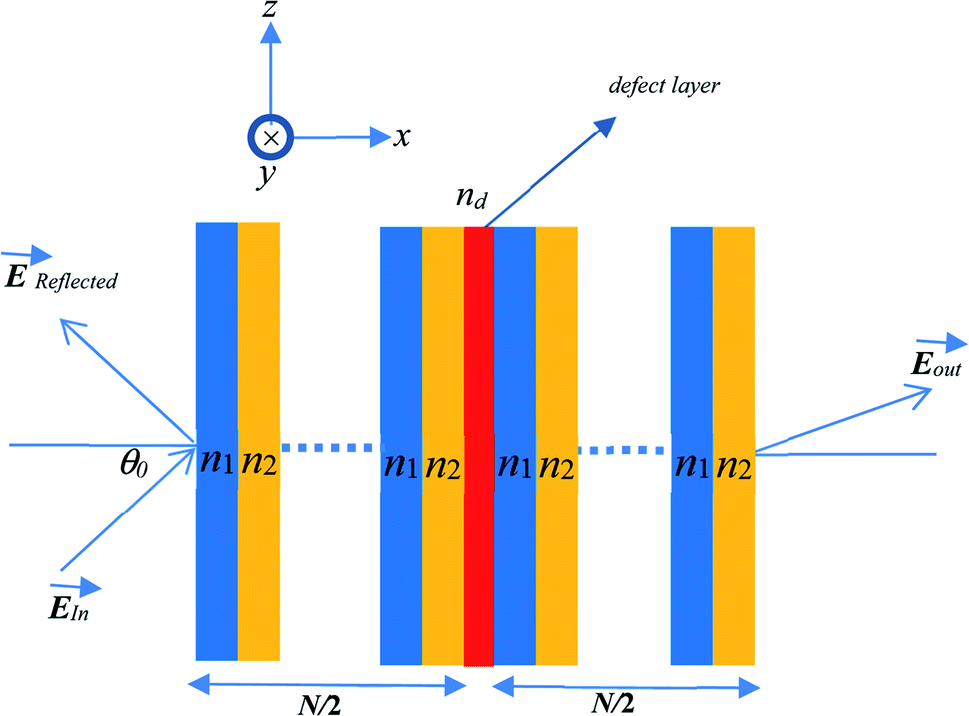
Fig. 1 shows a schematic diagram of the proposed structure of the PC-based sensor. The design consists of alternating finite layers of N-FK51A glass (fluor crown) and ZrO2 (zirconia) arranged in a planar manner forming a periodic multiple unit-cell structure. The periodicity of the structure is broken by introducing a defect layer in the middle of the structure. The whole structure is mounted on a glass substrate.
 |
| | Fig. 1 Schematic diagram of the proposed defective binary photonic crystal structure. | |
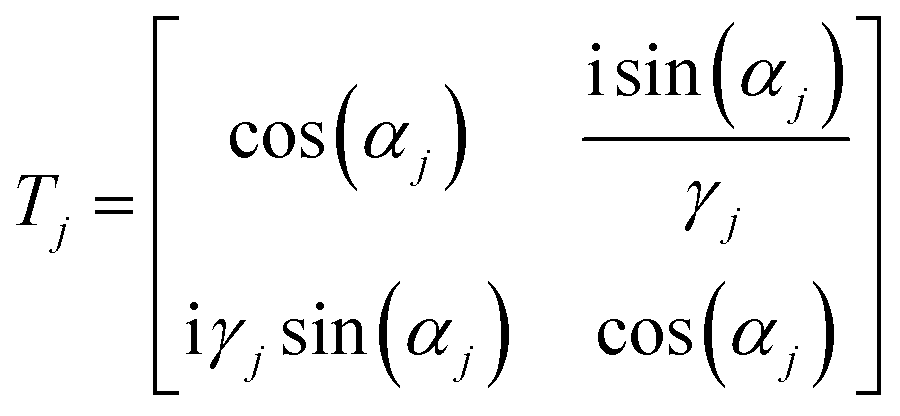
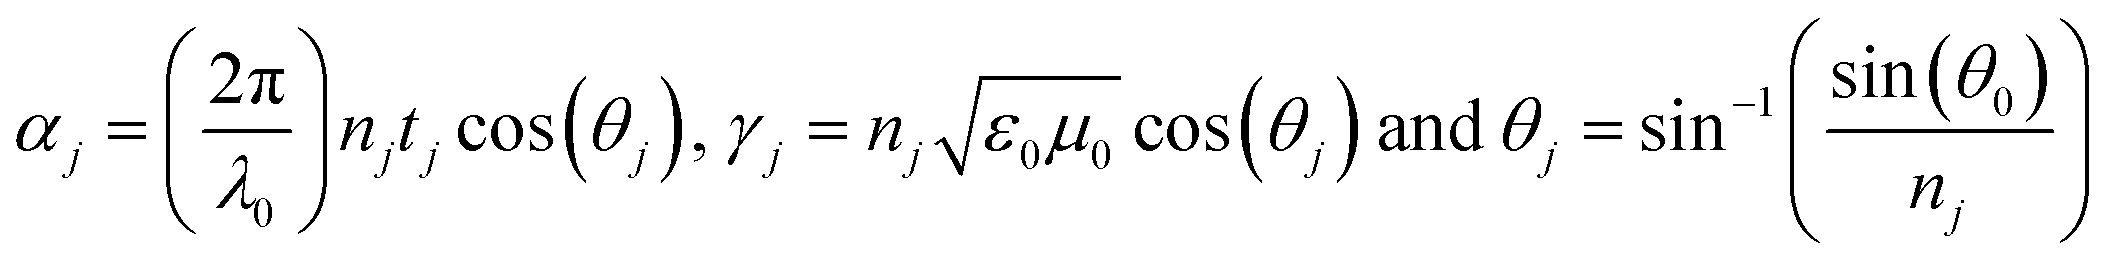
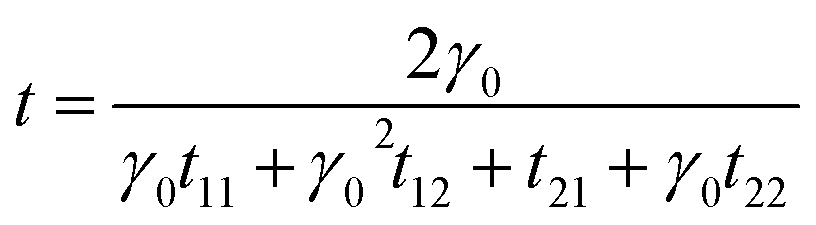
According to the TMM, each layer is characterized by a transfer matrix given by42
| |
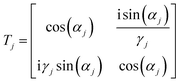 | (1) |
where
j = 1, 2 or
d refers to the alternating layers or defect layer, respectively.
nj and
tj are the refractive index and the thickness of the
jth layer, respectively.
ε0,
μ0 are the permittivity and permeability of free space, respectively,
λ0 and
θ0 are the wavelength and angle of incidence of the radiation in free space, respectively.
θj is the angle of incidence in the
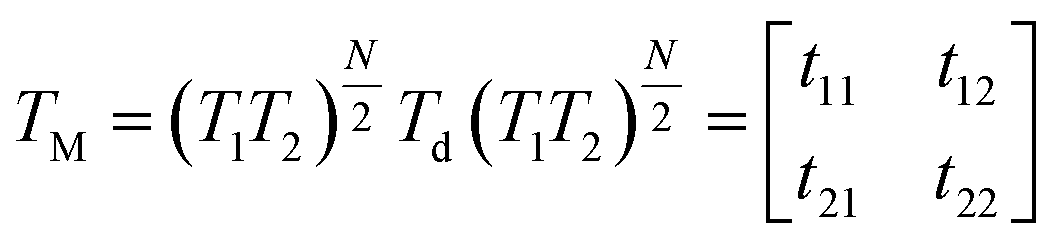
jth layer. For the whole proposed structure with a number of
N unit cells of N-FK51A/ZrO
2 and a defect layer in the middle of the structure, the overall transfer matrix,
TM, is given by
| |
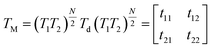 | (2) |
The transmission coefficient of the spectra tunnelling through the entire structure in terms of the elements of TM is given by
| |
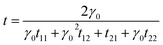 | (3) |
Hence, the transmittance, T, can then be determined using
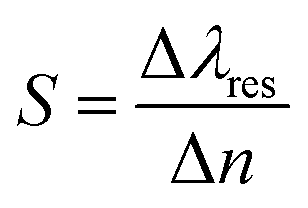
The sensitivity (S), quality factor (Q) and figure of merit (FOM) are the main parameters to describe the proposed structure efficacy. The sensitivity is defined as the ratio of the change in the resonant wavelength (due to the presence of analyte), Δλres, to the change in the refractive index, Δn. It is measured in nm RIU−1.
| |
 | (5) |
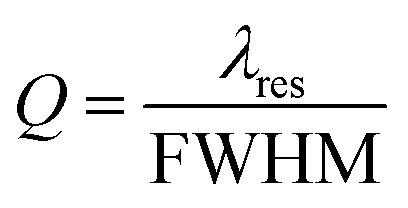
The quality factor (Q) which explains the sharpness of the resonant peak is defined as the ratio of the obtained resonant wavelength, λres, to the Full Width at Half Maximum, FWHM. Q should be as high as possible and it is a unit-less parameter.
| |
 | (6) |
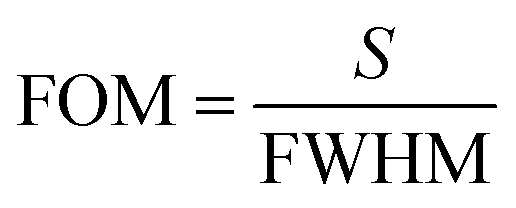
The figure of merit (FOM) is the ability of the sensor to probe the change in the resonant peaks. It is directly proportional to the sensitivity (S) and inversely proportional to the full width at half maxima (FWHM) of the resonant peak and is given by
| |
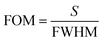 | (7) |
Results and discussion
The refractive indices of the materials used in the proposed structure are calculated using the Sellmeier approximation formula at room temperature given by:43,44| |
 | (8a) |
| |
 | (8b) |
where n1 is the refractive index of N-FK51A glass, n2 is the refractive index of ZrO2, and λ is the wavelength of the incident radiation in μm.
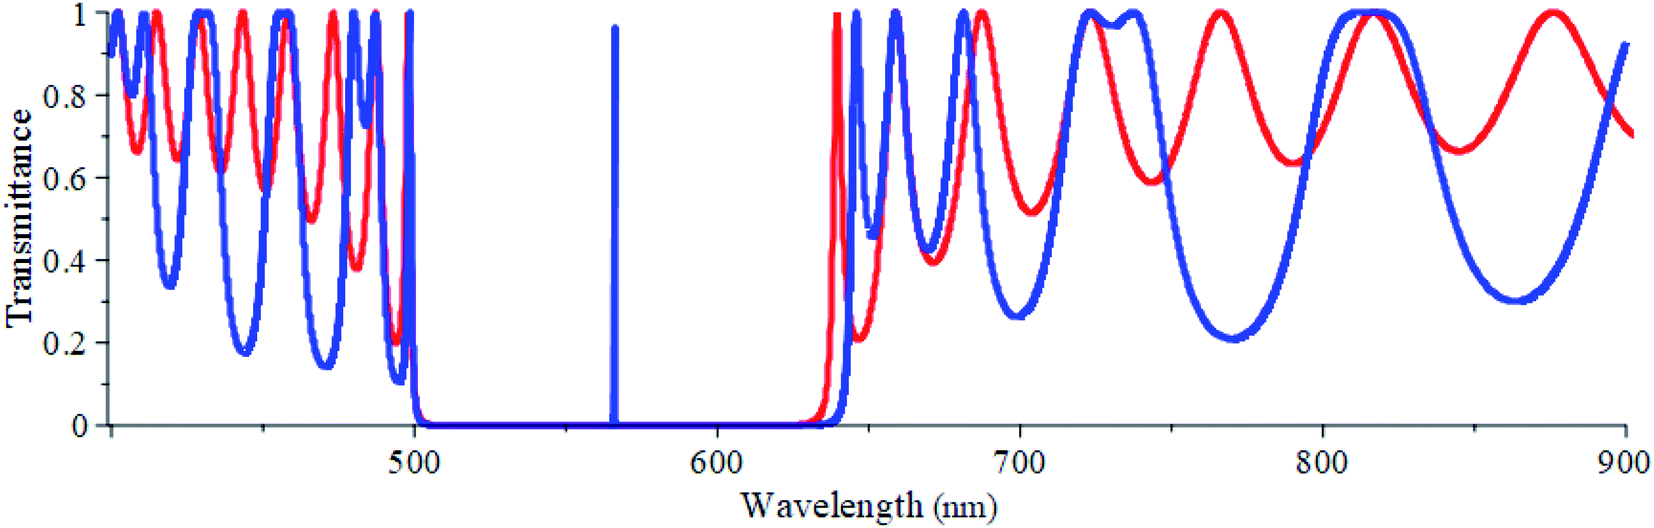
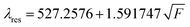
In this work, the transmittance is simulated in the spectrum range of 400 to 900 nm using the MAPLE software based on the Transfer Matrix Method (TMM). In this method, the incident radiation at an angle of incidence (θ0) experiences successive transmissions and reflections at the interfaces separating the adjacent layers of the PC.42 The electric field vector of the incident beam is assumed to be perpendicular to the plane of incidence (the so-called s-polarization or TE mode). The materials used in the proposed structure are nonmagnetic (relative permeability equals unity) and their refractive indices are dependent on the wavelength of the incident radiation. The layers are also assumed to be both homogeneous, isotropic and optically flat. The thicknesses of the N-FK51A and zirconia layers are chosen as 94.14 nm and 64.75 nm, respectively. The thickness of each layer is chosen in the order of the incident light wavelength so to keep the path difference between reflected and transmitted beams small in comparison to the coherence length of the monochromatic light. This ensures that the beams are essentially coherent.42 Fig. 2 illustrates the transmittance spectrum of the proposed PC without and with a defect layer. A trial and error method is used in simulating the transmittance spectrum to obtain the right number of unit cells that will produce a PBG with well-defined edges. After a series of trials, a well-defined PBG (of 128 nm spectral width) is achieved when the number of unit cells N = 20 as can be seen in Fig. 2 (the red colored curve). When an additional defect layer, with a thickness of td = 1.0 μm filled merely with air (no analyte), is introduced in the middle of the structure, the PBG spectral width increased to 137 nm (Fig. 2, the blue-colored curve). Besides, a resonant guided optical mode is developed within the PBG at a resonant wavelength of 566.1 nm. Producing the guided optical mode as a result of breaking the periodicity of the PC structure is very essential for sensing purposes. We focus now on determining the thickness of the defect layer with which the resonant peak becomes as sharp and distinguishable from other undesired peaks as possible. It was reported that during homogenization process which is widely used in milk processing in the dairy industry, the milk fat globule (MFG) size is between 0.3–0.8 μm in diameter.10,45,46 Therefore, to accommodate the fat globules, we have chosen four thicknesses of 1.00 μm, 1.05 μm, 1.10 μm and 1.20 μm for the defect layer.
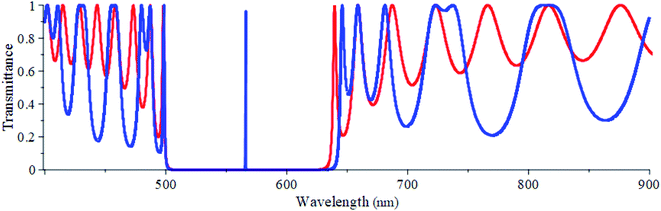 |
| | Fig. 2 Transmittance versus wavelength at normal incidence of the proposed PC without a defect layer (red) and with a defect layer with td = 1.0 μm filled with air (blue). | |
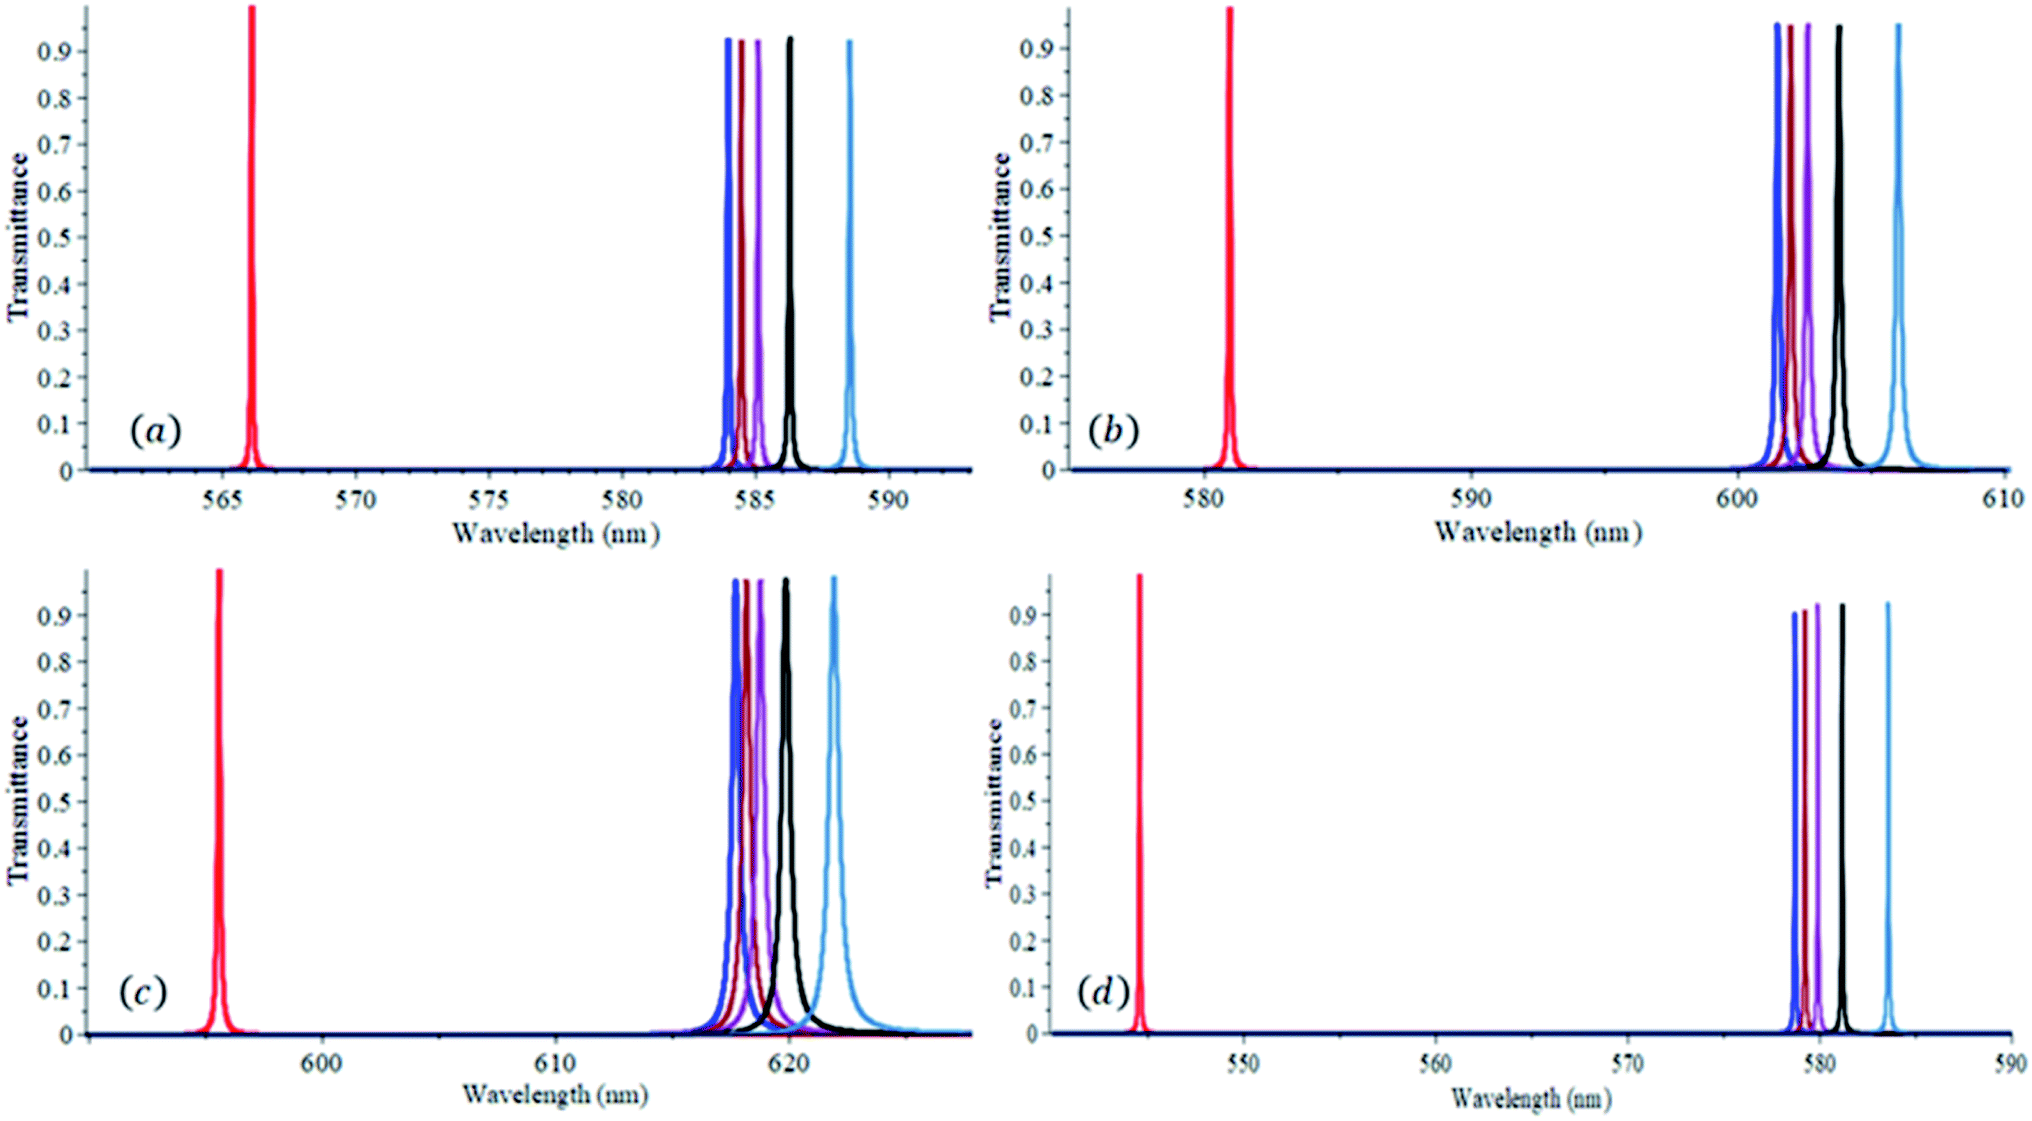
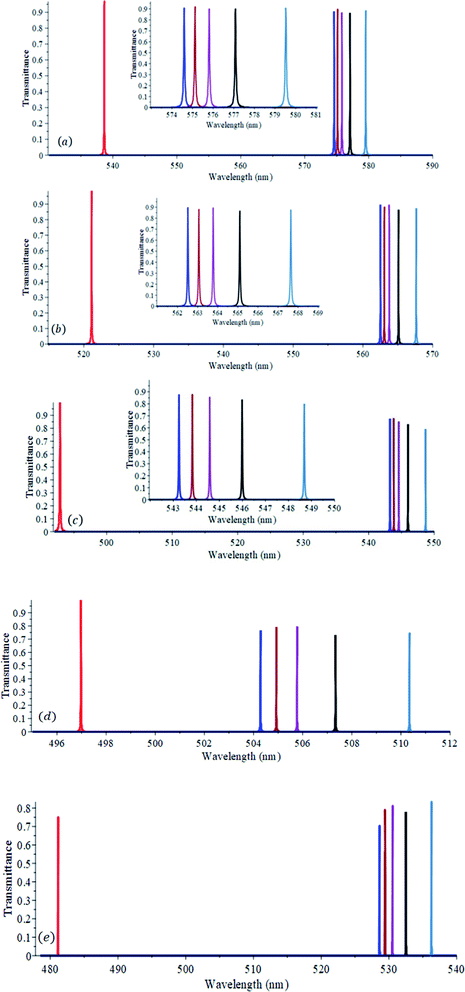
Fig. 3 demonstrates the transmittance spectrum versus wavelength for some commercial milk samples of different refractive indices when defect layer thicknesses of 1.00 μm, 1.05 μm, 1.10 μm and 1.20 μm are used. Practically, the liquid milk is injected in the defect layer using a syringe.47,48 We assume that the volume concentration of the main nutritional constituents in commercial milk such as fat, protein, lactose, mineral and vitamins,49 except the volume concentration of fat, is the same for all milk samples investigated here. Therefore, the difference in refractive indices among the milk samples used is assumed to be only due to the difference in fat volume concentrations. The refractive indices and fat volume concentrations of milk samples investigated in this work are taken from ref. 8. For each defect layer thickness, as can be seen in Fig. 3(a–d), a reasonable redshift in the resonant wavelengths occurs as the refractive index increases due to the increase of the fat concentration in milk. This indicates that the proposed structure is very efficient in sensing the miniature change in the refractive index. To further investigate the efficiency of the proposed structure, the sensitivity (S), quality factor (Q), and the figure of merit (FOM) for the chosen defect thicknesses are calculated and listed in Table 1. The sensitivity of the proposed structure on average increased from 55.1 nm RIU−1 to 101.3 nm RIU−1 as the defect layer thickness increased from 1.00 μm to 1.20 μm. Also, this increase in the defect layer thickness resulted in an increase in the quality factor and figure of merit average values from 7479 to 9121 and from 702 to 1588, respectively. As such, considering the highest values of S, Q and FOM, we will assume that 1.20 μm is the right choice for the defect layer thickness of the proposed structure to have an efficient sensor.
 |
| | Fig. 3 Transmittance versus wavelength at normal incidence of the proposed PC when the defect layer is filled with milk samples with different refractive indices, n, of 1.0 (red), 1.3483 (blue), 1.35012 (brown), 1.3525 (Niagara dark orchid), 1.35692 (black) and 1.36541 (steel blue). The defect layer thickness is 1.00 μm (a), 1.05 μm (b), 1.10 μm (c) and 1.20 μm (d). | |
Table 1 The sensitivity, quality factor, and the figure of merit at normal incidence for the proposed PC structure
| td (μm) |
n = 1.3483 |
n = 1.35012 |
n = 1.3525 |
n = 1.35692 |
n = 1.36541 |
| Sensitivity (nm RIU−1) |
| 1.0 |
51.3 |
52.4 |
53.9 |
56.5 |
61.4 |
| 1.05 |
59.0 |
60.0 |
61.4 |
64.0 |
68.6 |
| 1.10 |
63.6 |
64.5 |
65.8 |
68.1 |
72.1 |
| 1.20 |
98.0 |
98.9 |
100.2 |
102.5 |
106.7 |
![[thin space (1/6-em)]](https://www.rsc.org/images/entities/char_2009.gif) |
| Quality factor |
| 1.0 |
7584.0 |
7590.3 |
7598.5 |
7613.9 |
7006.3 |
| 1.05 |
4177.0 |
4180.3 |
3862.8 |
3593.9 |
3366.7 |
| 1.10 |
1715.9 |
1717.1 |
1586.6 |
1511.9 |
1323.3 |
| 1.20 |
9645.0 |
9653.7 |
9665.0 |
8302.3 |
8336.7 |
|
| Figure of merit |
| 1.0 |
666.1 |
680.5 |
699.4 |
733.8 |
730.5 |
| 1.05 |
409.6 |
417.0 |
393.9 |
380.8 |
381.1 |
| 1.10 |
176.6 |
179.2 |
168.7 |
166.0 |
153.5 |
| 1.20 |
1632.7 |
1649.0 |
1670.0 |
1464.1 |
1524.3 |
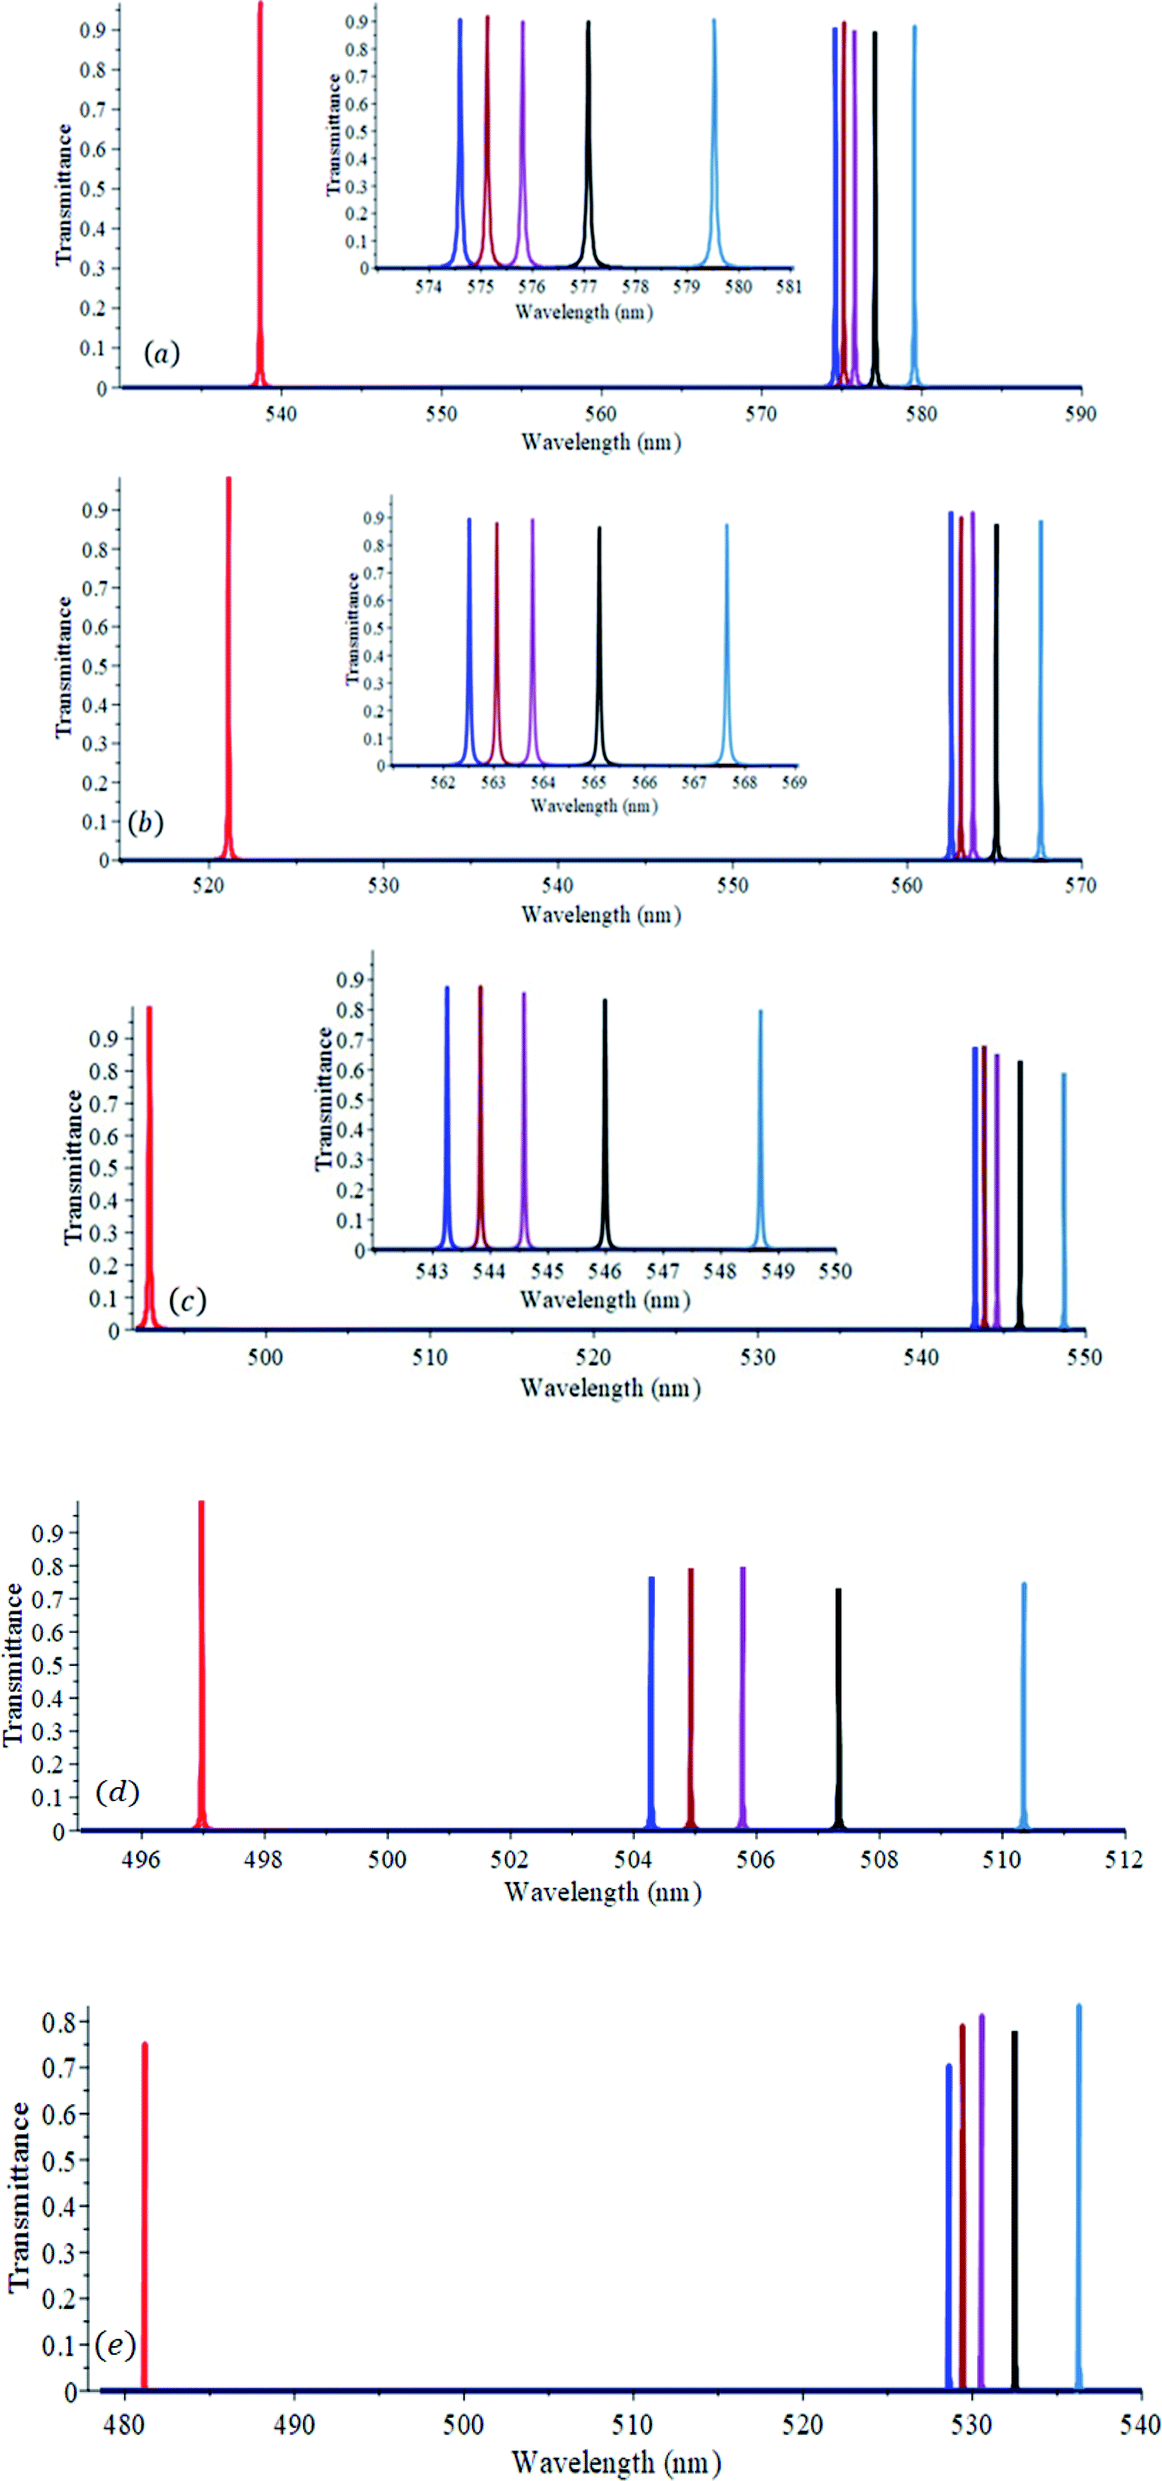
To study the effect of the incident angle of radiation on the performance of the proposed sensor we plot in Fig. 4(a–e) the transmittance versus wavelength for the different milk samples at angles of 10°, 20°, 30°, 45° and 60°. At each angle of incidence, the values of S, Q and FOM are evaluated and listed in Table 2.
 |
| | Fig. 4 Transmittance versus wavelength of the proposed sensor when the defect layer with a thickness of 1.20 μm is filled with milk samples with different refractive indices, n, of 1.0 (red), 1.3483 (blue), 1.35012 (brown), 1.3525 (Niagara dark orchid), 1.35692 (black) and 1.36541 (steel blue). The angle of incidence of radiation is 10° (a), 20° (b), 30° (c) 45° (d), 60° (e). | |
Table 2 The sensitivity, quality factor, and figure of merit for the proposed sensor when td = 1.20 μm
| θ0 (°) |
n = 1.3483 |
n = 1.35012 |
n = 1.3525 |
n = 1.35692 |
n = 1.36541 |
| Sensitivity (nm RIU−1) |
| 0 |
98.0 |
98.9 |
100.2 |
102.5 |
106.7 |
| 10 |
103.2 |
104.2 |
105.4 |
107.7 |
111.9 |
| 20 |
118.9 |
119.8 |
121.0 |
123.3 |
127.3 |
| 30 |
144.5 |
145.4 |
146.6 |
148.7 |
152.7 |
| 45 |
21 |
22.7 |
24.9 |
29.0 |
36.6 |
| 60 |
136.3 |
137.9 |
140.0 |
143.9 |
150.9 |
|
| Quality factor |
| 0 |
9645.0 |
9653.7 |
9665.0 |
8302.3 |
8336.7 |
| 10 |
11970.7 |
9585.3 |
11995.9 |
12022.7 |
9658.7 |
| 20 |
15625.3 |
15640.7 |
15660.3 |
11773.0 |
11825.8 |
| 30 |
23415.9 |
23440.9 |
23473.4 |
23533.9 |
23650.4 |
| 45 |
74159.6 |
49502.7 |
49585.4 |
74608.6 |
75050.6 |
| 60 |
51573.9 |
51654.4 |
51759.4 |
51953.4 |
34881.6 |
|
| Figure of merit |
| 0 |
1632.7 |
1649.0 |
1670.0 |
1464.1 |
1524.3 |
| 10 |
2149.7 |
1736.0 |
2195.7 |
2243.5 |
1864.2 |
| 20 |
3301.8 |
3328.4 |
3361.7 |
2567.8 |
2652.5 |
| 30 |
6230.3 |
6269.3 |
6319.1 |
6410.4 |
6580.3 |
| 45 |
3085.0 |
2225.9 |
2445.4 |
4268.5 |
5378.9 |
| 60 |
13294.6 |
13455.4 |
13662.4 |
14036.8 |
9813.6 |
From Fig. 4 and the data listed in Table 2, one can see that when the angle of incidence increased from 0° to 60° the average values of S, Q and FOM increased from 101 nm RIU−1 to 142 nm RIU−1, from 9120 to 48365 and from 1588 to 12853, respectively. This behavior of the sensor gives an extra degree of freedom for the designer since they have a window of 60° tolerance to set up the sensor.
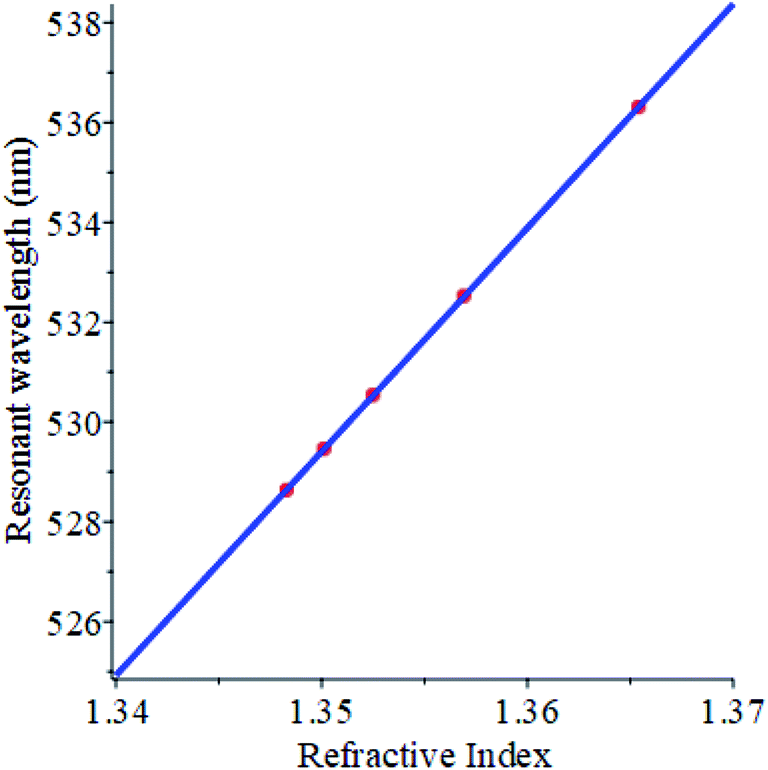
The variation of the resonant wavelength as a function of the refractive index of milk samples is depicted in Fig. 5, with a defect layer thickness of 1.2 μm and an angle of incidence of 60°. The resonant wavelength is found to vary linearly with the refractive index. Hence, an empirical linear relationship between the resonant wavelength and the refractive index is obtained using the least square fitting and expressed in the following equation
| | |
λres = −75.7613727 + 448.2721165n
| (9) |
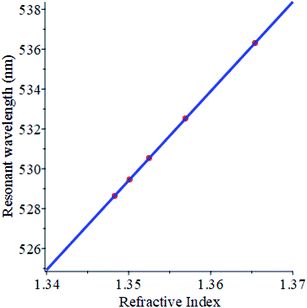 |
| | Fig. 5 The resonant wavelength versus the refractive index of the milk samples used in this work. The red dots are for the refractive indices of milk samples and the blue line is the least square fit. | |
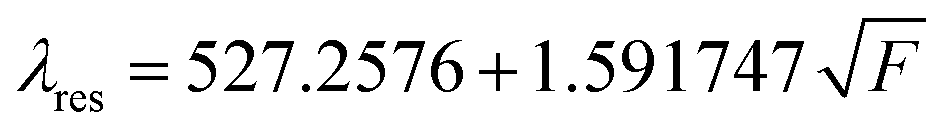
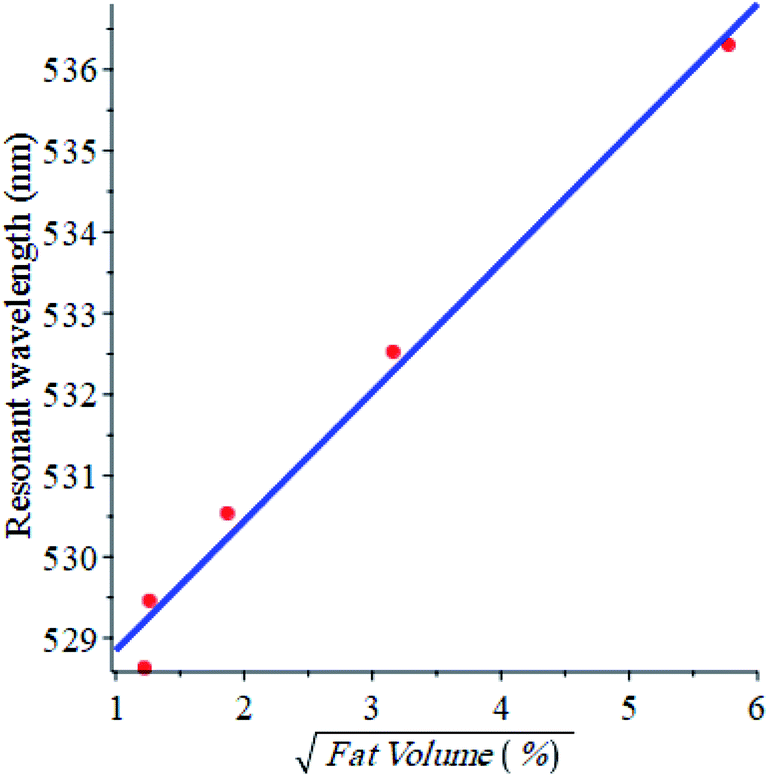
Fig. 6 shows the variation of the resonant wavelength with the fat volume concentration (%). The data obtained is also fitted to a linear relationship between the resonant wavelength and the square root of the fat volume concentration and it is shown below in eqn (10).
| |
 | (10) |
where
F is the fat volume (%) in milk.
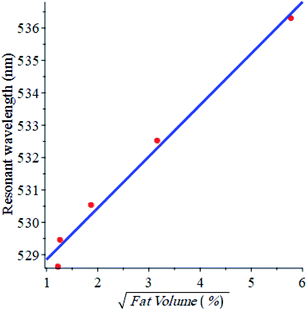 |
| | Fig. 6 The resonant wavelength versus the square root of fat volume (%) in the milk samples used in this work. | |
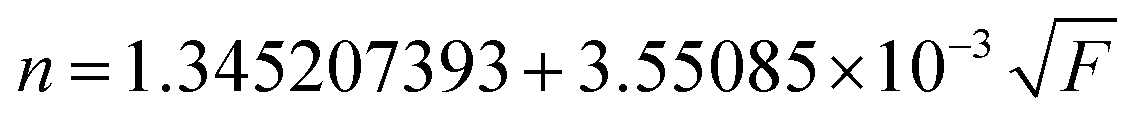
From eqn (9) and (10) an empirical formula that relates n and F can be deduced as
| |
 | (11) |
The refractive index for different fat volumes in milk is calculated using eqn (11) and compared with the published values from literature in Table 3.
Table 3 The fat volume (%) and refractive index, n, for some commercial milk samples
| Fat volume (%) |
n (this work) |
n (published work) |
Difference |
Ref. |
| 0 |
1.345208938 |
1.3469 |
−0.0016926 |
10 |
| 0.05 |
1.346002802 |
1.349 |
−0.0029986 |
9 |
| 0.4 |
1.347454325 |
1.34846 |
−0.0010069 |
8 |
| 1.5 |
1.349557112 |
1.3483 |
0.0012563 |
10 |
| 1.6 |
1.349699713 |
1.35012 |
−0.0004211 |
8 |
| 3.3 |
1.351658322 |
1.35123 |
0.0004278 |
8 |
| 3.5 |
1.351850883 |
1.3525 |
−0.0006496 |
10 |
| 4.3 |
1.352570932 |
1.347 |
0.00055706 |
9 |
| 5.2 |
1.353304797 |
1.3468 |
0.0065046 |
11 |
| 6.6 |
1.354329744 |
1.346 |
0.0083297 |
9 |
| 10 |
1.356435874 |
1.35692 |
−0.0004838 |
8 |
| 8.1 |
1.355313181 |
1.3563 |
−0.0009867 |
11 |
| 33.3 |
1.365696174 |
1.36541 |
0.0002880 |
8 |
Fig. 7 displays a density-colored map of the effects of both the wavelength and refractive index of milk samples on the transmittance at normal incidence. The wavelength range is 577–585 nm which covers the PBG spectral widths with the resonant wavelengths for all milk samples. The resonant wavelength shifts towards higher values as the refractive index increased which is consistent with the results obtained in Fig. 3(d).
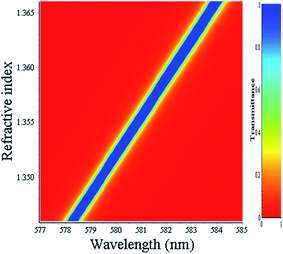 |
| | Fig. 7 Density plot mapping the variation of the transmittance at normal incidence of the proposed structure with both the wavelength of the incident radiation and the refractive index of commercial milk samples. The defect layer thickness is 1.20 μm. | |
Conclusions
We conclude that the proposed structure is very efficient in detecting the fat volume in milk as it is very sensitive to any minute change in fat volume. The change in the resonant wavelength due to the change in fat volume is formulated empirically. The empirical formulae deduced in this work can be used to estimate the refractive index of milk and determine its fat volume density. We believe that the proposed sensor is very useful in quality control in the food-processing industry. The proposed sensor is simple in structure and easy to fabricate.
Author contributions
Khedr M. Abohassan: conceptualization, computational analysis, introducing and managing resources and draft and introduction writing. Hassan S. Ashour: development of software and writing codes, computational analysis. Mazen M. Abadla: theoretical establishment, analysis, writing editing, final review of article and correspondence.
Conflicts of interest
The authors declare they have no conflicts of interest.
References
- L. Da Silva Dias, J. C. Da Silva, A. L. De Souza Maudeira Felicio and J. A. De Franca, IEEE Trans. Instrum. Meas., 2018, 67, 2812–2819 CAS.
- F. Mabood, J. Hussain, A. N. Moo, S. A. Gilani, S. Farooq, Z. Naureen, F. Jabeen, M. Ahmed, Z. Hussain and A. Al Harrasi, Adv. Dairy Res., 2017, 5, 1–5 Search PubMed.
- B. G. Botelho, N. Reis, L. S. Oliveira and M. M. Sena, Food Chem., 2015, 181, 31–37 CrossRef CAS PubMed.
- P. A. da Costa Filho, L. Cobuccio, D. Mainali, M. Rault and C. Cavin, Food Contr., 2020, 113, 107114, DOI:10.1016/j.foodcont.2020.107114.
- K. Kene Ejeahalaka and S. L. W. On, Food Chem., 2020, 309, 125785, DOI:10.1016/j.foodchem.2019.125785.
- W. Terouzi, S. Omari, K. Boutoial and A. Oussama, Quest Journals Journal of Research in Agriculture and Animal Science., 2016, 4(1), 1–7 Search PubMed.
- S. Kasemsumran, W. Thanapase and A. Kiatsoonthon, Anal. Sci., 2007, 23, 907–910 CrossRef CAS PubMed.
- W. R. Calhoun, H. Maeta, S. Roy, L. M. Bali and S. Bali, J. Dairy Sci., 2010, 93, 3497–3504 CrossRef CAS.
- U. Biswas, J. K. Rakshit and G. K. Bharti, Opt. Quant. Electron., 2020, 52(10), 1–15 CrossRef.
- A. J. Jääskeläinen, K. E. Peiponen and J. A. Räty, J. Dairy Sci., 2001, 84, 38–43 CrossRef.
- K. S. Rangappa, Proc. Indian Acad. Sci. Sect. B, 1947, 26, 125–135 Search PubMed.
- G. H. Meeten, A. N. North and F. M. Willmouth, J. Phys. E: Sci. Instrum., 1984, 17, 642–643 CrossRef CAS.
- G. H. Meeten and A. N. North, Meas. Sci. Technol., 1995, 6, 214–221 CrossRef CAS.
- J. E. Geake, C. S. Mill and M. S. Mohammadi, Meas. Sci. Technol., 1994, 5, 531–539 CrossRef CAS.
- M. Mohammadi, Adv. Colloid Interface Sci., 1995, 62, 17–29 CrossRef CAS.
- J. Räty, E. Keränen and K. E. Peiponen, Meas. Sci. Technol., 1998, 9(1), 95–99 CrossRef.
- J. Räty, K. E. Peiponen, A. Jääskeläinen and M. O. A. Mäkinen, Appl. Spectrosc., 2002, 56(7), 935–941 CrossRef.
- K. E. Peiponen, J. Räty, E. M. Vartiainen, T. Sugiura and S. Kawata, Meas. Sci. Technol., 1999, 10(12), N145–N148 CrossRef CAS.
- S. Singh and V. Kaur, in International Conference on Ubiquitous and Future Networks, ICUFN, 2017, pp. 399-403 Search PubMed.
- Y. N. Zhang, Y. Zhao and R. Q. Lv, Sens. Actuators, A, 2015, 233, 374–389 CrossRef CAS.
- D. Threm, Y. Nazirizadeh and M. Gerken, J. Biophot., 2012, 5, 601–616 CrossRef CAS PubMed.
- F. W. Scheller, U. Wollenberger, A. Warsinke and F. Lisdat, Curr. Opin. Biotechnol., 2001, 12(1), 35–40 CrossRef CAS PubMed.
- M. F. Pineda, L. L. Y. Chan, C. J. Choi, B. T. Cunningham, T. Kuhlenschmidt and M. Kuhlenschmidt, IEEE Sens. J., 2009, 9(4), 470–477 CAS.
- M. Kamp, T. Happ, S. Mahnkopf, G. Duan, S. Anand and A. Forchel, Phys. E Low-dimens. Syst. Nanostruct., 2004, 21, 802–808 CrossRef.
- F. Poli, A. Cucinotta and S. Selleri, Photonic crystal fibers: properties and applications, Springer, 2007, pp. 7–42 Search PubMed.
- R. A. Caruso, A. Susha and F. Caruso, Chem. Mater., 2001, 13, 400–409 CrossRef CAS.
- Y. Y. An, J. Wang, W. M. Zhou, H. X. Jin, J. F. Li and C. W. Wang, Superlattices Microstruct., 2018, 119, 1–8 CrossRef CAS.
- X. G. Wang, J. Wang, J. F. Li, D. W. Tao, W. M. Zhou, Y. Li and C. W. Wang, Opt. Mater., 2020, 105, 109982, DOI:10.1016/j.optmat.2020.109982.
- E. Yablonovitch, J. Opt. Soc. Am. B, 1993, 10(2), 283–295 CrossRef CAS.
- J. D. Joannopoulos, P. R. Villeneuve and S. Fan, Solid State Commun., 1997, 102, 165–173 CrossRef CAS.
- M. M. Abadla, K. M. Abohassan and H. S. Ashour, Phys. B, 2021, 601, 412436, DOI:10.1016/j.physb.2020.412436.
- S. Robinson and R. Nakkeer, in Advances in Photonic Crystals, IntechOpen, 2013, pp. 1–18 Search PubMed.
- K. M. Abohassan, H. S. Ashour and M. M. Abadla, Results Phys., 2021, 22, 103882, DOI:10.1016/j.rinp.2021.103882.
- S. John, Phys. Rev. Lett., 1987, 58, 2486–2489 CrossRef CAS PubMed.
- M. M. Abadla and H. A. Elsayed, Appl. Opt., 2020, 59, 418–424 CrossRef CAS PubMed.
- A. H. Aly and Z. A. Zaky, Cryogenics, 2019, 104, 102991, DOI:10.1016/j.cryogenics.2019.102991.
- E. Yablonovitch, Phys. Rev. Lett., 1987, 58, 2059–2062 CrossRef CAS PubMed.
- L. C. Botten, N. A. Nicorovici, R. C. McPhedran, C. M. de Sterke and A. A. Asatryan, Phys. Rev. E: Stat. Phys., Plasmas, Fluids, Relat. Interdiscip. Top., 2001, 64(4), 046603 CrossRef CAS PubMed.
- S. Şimşek, International Journal of Electronics and Communications, 2013, 67, 827–832 CrossRef.
- J. B. Pendry and A. MacKinnon, Phys. Rev. Lett., 1992, 69, 2772–2775 CrossRef CAS PubMed.
- F. Zhenkai, W. Yingying, Z. Zhang, B. Wang, R. Zhao, X. Zhang and R. Wu, Opt. Fiber Technol., 2019, 49, 1–6 CrossRef.
- F. L. Pedrotti, L. M. Pedrotti and L. S. Pedrotti, Introduction to Optics, Cambridge University Press, 2017, pp. 476–490 Search PubMed.
- SCHOTT Zemax catalog 2017-01-20b, http://www.schott.com.
- D. L. Wood and K. Nassau, Appl. Opt., 1982, 21, 2978–2981 CrossRef CAS PubMed.
- T. Truong, M. Palmer, N. Bansal and B. Bhandari, Methodologies to Vary Milk Fat Globule Size, Springer, 2016, pp. 15–30 Search PubMed.
- T. M. Ho, P. Dhungana, B. Bhandari and N. Bansal, J. Food Eng., 2021, 291, 110227, DOI:10.1016/j.jfoodeng.2020.110227.
- D. Roy, A. Ye, P. J. Moughan and H. Singh, J. Dairy Sci., 2020, 103, 5844, DOI:10.3168/jds.2019-17571.
- J. Divya, S. Selvendran and A. Sivanantha Raja, Laser Phys., 2018, 28(6), 1–8 CrossRef.
- Z. Zhu and W. Guo, Crit. Rev. Food Sci. Nutr., 2021, 61, 312, DOI:10.1080/10408398.2020.1731417.
|
| This journal is © The Royal Society of Chemistry 2021 |
Click here to see how this site uses Cookies. View our privacy policy here. 
 Open Access Article
 This Open Access Article is licensed under a Creative Commons Attribution-Non Commercial 3.0 Unported Licence
 *c
*c