DOI:
10.1039/D1RA00910A
(Paper)
RSC Adv., 2021,
11, 16339-16350
A frogspawn-like Ag@C core–shell structure for an ultrasensitive label-free electrochemical immunosensing of carcinoembryonic antigen in blood plasma
Received
3rd February 2021
, Accepted 18th April 2021
First published on 4th May 2021
Abstract
A three-dimensional (3D) frogspawn-like structure was achieved by simply coating nano-carbon outside silver nanospheres (Ag@C NFS) and used as a probe to capture the anti-carcinoembryonic antigen for the electrochemical immunosensing of carcinoembryonic antigen (CEA), a typical biomarker of several diseases such as gastric cancer, intestinal cancer and colon cancer. Moreover, Ag@C nanocables (Ag@C NCs) were aslo synthesized. By comparison, the globular 3D frogspawn-like structure endowed Ag@C NFS with a larger surface area, which is preferred to improve the capability of loading antibodies, higher water solubility, better biocompatibility and improved electrical conductivity, which was likely attributed to the synergistic effects of Ag and crystalline graphite carbon and the different structure with more hydroxyl groups exposed. Therefore, the resultant Ag@C NFS was used as an electrochemical immunosensing platform to fabricate a label-free immunosensor for the analysis of CEA, which showed an excellent immunosensing performance with a wide linear CEA detection range from 0.0001 ng mL−1 to 100 ng mL−1 and a low detection limit of 5.12 pg mL−1. In particular, the good reproducibility, high stability and specificity of the proposed immunosensor ensured the successful application in the quantitative determination of CEA in cancerous human serum samples, providing a promising alternative to detect other biomarkers.
1. Introduction
In recent years, great strides have been made to reduce death rates from cancer in virtue of various diagnostic technologies, such as magnetic resonance (MR) imaging,1 X-ray computed tomography (CT) imaging2 and photoacoustic (PA) imaging.3 However, these techniques can only detect established tumors. In some cases, it's too late. Therefore, it's urgent to find one method that could detect tumor markers generated by the body or by the tumor tissue itself, rapidly and quantitatively for cancer preliminary screening and risk evaluation.4,5 As one of the most reliable and preferred tumor markers, CEA has most typically been used to predict the potential for patients having mammary gland, lung, or colorectal cancer, with a CEA level above 5 ng mL−1 for tumor existence in the abovementioned organs.6,7 So far, although several methods have been used for detecting CEA, such as electrochemiluminescence immunoassay,8 enzyme-linked immunosorbent assay (ELISA),9 photoelectrochemical immunoassay10 and radioimmunoassay,11 the fairly high required time or costs limit their further application to some extent.12 As a preferred alternative, electrochemical immunosensors have been widely used for testing CEA and some other tumor markers due to their high efficiency, low cost and miniaturized operating equipment.13–16 As an important type of electrochemical immunosensor, label-free electrochemical immunosensors have a big advantage over labeled (sandwich-type) electrochemical immunosensors because of their simpler architecture.17,18 Compared with labeled immunosensors, label-free electrochemical immunosensors don't require a complicated labeling process. In other words, label-free electrochemical immunosensors could directly monitor the binding process of antibody–antigen interaction by amperometric measurements or electrochemical impedance spectroscopy without the involvement of secondary antibodies.14,18,19 Therefore, more and more attention has been paid to the application of label-free electrochemical immunosensors in the field of tumor marker detection.20–22 In addition, the detection principle of the electrochemical immunosensor is specific binding of antibodies (Ab) and antigens (Ag), ensuring a fairly high specificity.23
To make the designed electrochemical immunosensor with a satisfactory detection limit and high sensitivity, it is critical to explore optimal electrode materials that can not only accelerate charge transfer on the surface of the electrode but also can provide a high specific surface area to anchor more antibodies. To date, noble metal nanomaterials, such as gold nanorods,24 palladium nanocubes5 and silver nanoparticles,25 were commonly used for electrode materials because of their favourable electrical conductivity and biocompatibility, among which silver nanomaterials were the most commonly used, owing to their relatively low price for raw materials and comparable conductivity. Unfortunately, silver nanomaterials are apt to agglomerate and very easily denaturate when exposed to moist air.26 To address this dilemma, functional shells were usually constructed to protect the metal cores from agglomeration, as well as to improve their sensitivity for the detection of substances.27,28 As a promising candidate, carbon coating is of great research significance. On the one hand, the as-formed carbon coating could enhance the electrical conductivity through the cooperative effects with inner metal cores. On the other hand, the carbon shell is to a great extent the security umbrella of its inner silver NPs.28 Moreover, the hydrophilic hydroxyl groups on the carbon shell could significantly promote the composite's water solubility and biocompatibility.29
Herein, a three dimensional (3D) frogspawn-like structure core–shell nanocarbon coated silver nanosphere (Ag@C NFS) was directly constructed by a one-pot solvothermal method with the assistance of hexadecyl trimethyl ammonium bromide (CTAB) and utilized to capture anti-CEA (Ab) for the construction of a label-free electrochemical immunosensor for CEA detection, as shown in Scheme 1. For comparison, nanocarbon coated silver nanocables (Ag@C NCs) were synthesized and used to fabricate a label-free electrochemical immunosensor for CEA detection as well. It was found that the Ag@C NFSs demonstrated obviously better electrochemical properties and higher Ab loading capacity than Ag@C NCs, which was likely ascribed to the larger surface area, better biocompatibility, faster electron transfer as a result of different structures between Ag@C NFSs and Ag@C NCs and the synergistic effect of silver and nanocarbon. As expected, the obtained label-free immunosensor performed well in the detection of CEA in terms of sensitivity, selectivity, reproducibility and stability, indicating great potential for the quantitative detection of other tumor markers.
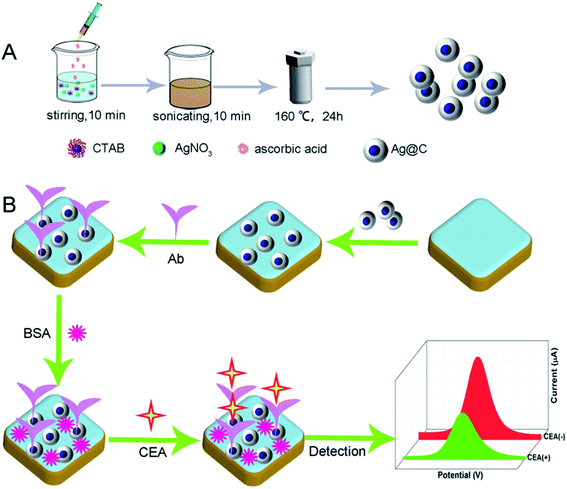 |
| | Scheme 1 Schematic illustration of (A) the preparation of Ag@C NFSs and (B) the fabrication of the Ag@C NFS-based electrochemical immunosensor for CEA detection. | |
2. Materials and methods
2.1. Reagents and materials
Ascorbic acid (AA), CTAB, glycerol, sulfuric acid (H2SO4), sodium phosphate monobasic dihydrate (NaH2PO4·2H2O), phosphate buffered solution (PBS) and sodium phosphate dibasic dodecahydrate (Na2HPO4·12H2O) were purchased from Aladdin Reagents Company (Shanghai, China). Polyvinylpyrrolidone K30 (PVP K30), silver nitrate (AgNO3), gamma alumina powder, potassium ferrocyanide trihydrate (K4Fe(CN)6·3H2O), potassium ferrocyanide (K3Fe(CN)6), and potassium chloride (KCl) were gained from Sinopharm Chemical Reagent Company (Shanghai, China). CEA antibody, CEA, PSA, human IgG, AFP and bovine serum albumin (BSA) were provided by Shanghai Linc-Bio Science Co. Ltd. All the reagents used in the experiments were of analytical grade and used as received. Double distilled water was provided by automatic double pure water distillation equipment (Shanghai Yarong Biochemical Instrument Factory) for the preparation of all aqueous solutions.
2.2. Apparatus
All electrochemical performance parameters are tested on an Autolab PGSTAT 100 potentiostat/galvanostat (Shanghai Nano Industrial Co., Ltd, China). A three electrode system with a platinum wire electrode as the counter electrode, a saturated calomel electrode (Hg/Hg2Cl2) as the reference electrode and a glassy carbon electrode (GCE) as the working electrode was used. The water contact angle was measured using the contact angle system OCA (Beijing Eastern-Dataphy Instruments Co., Ltd, China). Scanning electron microscopy (SEM) images and energy dispersive spectroscopy (EDS) spectra were obtained using a field emission SEM (Zeiss, Germany). Transmission electron microscopy (TEM) images were recorded using a JEOL JEM 2100F transmission electron microscope (TEM). X-ray powder diffraction (XRD) was tested using a Rigaku Ultima IV X-ray diffractometer from 5° to 80°. Fourier transform infrared (FT-IR) spectra were measured on a Nicolet 380 FT-IR spectrophotometer. Ultraviolet-visible absorption spectra were recorded on a UV-1900 spectrophotometer (Shimadzu, Japan). The hydrodynamic diameter was measured using a NanoBrook 90Plus Particle Size Analyzer.
2.3. Preparation of frogspawn-like Ag@C NFSs
The Ag@C NFSs were synthesized by a one-pot hydrothermal method.24 Briefly, 0.0849 g AgNO3 and 0.0546 g CTAB were completely dissolved in 30 mL double-distilled water with the assistance of magnetic stirring and ultrasonication. Then, the solution mixture was mixed with 10 mL of 0.03522 g mL−1 AA solution under sonication to obtain a homogeneous solution. Afterward, the final solution mixture was transferred to a 50 mL Teflon-lined autoclave and then maintained at 160 °C for 24 h after being well sealed. When the autoclave cooled to room temperature naturally, the resulting brown products were collected through centrifugation, washed with distilled water three times, and finally placed in a freeze-dryer for 6 h to remove all residual moisture.
2.4. Preparation of Ag@C NCs
The Ag@C NCs were prepared with the mediation of H2SO4 according to the previously reported procedure.30 Typically, 0.0015 mol of glycerol and 0.015 mol of AgNO3 were dissolved in 30 mL of 2 mol L−1 H2SO4 solution in sequence. After being stirred evenly, the mixed solution was redirected to a 50 mL autoclave and reacted at 180 °C for 12 h in an oven to produce the preferred Ag@C NCs.
2.5. Construction of the Ag@C NFS-based label-free electrochemical immunosensor
The whole construction process of the electrochemical immunosensor using Ag@C NFSs as an Ab capturer is clearly demonstrated in Scheme 1. First, a bare GCE was polished with alumina slurry with different diameters, and then ultrasonically rinsed with deionized water to achieve a mirrored surface. Then, 6 μL of 3.5 mg mL−1 Ag@C NFS containing aqueous solution was dropped on the pregrinded GCE and spontaneously dried in an incubator at 37 °C, followed by incubation with 5 μL of 5 μg mL−1 Ab. Afterwards, Ab was immobilized onto the Ag@C NFS modified GCE by the Ag–N bond. Subsequently, 3 μL of 1% BSA solution was pipetted onto the Ab captured electrode so as to seal the potential nonspecific active sites. Finally, the obtained electrode was covered with 6 μL CEA at different concentrations and then stored in a refrigerator at 4 °C for the following detection.
3. Results and discussion
3.1. Characterization of the synthesized Ag@C NFSs and Ag@C NCs
The morphology and structure of the obtained Ag@C NFSs and Ag@C NCs were characterized by both SEM and TEM (Fig. 1). As shown in Fig. 1A and B, the obtained Ag@C nanomaterials were of frogspawn-like structure in which the silver nanosphere acted as a core and nanocarbon with a nearly uniform thickness of about 60 nm as the shell. From Fig. 1C and D, it could be seen that the silver NCs were well wrapped with the carbon nanocoating with a similar diameter, quite smooth surface and straight morphologic structure. The elemental mapping images clearly show the elemental distribution of Ag and C in the structures of both Ag@C NFSs (Fig. 2A–C) and Ag@C NCs (Fig. 2D–F), verifying their successful synthesis.
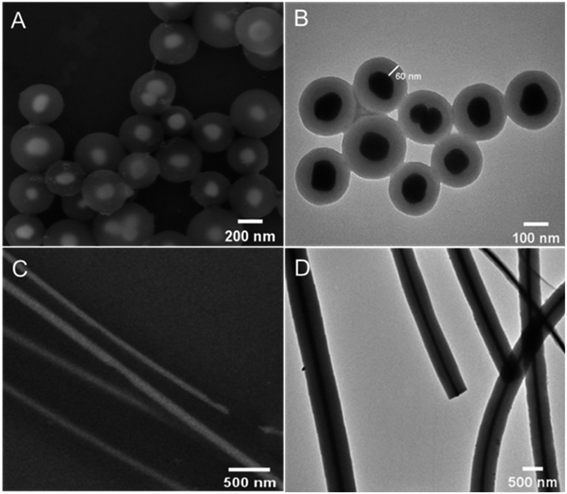 |
| | Fig. 1 SEM images of (A) Ag@C NFSs and (C) Ag@C NCs and TEM images of (B) Ag@C NFSs and (D) Ag@C NCs. | |
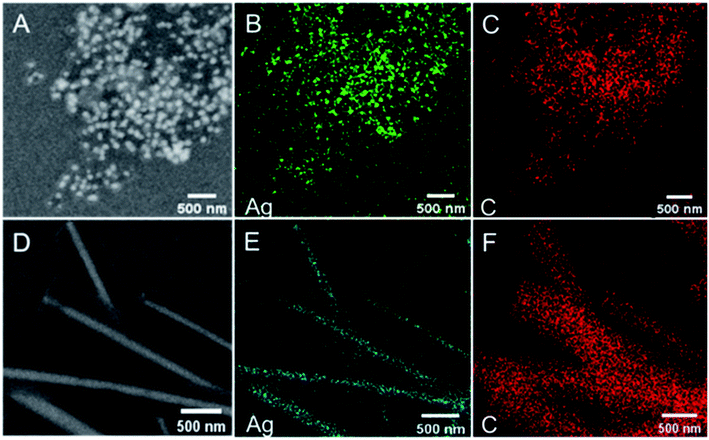 |
| | Fig. 2 SEM images of (A) Ag@C NFSs and (D) Ag@C NCs and energy-dispersive X-ray mapping images of Ag and C in (B and C) Ag@C NFSs and (E and F) Ag@C NCs. | |
In order to determine the actual size of the obtained Ag@C NFSs in the aqueous solution, dynamic light scattering (DLS) was selected to measure the hydrodynamic diameter of Ag@C NFSs. As shown in Fig. 3A, the hydrodynamic diameter was ∼225 nm, in good accordance with that recorded by SEM and TEM. In addition, XRD was used to know more about the crystalline structure of Ag@C NFSs. The main Bragg peaks shown in Fig. 3B could completely match the standard face-centered cubic crystal of Ag (PDF card JCPDS no. 87-0597). The atomic ratio of Ag to C within Ag@C NFSs was measured to be 26.89 and 69.41, respectively, by EDS (Fig. 3C). According to the FT-IR spectrum of Ag@C NFSs (Fig. 3D), the wavelengths at 1647, 1773 and 2900 cm−1 belonged to the vibrations of C![[double bond, length as m-dash]](https://www.rsc.org/images/entities/char_e001.gif) C, C
C, C![[double bond, length as m-dash]](https://www.rsc.org/images/entities/char_e001.gif) O and C–H groups, respectively.28,31 The absorption bands in the range of 3300 cm−1 to 3500 cm−1 were attributed to the O–H stretching vibration.32 The form of carbon in Ag@C NFSs was further investigated using Raman spectroscopy. As shown in Fig. 3E, two characteristic peaks located at 1356 cm−1 and 1584 cm−1 could be easily seen that corresponded to the D band and G band, respectively, indicative of two forms of carbon existing within Ag@C NFSs: the disordered amorphous carbon and the crystalline graphite carbon.33 Here, the prominent G band means that the as-formed carbon shell was mainly composed of highly graphitized ordered carbon, which contributes to the fast electron transfer over the electrode. Through the ultraviolet absorption spectrum, it could be clearly seen that the absorption of Ag@C NCs happened at 420 nm, while the absorption of Ag@C NFSs happened at 351 nm and 388 nm. The observations were consistent with the respective characteristic UV-vis absorption peaks previously reported.31,34
O and C–H groups, respectively.28,31 The absorption bands in the range of 3300 cm−1 to 3500 cm−1 were attributed to the O–H stretching vibration.32 The form of carbon in Ag@C NFSs was further investigated using Raman spectroscopy. As shown in Fig. 3E, two characteristic peaks located at 1356 cm−1 and 1584 cm−1 could be easily seen that corresponded to the D band and G band, respectively, indicative of two forms of carbon existing within Ag@C NFSs: the disordered amorphous carbon and the crystalline graphite carbon.33 Here, the prominent G band means that the as-formed carbon shell was mainly composed of highly graphitized ordered carbon, which contributes to the fast electron transfer over the electrode. Through the ultraviolet absorption spectrum, it could be clearly seen that the absorption of Ag@C NCs happened at 420 nm, while the absorption of Ag@C NFSs happened at 351 nm and 388 nm. The observations were consistent with the respective characteristic UV-vis absorption peaks previously reported.31,34
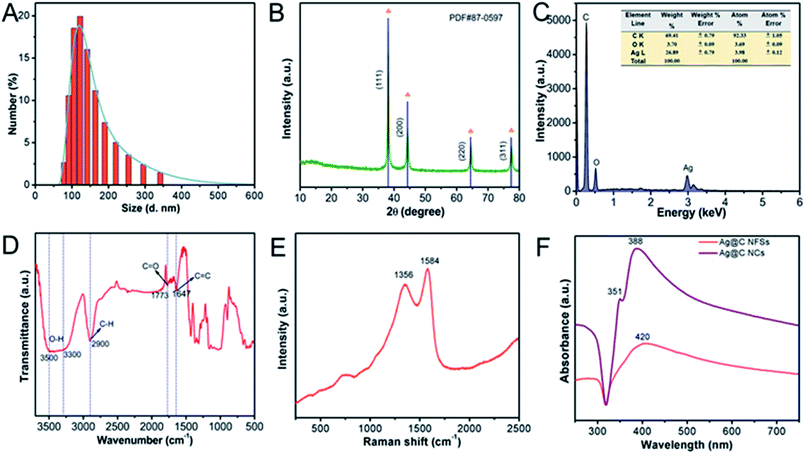 |
| | Fig. 3 (A) Hydrodynamic diameter of Ag@C NFSs. (B) XRD pattern of Ag@C NFSs. (C) The EDS of Ag@C NFSs. (D) FT-IR spectra of Ag@C NFSs. (E) Raman spectrum of Ag@C NFSs. (F) UV-vis absorbance spectra of Ag@C NFSs and Ag@C NCs. | |
3.2. The electrochemical behaviors of the Ag@C NFS modified electrode
Both the electrochemical impedance spectroscopy (EIS) and cyclic voltammetry (CV) behaviours of the Ag@C NFS modified electrode (Ag@C NFSs/GCE) were examined by comparison with that of the Ag@C NC modified GCE (Ag@C NCs/GCE). As depicted in Fig. 4A and B, Ag@C NFSs as a substrate material exhibited obviously better electrochemical performances through showing a smaller circle diameter of EIS and higher CV peak current than Ag@C NCs, which might be because of the significant difference in their morphology and structure. The frogspawn-like structure endowed Ag@C NFSs with a larger surface area and different crystal structure from Ag@C NCs, which likely contributed to the improved electrochemical behaviours of Ag@C NFSs/GCE. Additionally, a slight peak potential shift was observed after electrode modifications. The possible reason might be ascribed to the formation of different double electric layers on the electrode surfaces modified with different materials which might cause different over-potential of the electrochemical reaction.
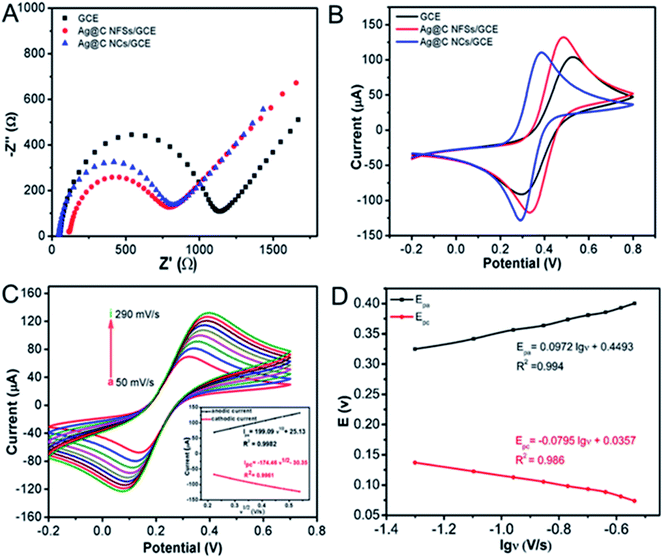 |
| | Fig. 4 (A) EIS and (B) CV curves of bare GCE, Ag@C NFSs/GCE and Ag@C NCs/GCE recorded under the same conditions. (C) Influence of scan rate on the electrochemical responses of Ag@C NFSs/GCE in 5 mM [Fe(CN)6]3−/4− in the scanning potential range of −0.2 to 0.6 V. Scan rates were set at 50, 80, 110, 140, 170, 200, 230, 260 and 290 mV s−1 (from a to i), respectively (inset: linear relationship of Ipa (black line) and Ipc (red line) versus v1/2). (D) The relationship between peak potentials (Epc and Epa) and lg![[thin space (1/6-em)]](https://www.rsc.org/images/entities/char_2009.gif) ν. ν. | |
In addition, the relationship between peak currents and different scan rates was systematically studied to determine the electroactive surface area of Ag@C NFSs/GCE, as shown in Fig. 4C. Obviously, the redox peak currents (I) were proportional to the square root of scan rates (v1/2) in the range of scan rate from 50 mV s−1 to 290 mV s−1. The regression equations of both anodic (Ipa) and cathodic (Ipc) peaks were Ipa = 199.09v1/2 + 25.13 and Ipc = −174.46v1/2 − 30.35, respectively, indicating that the redox reaction was controlled by diffusion.35 Generally, the electro-active surface area of the modified electrode can be calculated according to the Randles–Sevcik equation I = 2.69 × 10⁵A × D1/2n3/2v1/2C,36 where n is the number of electrons transferred in the redox reaction (n = 1), A is the electrode electrochemical active area, D is the diffusion coefficient (6.70 × 10⁻⁶ cm2 s−1, 25 °C), C is the concentration of the reactant (5 × 10⁻³ mol L−1 Fe(CN)63−/4−), v is the scan rate (V s−1) and I is the peak current (μA) of the CV measurement. Here, the electro-active surface area of Ag@C NFSs/GCE was calculated to be 0.0827 cm2, 1.17 times higher than the initial surface area of the bare GCE (d = 3 mm, 0.0707 cm2), suggesting that Ag@C NFSs would greatly enlarge the surface area of the modified electrode, leading to remarkably accelerated electron transfer on the electrode surface. Moreover, the electron transfer rate constant (ks) was also used to investigate the electrical conductivity of the Ag@C NFS modified electrode. Fig. 4D shows the relationship between peak potentials (Epa and Epc) and denary logarithm of scan rate (lg![[thin space (1/6-em)]](https://www.rsc.org/images/entities/char_2009.gif) ν), where both Epa and Epc were linearly related to lg
ν), where both Epa and Epc were linearly related to lg![[thin space (1/6-em)]](https://www.rsc.org/images/entities/char_2009.gif) ν with two linear regression equations for the redox peaks achieved as follows: Epa = 0.9972
ν with two linear regression equations for the redox peaks achieved as follows: Epa = 0.9972![[thin space (1/6-em)]](https://www.rsc.org/images/entities/char_2009.gif) lg
lg![[thin space (1/6-em)]](https://www.rsc.org/images/entities/char_2009.gif) ν + 0.4493 and Epc = −0.0795
ν + 0.4493 and Epc = −0.0795![[thin space (1/6-em)]](https://www.rsc.org/images/entities/char_2009.gif) lg
lg![[thin space (1/6-em)]](https://www.rsc.org/images/entities/char_2009.gif) ν + 0.0357, respectively. The ks was calculated based on the following Laviron equations:37
ν + 0.0357, respectively. The ks was calculated based on the following Laviron equations:37
| |
 | (1) |
| |
 | (2) |
where
ka and
kc are the slopes of
Epa versus lg
![[thin space (1/6-em)]](https://www.rsc.org/images/entities/char_2009.gif) ν
ν and
Epc versus lg
![[thin space (1/6-em)]](https://www.rsc.org/images/entities/char_2009.gif) ν
ν, respectively,
α is the charge-transfer coefficient,
R is Faraday constant,
n is the apparent number of electrons transferred,
v is the scan rate,
T is room temperature and Δ
Ep is the potential difference of the redox peaks. The final value of
ks was estimated to be 1.07 s
−1, much higher than that (0.584 s
−1) of the previously reported silver nanowire–polyaniline nanocomposite based electrochemical sensor, further verifying the greatly improved electron transfer behavior of Ag@C NFSs/GCE.
38
3.3. Biocompatibility of Ag@C NFSs
The biocompatibility of Ag@C NFSs plays a crucial role in the construction of the electrochemical immunosensor, so the hydrophilicity, cytotoxicity and stability of the obtained nanocomposites were investigated to assess the biocompatibility. Fig. 5A and B show the contact angles of Ag@C NFSs and Ag@C NCs before and after the immobilization of Ab. Cleary, the contact angle of Ag@C NFSs was about 32° lower than that of Ag@C NCs, revealing the obviously better hydrophilicity of Ag@C NFSs. After the incubation with Ab, the contact angle of Ag@C NFSs greatly decreased to ∼15°, while the Ag@C NCs still showed a contact angle as high as 54°, further verifying the excellent hydrophilicity of Ag@C NFSs favorable for immobilizing biomolecules. Moreover, the cytotoxicities of both Ag@C NFSs and Ag@C NCs were carefully examined using cancer cells, 4T1 cells (Fig. 5D). After the incubation of 4T1 cells with the Ag@C NFS and Ag@C NC suspensions at various concentrations (12.5, 25, 50, 100, and 200 μg mL−1) for 24 h, the cell viability was measured to be above 90% for Ag@C NFSs by the Cell Counting Kit-8 (CCK-8) method within the set concentration range of Ag@C NFSs, suggesting no obvious cytotoxicity of the Ag@C NFSs toward 4T1 cells, while the Ag@C NCs demonstrated relatively poor biocompatibility (Fig. 5E). Moreover, the remarkable stability of Ag@C NFSs against the tested media was observed. As shown in Fig. 5C and F, Ag@C NFSs exhibited excellent dispersity in aqueous solution as no sedimentation was seen after standing for 30 min, while obvious stratification was observed in the Ag@C NC aqueous solution. All the results clearly confirmed the favorable biocompatibility of the obtained Ag@C NFSs preffered for the fabrication of the immunosensor. Thereby, the Ag@C NFSs were selected to fabricate the subsequent electrochemical immunosensing platform for CEA detection.
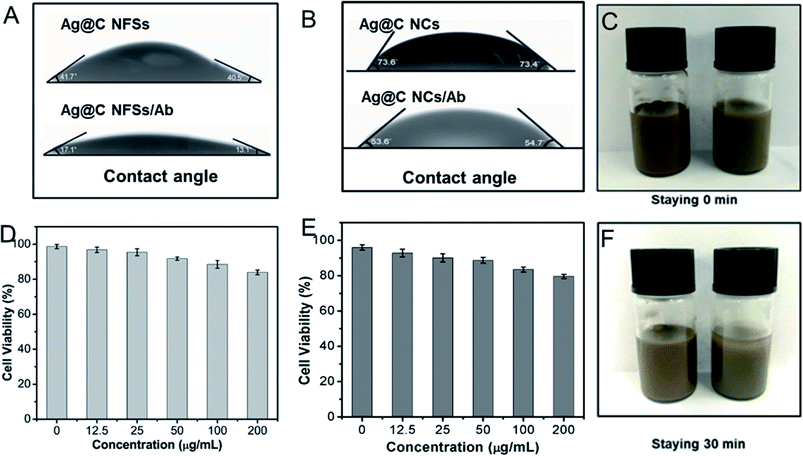 |
| | Fig. 5 Contact angles of (A) Ag@C NFSs and (B) Ag@C NCs before and after being modified with anti-CEA. Relative viabilities of 4T1 cells incubated with Ag@C NFSs and Ag@C NCs (D) at various concentrations (12.5, 25, 50, 100, and 200 μg mL−1) for 24 h. (D and E) Photographic images of Ag@C NFSs (left) and Ag@C NCs (right) dissolved in water at different standing times (C and F). | |
3.4. Fabrication of the Ag@C NFS-based immunosensor
CV was commonly adopted to investigate the electrode interface properties of the immunosensor during the preparation process. Fig. 6A illustrates the CV plots during the preparation of the Ag@C NFS-based immunosensors. Compared with the bare GCE the modification of Ag@C NFSs greatly improved the current response signal of the electrode; this might benefit from the unique 3D frogspawn-like structure of the Ag@C nanocomposite with a large conductive specific area and the synergistic effect of silver cores and graphite carbon. Although the successive immobilization of Ab, BSA and CEA weakened the current of the modified electrode due to the introduction of non-conductive protein molecules blocking the electron-transfer process of the probe, the current was still high enough for the following CEA detection. On the other hand, the results confirm the successful construction of the Ag@C NFS-based immunosensors to detect CEA.
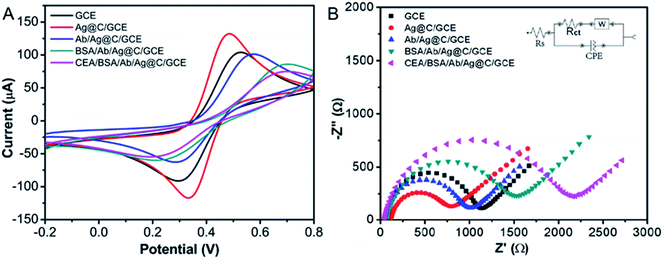 |
| | Fig. 6 (A) CV curves and (B) Nyquist diagram of AC impedance of bare GCE, Ag@C NFSs/GCE, Ab/Ag@C NFSs/GCE, BSA/Ab/Ag@C NFSs/GCE, and CEA/BSA/Ab/Ag@C NFSs/GCE by using 5.0 mM [Fe(CN)6]3−/4− as an electrochemical indicator, respectively. | |
Meanwhile, the Nyquist diagram of AC impedance spectroscopy was also used to confirm the stepwise modification process of the Ag@C NFS-based immunosensor (Fig. 6B). In general, the Nyquist diagram is made of a linear portion and semicircular portion which correspond to the diffusion process and the electron transfer resistance (Rct), respectively. As seen in Fig. 6B, the bare GCE showed a very small semicircle, while the semicircle diameter clearly decreased when the Ag@C NFSs were dropped onto the spotless GCE surface by virtue of the good electron transfer behavior of Ag@C NFSs. Subsequently, the semicircle domain was increased in sequence with the successive modification of Ab and BSA, indicating the successful immobilization of non-conductive biomolecules onto the electrode. The largest semicircle diameter appeared after the incubation of CEA with the above modified electrode, revealing the successful specific recognition between Ab and CEA. The model of the Randles equivalent circuit, which consists of the resistance of solution (Rs), the charge-transfer resistance (Rct), the Warburg impedance (W), and the double layer capacitance (CPE), was fitted as shown in Fig. 6B (inset). Moreover, the corresponding values of stepwise modification were simulated with the aid of ZSimpwin software and are listed in Table 1. Obviously, the variation rule of Rct was consistent with the changes of the semicircle domain, indicative of the effective fabrication of the proposed Ag@C NFS-based electrochemical immunosensor for CEA detection.
Table 1 Simulation parameters of the equivalent circuit components
| Electrode |
Rs (Ω) |
Rct (Ω) |
Cdl |
Zw |
| GCE |
54.8 |
1030 |
1.2676 × 10⁻⁶ |
0.001416 |
| Ag@C NFSs/GCE |
11.3 |
669 |
2.6506 × 10⁻⁶ |
0.001083 |
| Ab1/Ag@C NFSs/GCE |
51.3 |
903 |
1.4113 × 10⁻⁶ |
0.001562 |
| BSA/Ab1/Ag@C NFSs/GCE |
70.3 |
1360 |
2.6766 × 10⁻⁶ |
0.001038 |
| CEA/BSA/Ab1/Ag@C NFSs/GCE |
45.7 |
1790 |
1.9889 × 10⁻⁶ |
0.001349 |
3.5. Optimization of the experimental conditions
The optimum working condition of the immunosensor is crucial to sensitive CEA detection. Thus, the experimental conditions of the Ag@C NFS-based immunosensor were optimized by differential pulse voltammetry (DPV), including the incubation time and temperature of CEA with Ab, the pH of PBS and the concentrations of Ag@C NFSs. The effect of incubation time of Ab with CEA on the electrochemical performance of the Ag@C NFS-based immunosensor was first studied. Fig. 7A shows that the peak current of the prepared immunosensor increased with the time increasing from 10 to 30 min and went down after 30 min. Thus, 30 min was selected as the optimal incubation time between Ab and Ag. In the optimum incubation period, the optimum incubation temperature was investigated in the range of 20–50 °C (Fig. 7B). Clearly the highest peak current appeared at 37 °C, preferred for the specific interaction between Ab and Ag. A temperature lower or higher than 37 °C was not good to maintain the biological activity of protein molecules. Therefore, the optimal incubation temperature was set at 37 °C for the interaction between Ab and Ag. In addition, the acidity of aqueous buffer influences the biological activity of protein molecules as well,39 so the effect of pH on the current response of the Ag@C NFS-based immunosensor toward CEA was also optimized. As demonstrated in Fig. 7C, within the pH range of 6.4–8.0 in PBS solution, the current signal increased with pH increasing until 7.2 and irreversibly dropped afterwards as the alkalinity increased constantly. The maximum signal response showed up at pH 7.2 which was very close to the physiological pH of the human body, favorable for the binding interaction. Therefore, the PBS solution at pH 7.2 was chosen as the detection medium of CEA. Ag@C NFSs are another unneglectable important factor and majorly contributed to the immunosensing performance of the prepared immunosensor, so the concentration of Ag@C NFSs ranging from 1 mg mL−1 to 3.5 mg mL−1 was optimized to receive the best response signal to CEA detection. As shown in Fig. 7D, when the Ag@C NFS concentration increased, the response current went up dramatically and reached the highest at 3.5 mg mL−1, but went down with the concentration exceeding 3.5 mg mL−1. The increase of Ag@C NFS concentration not only improved the electrode conductivity but also boosted the affinity binding between Ab and Ag;27,40 however, when too many Ag@C NFSs were dropped on the electrode surface, the composite layer was too thick to facilitate electron transfer and efficient specific interaction between Ab and CEA. Hence, 3.5 mg mL−1 was used as the most appropriate concentration of Ag@C NFS to fabricate the immunosensor.
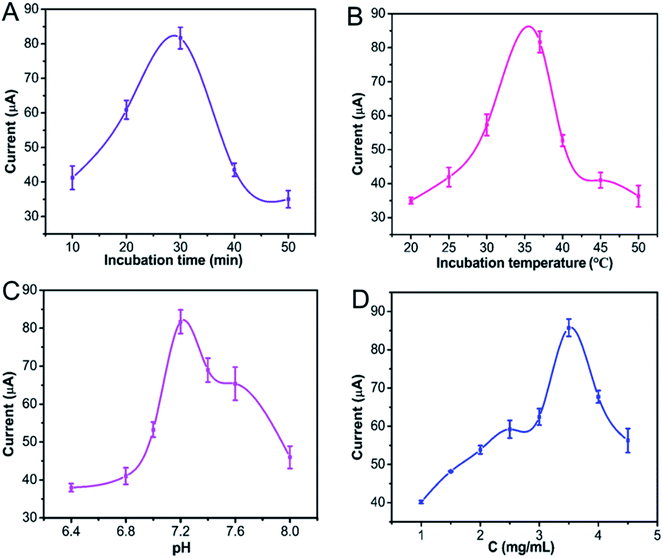 |
| | Fig. 7 Effects of (A) the incubation time, (B) incubation temperature, (C) pH of PBS and (D) Ag@C NFS concentration on the current response of the Ag@C NFS-based immunosensor. Error bar refers to the relative standard deviation (RSD, n = 3). | |
3.6. Analytical performance of the Ag@C NFS-based immunosensor
In order to assess the detection performance of the as-prepared immunosensor, a series of different CEA concentrations were detected using the Ag@C NFS-based immunosensor by DPV under the optimal experimental conditions. Fig. 8A shows the DPV curves for the detection of CEA at concentrations ranging from 0.1 pg mL−1 to 100 ng mL−1, where the current signal was found to decrease gradually with the increase of the CEA concentration. The linear equation of the Ag@C NFS-based immunosensor toward CEA detection was y = −6.6743![[thin space (1/6-em)]](https://www.rsc.org/images/entities/char_2009.gif) lg
lg![[thin space (1/6-em)]](https://www.rsc.org/images/entities/char_2009.gif) c + 66.9988 (R2 = 0.996 with the limit of detection (LOD) calculated to be 5.12 pg mL−1 (signal to noise ratio = 3), much lower than many existing ones). Given its wide linear range and low LOD, it is of great potential to detect CEA in the early clinical diagnosis of tumors. Upon comparison with some previously reported noble metal-based CEA immunoassays (Table 2), the proposed Ag@C NFS-based electrochemical immunosensor exhibited a significantly lower LOD and superior sensitivity for the detection of CEA.
c + 66.9988 (R2 = 0.996 with the limit of detection (LOD) calculated to be 5.12 pg mL−1 (signal to noise ratio = 3), much lower than many existing ones). Given its wide linear range and low LOD, it is of great potential to detect CEA in the early clinical diagnosis of tumors. Upon comparison with some previously reported noble metal-based CEA immunoassays (Table 2), the proposed Ag@C NFS-based electrochemical immunosensor exhibited a significantly lower LOD and superior sensitivity for the detection of CEA.
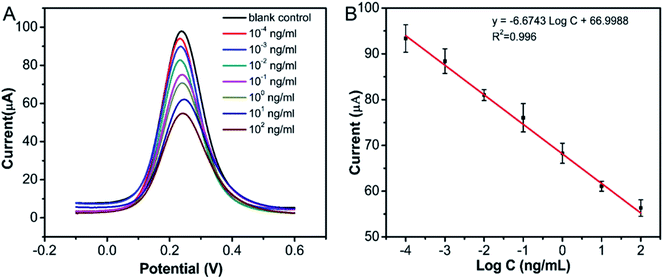 |
| | Fig. 8 (A) DPVs and (B) calibration curve obtained by detecting CEA at different concentrations with the proposed Ag@C NFS-based electrochemical immunosensor. Error bar = RSD (n = 3). | |
Table 2 Comparison of the analytical performance of the proposed Ag@C NFS-based electrochemical immunosensor with other existing immunosensors for the detection of CEAa
| Immunosensor |
Line range (ng mL−1) |
LOD (ng mL−1) |
Reference |
| NS: nanosheet; MWCNTs: multi walled carbon nanotubes; NCMTs: nitrogen-doped magnetic carbon microtubes; PB: Prussian blue; PS NSs: polystyrene nanospheres; NC: nitidine chloride. |
| Au–TiO2 film |
0.2–160 |
0.06 |
41 |
| g-C3N4 NS |
0.1–150 |
0.06 |
42 |
| rGO |
0.1–5 |
0.05 |
43 |
| Au NPs–MWCNTs |
0.4–125 |
0.09 |
44 |
| GO/MWCNTs–COOH/Au@CeO2 |
0.05–100 |
0.02 |
45 |
| NCMTs@Fe3O4@Cu silicate |
0.03–6 |
0.00538 |
46 |
| Fe3O4@Au NPs |
0.001–100 |
0.01 |
19 |
| Au@CeBi0.4O3.7 |
0.01–100 |
0.00012 |
47 |
| Au-PB |
0.005–50 |
0.0033 |
48 |
| Pt NPs@rGO@PS NSs |
0.05–70 |
0.01 |
49 |
| AuNPs/PB-PEDOT |
0.05–40 |
0.01 |
50 |
| Silicon nanoribbon |
0.01–100 |
0.01 |
51 |
| BSA–NC–rGO |
0.01–200 |
0.067 |
52 |
| Ag@C NFSs |
0.0001–100 |
0.00512 |
This work |
3.7. Selectivity, reproducibility and stability
In order to assess the reproducibility of the immunosensor, five immunosensors were constructed to detect 10 ng mL−1 CEA. As shown in Fig. 9A, the current responses of the five replicative immunosensors were basically the same and the RSD was less than 5%, exhibiting the good reproducibility of the proposed immunosensor. In addition, the stability also affects the detection performance of the immunosensor. As shown in Fig. 9B and C, after the immunosensor was incubated with 0.01 ng mL−1 CEA, the current fluctuation was less than 5% within the successive CV scans of 30 cycles, proving that the proposed Ag@C NFS-based immunosensor had an acceptable short-term stability. Additionally, the long-term storage stability of the Ag@C NFS-based immunosensor was further investigated after storage at 4 °C. As demonstrated in Fig. 9D, the current still retained 86.6% after 10 days, indicative of a desirable long-term storage stability. At the same time, the selectivity of the immunosensor is vital to detect the target marker accurately. To probe into the selectivity of the proposed immunosensor toward the detection of 10 ng mL−1 CEA, five interferences of BAS, AFP, IgG and PSA at 10 ng mL−1 were chosen as co-existing interferents. Among the five groups, group 1 was CEA only at 10 ng mL−1, and the other four groups were 10 ng mL−1 CEA containing 10 ng mL−1 interferences, respectively. Fig. 9E shows that the current signal of the proposed immunosensor was not obviously interfered proteins, revealing that the Ag@C NFS-based immunosensor possessed an admirable specificity for CEA detection.
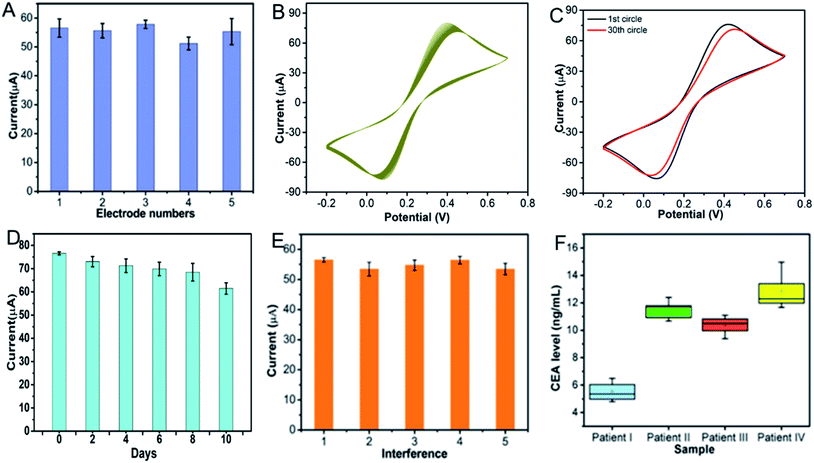 |
| | Fig. 9 (A) Reproducibility and (B–C) short-term and (D) long-term stabilities of the proposed Ag@C NFS-based immunosensors. (E) Influence of various interfering proteins on the current responses of the proposed immunosensor toward CEA. (Groups 1–5 refer to 10 ng mL−1 CEA, 10 ng mL−1 CEA + 10 ng mL−1 BSA, 10 ng mL−1 CEA + 10 ng mL−1 AFP, 10 ng mL−1 CEA + 10 ng mL−1 IgG and 10 ng mL−1 CEA + 10 ng mL−1 PSA, respectively.) Error bar = RSD (n = 3). (F) The original CEA levels in blood samples from four cancerous patients detected with the proposed Ag@C NFS-based immunosensors. | |
3.8. Real sample analysis
Given its brilliant performance, the newly proposed Ag@C NFS-based immunosensor was used to determine the CEA level in cancerous human serum samples in order to explore its practical application. Here, four blood samples from four cancer patients (I–IV) were detected as shown in Fig. 9F. Obviously, the detected CEA levels in the blood samples from these four patients were much higher than the normal values and in good accordance with that measured by radionuclide methods, as illustrated in Table 3. Additionally, the standard addition method was also used to evaluate the practicability of the proposed immunosensor. Three CEA concentrations of 2.5, 5 and 10 ng mL−1 were added in the four serum samples, respectively with a recovery rate over 90% and up to 109.2%. These results are further proof of the superb practical feasibility of the label-free immunosensor using the Ag@C NFSs as an electrochemical immunosensing platform.
Table 3 Human serum sample analysis using the proposed method and the radionuclide method
| Content of CEA in the serum (ng mL−1) |
The addition content (ng mL−1) |
The detection content (ng mL−1) |
Radionuclide method (ng mL−1) |
Recovery (%) |
| Patient I |
— |
5.36 |
5.41 |
— |
| 2.5 |
8.12 |
— |
108.4 |
| 5 |
10.28 |
— |
97.4 |
| 10 |
14.69 |
— |
92.8 |
| Patient II |
— |
11.36 |
11.7 |
— |
| 2.5 |
13.96 |
— |
90.4 |
| 5 |
16.48 |
— |
95.6 |
| 10 |
22.31 |
— |
106.1 |
| Patient III |
— |
10.76 |
10.82 |
— |
| 2.5 |
13.49 |
— |
106.8 |
| 5 |
15.93 |
— |
102.2 |
| 10 |
20.68 |
— |
98.6 |
| Patient IV |
— |
15.21 |
14.96 |
— |
| 2.5 |
17.69 |
— |
109.2 |
| 5 |
20.21 |
— |
105 |
| 10 |
25.18 |
— |
102.2 |
4. Conclusion
In summary, a convenient and effective label-free immunosensor was established for the detection of CEA in clinical samples with the newly prepared frogspawn-like Ag@C nanocomposites prepared by the one-pot reaction of AgNO3, CTAB and AA. Compared with the prepared Ag@C NCs, the as-prepared Ag@C NFSs exhibited a larger surface area, faster electron transfer rate and better biocompatibility owing to the different crystal structure and synergistic effect of silver and nanocarbon, which is preferred for the fabrication of electrochemical immunosensors. Using the Ag@C NFSs to capture anti-CEA, the resultant immunosensing platform demonstrated excellent analytical performance for CEA detection in a wide CEA concentration range with a fairly low LOD. With high reproducibility, good stability and preferable interference immunity, the CEA levels in four blood samples from four cancer patients were accurately determined with the proposed method which were highly consistent with that obtained by the radionuclide method, implying its great potential in practical application for early clinical cancer diagnosis. Overall, this simple label-free immunosensor may be considered as a promising alternative to detect other biomarkers in early clinical diagnosis.
Conflicts of interest
There are no conflicts to declare.
Acknowledgements
This work was financially supported by the Natural Science Foundation of Shanghai (19ZR1434800, 19ZR1461900). The authors greatly appreciate the support.
References
- Q. Q. Yan, L. Wang, F. X. Song, Y. J. Zhang, L. Gao, F. J. Liu and Y. X. Shi, J. Mater. Res., 2020, 35, 591–599 CrossRef CAS.
- P. A. Crosbie, R. Gabe, I. Simmonds, M. Kennedy, S. Rogerson, N. Ahmed, D. R. Baldwin, R. Booton, A. Cochrane, M. Darby, K. Franks, S. Hinde, S. M. Janes, U. Macleod, M. Messenger, H. Moller, R. L. Murray, R. D. Neal, S. L. Quaife, M. Sculpher, P. Tharmanathan, D. Torgerson and M. E. Callister, BMJ Open, 2020, 10, e037075 CrossRef PubMed.
- M. N. Fadhel, S. Appak Baskoy, Y. Wang, E. Hysi and M. C. Kolios, J. Biophotonics, 2020, e202000209 Search PubMed.
- D. Wu, H. Ma, Y. Zhang, H. Jia, T. Yan and Q. Wei, ACS Appl. Mater. Interfaces, 2015, 7, 18786–18793 CrossRef CAS PubMed.
- X. Zhang, Y. Li, H. Lv, Z. Gao, C. Zhang, S. Zhang, Y. Wang, Z. Xu and Z. Zhao, J. Electrochem. Soc., 2018, 165, B931–B938 CrossRef CAS.
- Y. Chen, A. J. Wang, P. X. Yuan, X. Luo, Y. Xue and J. J. Feng, Biosens. Bioelectron., 2019, 132, 294–301 CrossRef CAS PubMed.
- C. Zhang, S. Zhang, Y. Jia, Y. Li, P. Wang, Q. Liu, Z. Xu, X. Li and Y. Dong, Biosens. Bioelectron., 2019, 126, 785–791 CrossRef CAS PubMed.
- N. L. Li, L. P. Jia, R. N. Ma, W. L. Jia, Y. Y. Lu, S. S. Shi and H. S. Wang, Biosens. Bioelectron., 2017, 89, 453–460 CrossRef CAS PubMed.
- H. Yan, L. Jiao, H. Wang, W. Xu, Y. Wu, W. Gu, D. Du, Y. Lin and C. Zhu, Sens. Actuators, B, 2019, 297, 126760 CrossRef CAS.
- Q. Han, R. Wang, B. Xing, T. Zhang, M. S. Khan, D. Wu and Q. Wei, Biosens. Bioelectron., 2018, 99, 493–499 CrossRef CAS PubMed.
- E. Tan, N. Gouvas, R. J. Nicholls, P. Ziprin, E. Xynos and P. P. Tekkis, Surg. Oncol., 2009, 18, 15–24 CrossRef PubMed.
- Y. Jia, Y. Li, S. Zhang, P. Wang, Q. Liu and Y. Dong, Biosens. Bioelectron., 2020, 149, 111842 CrossRef CAS PubMed.
- D. Song, J. Zheng, N. V. Myung, J. Xu and M. Zhang, Talanta, 2021, 225, 122006 CrossRef CAS PubMed.
- S. H. Shamsuddin, T. D. Gibson, D. C. Tomlinson, M. J. McPherson, D. G. Jayne and P. A. Millner, Biosens. Bioelectron., 2021, 178, 113013 CrossRef CAS PubMed.
- H. Q. Wang and Z. F. Ma, Biosens. Bioelectron., 2020, 169, 112644 CrossRef CAS PubMed.
- W. J. Li, Y. Yang, C. Y. Ma, Y. J. Song, X. W. Qiao and C. L. Hong, Talanta, 2020, 219, 121322 CrossRef CAS PubMed.
- Y. Song, K. Cao, W. Li, C. Ma, X. Qiao, H. Li and C. Hong, Microchem. J., 2020, 155, 104694 CrossRef CAS.
- F. Li, Y. Li, Y. Dong, L. Jiang, P. Wang, Q. Liu, H. Liu and Q. Wei, Sci. Rep., 2016, 6, 21281 CrossRef CAS PubMed.
- P. Butmee, G. Tumcharern, G. Thouand, K. Kalcher and A. Samphao, Bioelectrochemistry, 2020, 132, 107452 CrossRef CAS PubMed.
- S. Xu, R. L. Zhang, W. Zhao, Y. Zhu, W. Wei, X. Y. Liu and J. Luo, Biosens. Bioelectron., 2017, 92, 570–576 CrossRef CAS PubMed.
- A. L. Sun, Q. A. Qi and Z. L. Dong, Protein Pept. Lett., 2008, 15, 782–788 CrossRef CAS PubMed.
- M. Rizwan, S. Elma, S. A. Lim and M. U. Ahmed, Biosens. Bioelectron., 2018, 107, 211–217 CrossRef CAS PubMed.
- W. Li, X. Qiao, C. Hong, C. Ma and Y. Song, Anal. Biochem., 2020, 592, 113566 CrossRef CAS PubMed.
- J. Duan, L. Bai, K. Xu, Q. Fang, Y. Sun, H. Xu, K. C.-F. Leung and S. Xuan, J. Hazard. Mater., 2020, 384, 121276 CrossRef CAS PubMed.
- Y. Wang, D. Fan, D. Wu, Y. Zhang, H. Ma, B. Du and Q. Wei, Sens. Actuators, B, 2016, 236, 241–248 CrossRef CAS.
- C. J. Mao, X. B. Chen, H. L. Niu, J. M. Song, S. Y. Zhang and R. J. Cui, Biosens. Bioelectron., 2012, 31, 544–547 CrossRef CAS PubMed.
- F. Li, J. Feng, Z. Gao, L. Shi, D. Wu, B. Du and Q. Wei, ACS Appl. Mater. Interfaces, 2019, 11, 8945–8953 CrossRef CAS PubMed.
- W. Zhang, L. Hao, Q. Lin, C. Lu, Z. Xu and X. Chen, Mater. Sci. Eng., B, 2014, 190, 1–6 CrossRef CAS.
- X. Liu, C. Chen, H. Ye, Y. Jia, Y. Wu, A. Jin, Y. Wang and X. Chen, Carbon, 2018, 131, 213–222 CrossRef CAS.
- H. Niu, X. Wu, M. Qiu, Y. Gao, J. Song, C. Mao, S. Zhang, H. Liu and J. Wu, J. Mater. Res., 2011, 26, 2780–2794 CrossRef CAS.
- X. M. Sun and Y. D. Li, Langmuir, 2005, 21, 6019–6024 CrossRef CAS PubMed.
- Z. Chen, M. Niu, G. Chen, Q. Wu, L. Tan, C. Fu, X. Ren, H. Zhong, K. Xu and X. Meng, ACS Nano, 2018, 12, 12721–12732 CrossRef CAS PubMed.
- S. A. Nakhjavani, H. Afsharan, B. Khalilzadeh, M. H. Ghahremani, S. Carrara and Y. Omidi, Biosens. Bioelectron., 2019, 141, 111439 CrossRef PubMed.
- L. Yan, Y. Hao, X. Feng, Y. Yang, X. Liu, Y. Chen and B. Xu, RSC Adv., 2015, 5, 79860–79867 RSC.
- Z. Wang, X. Tian, D. Sun, P. Cao, M. Ding, Y. Li, N. Guo, R. Ouyang and Y. Miao, RSC Adv., 2020, 10, 15870–15880 RSC.
- J. Xue, L. Yang, Y. Jia, H. Wang, N. Zhang, X. Ren, H. Ma, Q. Wei and H. Ju, ACS Sens., 2019, 4, 2825–2831 CrossRef CAS PubMed.
- P. Wang, F. Pei, E. Ma, Q. Yang, H. Yu, J. Liu, Y. Li, Q. Liu, Y. Dong and H. Zhu, Bioelectrochemistry, 2020, 131, 107352 CrossRef CAS PubMed.
- Z. Chao, S. Govindaraju, K. Giribabu, Y. S. Huh and K. Yun, Sens. Actuators, B, 2017, 252, 616–623 CrossRef.
- J. Miao, K. Du, X. Li, X. Xu, X. Dong, J. Fang, W. Cao and Q. Wei, Biosens. Bioelectron., 2021, 171, 112713 CrossRef CAS PubMed.
- Y. Chen, L. P. Mei, J. J. Feng, P. X. Yuan, X. Luo and A. J. Wang, Biosens. Bioelectron., 2019, 145, 111638 CrossRef CAS PubMed.
- Y. Zhang, R. Yuan, Y. Chai, Y. Xiang, X. Qian and H. Zhang, J. Colloid Interface Sci., 2010, 348, 108–113 CrossRef CAS PubMed.
- K. L. Lin, T. Yang, H. Y. Zou, Y. F. Li and C. Z. Huang, Talanta, 2019, 192, 400–406 CrossRef CAS PubMed.
- M. Jozghorbani, M. Fathi, S. H. Kazemi and N. Alinejadian, Anal. Biochem., 2020, 613, 114017 CrossRef PubMed.
- G. Paimard, M. Shahlaei, P. Moradipour, H. Akbari, M. Jafari and E. Arkan, Sens. Actuators, B, 2020, 311, 127928 CrossRef CAS.
- X. Pang, J. Li, Y. Zhao, D. Wu, Y. Zhang, B. Du, H. Ma and Q. Wei, ACS Appl. Mater. Interfaces, 2015, 7, 19260–19267 CrossRef CAS PubMed.
- J. Zheng, J. Wang, D. Song, J. Xu and M. Zhang, ACS Appl. Nano Mater., 2020, 3, 3449–3458 CrossRef CAS.
- X. Tian, P. Cao, D. Sun, Z. Wang, M. Dinga, X. Yang, Y. Li, R. Ouyang and Y. Miao, Appl. Surf. Sci., 2020, 528, 146956 CrossRef CAS.
- J. Lin, K. Y. Li, M. F. Wang, X. H. Chen, J. Y. Liu and H. L. Tang, RSC Adv., 2020, 10, 38316–38322 RSC.
- Q. C. Lan, C. L. Ren, A. Lambert, G. S. Zhang, J. Li, Q. Cheng, X. Y. Hu and Z. J. Yang, ACS Sustainable Chem. Eng., 2020, 8, 4392–4399 CrossRef CAS.
- T. T. Yang, Y. S. Gao, Z. Liu, J. K. Xu, L. M. Lu and Y. F. Yu, Sens. Actuators, B, 2017, 239, 76–84 CrossRef CAS.
- Z. T. Bao, J. L. Sun, X. Q. Zhao, Z. Y. Li, S. K. Cui, Q. Y. Meng, Y. Zhang, T. Wang and Y. F. Jiang, Int. J. Nanomed., 2017, 12, 4623–4631 CrossRef CAS PubMed.
- Y. Li, Z. Zhang, Y. T. Zhang, D. M. Deng, L. Q. Luo, B. S. Han and C. H. Fan, Biosens. Bioelectron., 2016, 79, 536–542 CrossRef CAS PubMed.
Footnote |
| † M. Ding and L. Zha contributed equally to this work. |
|
| This journal is © The Royal Society of Chemistry 2021 |
Click here to see how this site uses Cookies. View our privacy policy here.  Open Access Article
 *a and
Yuqing Miaoa


![[double bond, length as m-dash]](https://www.rsc.org/images/entities/char_e001.gif) C, C
C, C![[double bond, length as m-dash]](https://www.rsc.org/images/entities/char_e001.gif) O and C–H groups, respectively.28,31 The absorption bands in the range of 3300 cm−1 to 3500 cm−1 were attributed to the O–H stretching vibration.32 The form of carbon in Ag@C NFSs was further investigated using Raman spectroscopy. As shown in Fig. 3E, two characteristic peaks located at 1356 cm−1 and 1584 cm−1 could be easily seen that corresponded to the D band and G band, respectively, indicative of two forms of carbon existing within Ag@C NFSs: the disordered amorphous carbon and the crystalline graphite carbon.33 Here, the prominent G band means that the as-formed carbon shell was mainly composed of highly graphitized ordered carbon, which contributes to the fast electron transfer over the electrode. Through the ultraviolet absorption spectrum, it could be clearly seen that the absorption of Ag@C NCs happened at 420 nm, while the absorption of Ag@C NFSs happened at 351 nm and 388 nm. The observations were consistent with the respective characteristic UV-vis absorption peaks previously reported.31,34
O and C–H groups, respectively.28,31 The absorption bands in the range of 3300 cm−1 to 3500 cm−1 were attributed to the O–H stretching vibration.32 The form of carbon in Ag@C NFSs was further investigated using Raman spectroscopy. As shown in Fig. 3E, two characteristic peaks located at 1356 cm−1 and 1584 cm−1 could be easily seen that corresponded to the D band and G band, respectively, indicative of two forms of carbon existing within Ag@C NFSs: the disordered amorphous carbon and the crystalline graphite carbon.33 Here, the prominent G band means that the as-formed carbon shell was mainly composed of highly graphitized ordered carbon, which contributes to the fast electron transfer over the electrode. Through the ultraviolet absorption spectrum, it could be clearly seen that the absorption of Ag@C NCs happened at 420 nm, while the absorption of Ag@C NFSs happened at 351 nm and 388 nm. The observations were consistent with the respective characteristic UV-vis absorption peaks previously reported.31,34![[thin space (1/6-em)]](https://www.rsc.org/images/entities/char_2009.gif) ν), where both Epa and Epc were linearly related to lg
ν), where both Epa and Epc were linearly related to lg![[thin space (1/6-em)]](https://www.rsc.org/images/entities/char_2009.gif) ν with two linear regression equations for the redox peaks achieved as follows: Epa = 0.9972
ν with two linear regression equations for the redox peaks achieved as follows: Epa = 0.9972![[thin space (1/6-em)]](https://www.rsc.org/images/entities/char_2009.gif) lg
lg![[thin space (1/6-em)]](https://www.rsc.org/images/entities/char_2009.gif) ν + 0.4493 and Epc = −0.0795
ν + 0.4493 and Epc = −0.0795![[thin space (1/6-em)]](https://www.rsc.org/images/entities/char_2009.gif) lg
lg![[thin space (1/6-em)]](https://www.rsc.org/images/entities/char_2009.gif) ν + 0.0357, respectively. The ks was calculated based on the following Laviron equations:37
ν + 0.0357, respectively. The ks was calculated based on the following Laviron equations:37

![[thin space (1/6-em)]](https://www.rsc.org/images/entities/char_2009.gif) ν and Epc versus lg
ν and Epc versus lg![[thin space (1/6-em)]](https://www.rsc.org/images/entities/char_2009.gif) ν, respectively, α is the charge-transfer coefficient, R is Faraday constant, n is the apparent number of electrons transferred, v is the scan rate, T is room temperature and ΔEp is the potential difference of the redox peaks. The final value of ks was estimated to be 1.07 s−1, much higher than that (0.584 s−1) of the previously reported silver nanowire–polyaniline nanocomposite based electrochemical sensor, further verifying the greatly improved electron transfer behavior of Ag@C NFSs/GCE.38
ν, respectively, α is the charge-transfer coefficient, R is Faraday constant, n is the apparent number of electrons transferred, v is the scan rate, T is room temperature and ΔEp is the potential difference of the redox peaks. The final value of ks was estimated to be 1.07 s−1, much higher than that (0.584 s−1) of the previously reported silver nanowire–polyaniline nanocomposite based electrochemical sensor, further verifying the greatly improved electron transfer behavior of Ag@C NFSs/GCE.38
![[thin space (1/6-em)]](https://www.rsc.org/images/entities/char_2009.gif) lg
lg![[thin space (1/6-em)]](https://www.rsc.org/images/entities/char_2009.gif) c + 66.9988 (R2 = 0.996 with the limit of detection (LOD) calculated to be 5.12 pg mL−1 (signal to noise ratio = 3), much lower than many existing ones). Given its wide linear range and low LOD, it is of great potential to detect CEA in the early clinical diagnosis of tumors. Upon comparison with some previously reported noble metal-based CEA immunoassays (Table 2), the proposed Ag@C NFS-based electrochemical immunosensor exhibited a significantly lower LOD and superior sensitivity for the detection of CEA.
c + 66.9988 (R2 = 0.996 with the limit of detection (LOD) calculated to be 5.12 pg mL−1 (signal to noise ratio = 3), much lower than many existing ones). Given its wide linear range and low LOD, it is of great potential to detect CEA in the early clinical diagnosis of tumors. Upon comparison with some previously reported noble metal-based CEA immunoassays (Table 2), the proposed Ag@C NFS-based electrochemical immunosensor exhibited a significantly lower LOD and superior sensitivity for the detection of CEA.


