 Open Access Article
Novel N,Cl-doped deep eutectic solvents-based carbon dots as a selective fluorescent probe for determination of morphine in food
Qinhong Yin *a,
Mengtao Wangb,
Dong Fangb,
Yanqin Zhu
 c and
Lihua Yanga
aFaculty of Drug Control, Yunnan Police College, Kunming 650223, China. E-mail: hawkyin2008@126.com
bFaculty of Materials Science and Engineering, Kunming University of Science and Technology, Kunming, 650093, China
cResearch Center for Analysis and Measurement, Kunming University of Science and Technology, Kunming 650093, China
First published on 7th May 2021
Abstract
In the present study, new N,Cl co-doped carbon dots (N,Cl-CDs) based on deep eutectic solvent (DES) were fabricated by a facile hydrothermal process. This fluorescent probe exhibited a good quantum yield of 14% and was applied for the sensitive and selective quantification of morphine in foods. In addition, the influence of solution pH, interaction time, system temperature, interfering substances and analogues on the determination was also investigated. Under the optimized conditions, the luminescence intensity of carbon dots increased linearly with the addition of morphine in the concentration range of (0.15–280.25) μg mL−1 (R2 > 0.9969) and the limit of detection (LOD) of 46.5 ng mL−1. Based on these results, it is suggested that N,Cl-CDs is a promising fluorescent probe for sensitive and selective quantification of morphine in foods.
1. Introduction
The use of illegal non-food processing additives represents a serious threat to food safety and human health. Poppy is a plant of the poppy family, and its fruit contains morphine, codeine, papaverine, covering over 30 kinds of alkaloids.1,2 If improperly used, morphine can cause strong addictiveness, central inhibition and harm to the human body.3 In accordance with Chinese law, poppy shells are classified as non-edible ingredients and are forbidden to be added to foods. However, in numerous regions, some hotpot, brine and barbecue restaurants are illegally adding poppy shells to foods with the aim to enhance their taste for profit. Therefore, rapid identification of chemical constituents of forbidden additives provides an effective procedure to determine their illegal use in foods.Up to now, various analytical methods for the determination of morphine in poppy shells have been developed, containing ultraviolet spectrophotometry,4 thin layer chromatography (TLC),5 high performance liquid chromatography (HPLC),6 gas chromatography (GC),7 capillary electrophoresis (CE)8 and mass spectrometry (MS).9–13 UV and TLC lack sensitivity and specificity for the determination of morphine in poppy shells. Instrumental analysis possesses the advantages of high sensitivity and specificity, presenting the trend of intelligence, automation and miniaturization. However, instrumental analysis requires expensive equipment and complex sample pretreatment, making it unsuitable for rapid on-site detection.
Carbon dots (CDs), also known as nanocrystals, are a new type of nanoparticles with particle sizes between 1 and 10 nm, which are smaller than or close to the Bohr radius of excitons.14 As nanomaterials, CDs exhibits excellent properties such as good water solubility, low cytotoxicity, photobleaching resistance, good biocompatibility and easy surface modification. Moreover, it has been applied more and more extensively in the fields of photoelectric conversion, solar photovoltaic cells, chemical catalysis, biological imaging and analytical detection.15–22 As a fluorescent probe, it is widely utilized in the field of food safety analysis. However, few studies have been conducted on the detection of active ingredients in drug plants based on carbon dots.
Deep eutectic solvents (DESs) have been considered green solvent alternatives to conventional solvents. As an emerging research field, DESs are extensively studied and show good applications with energy and environmental prospects.23 DESs are usually formed by quaternary ammonium salt and H-bond donor in a stoichiometric proportion. These components are mixed together to form a eutectic mixture with a melting point lower than that of each individual component.24 Compared with traditional organic solvents, it presents excellent physical and chemical properties, such as wide electrochemical stable window, low vapour pressure, simple synthesis, high solubility, diversity of precursors for its design and adjustable performance. As a result, it has been on the cutting edge in catalyst, extraction and separation.25–29 Recently, it has been demonstrated that CDs have been synthesized in a sustainable DESs and used for fluorescent labelling, intracellular biosensors and living cell imaging, indicating that CDs based on DESs have high practical value and broad application prospects.30–33
In this study, new N,Cl co-doped carbon dots (N,Cl-CDs) were synthesized from choline chloride/urea DES and glycine as the source of C atom. The fabricated N,Cl-CDs show intense fluorescent emission and good thermal stability. N,Cl-CDs is a low-cost and easy-obtaining material and the preparation method is simple. In addition, there is no participation of heavy and precious metals, which was environmentally friendly and affordable. The traces of poppy shell in foods were analyzed with N,Cl-CDs fluorescent probe through the determination of its main alkaloid, morphine. We established a fluorescence method for rapid identification and accurate quantification of morphine with N,Cl-CDs as a fluorescent probe, and screened for the traces of poppy shell in foods.
2. Materials and methods
2.1 Chemicals
Choline chloride (98%) was supplied by Shanghai Macklin Biochemical Company. Urea (99%) and glycine (98%) were offered by Beijing J&K Scientific LTD. Morphine, heroin and methamphetamine, ephedrine and pseudoephedrine with purity above 99% were provided by Key Laboratory of Narcotics Assay and Control Technology Ministry of Public Security. Nicotine, theophylline and betaine were purchased from Shanghai Aladdin Reagents Inc. All reagents were p.a. grade from Fengchuan Chemical Reagent Technologies (Tianjin, China). Ultrapure water was produced on the basis of Milli-Q purification system (Millipore, Bedford, MA, USA) with double-distilled water as an input.2.2 Instruments
Fourier transform infrared (FT-IR) spectra were acquired on a TENSOR27 FTIR spectrometer (Bruker, Germany) in the wavenumber range from 4000 cm−1 to 400 cm−1. The ultraviolet-visible (UV-vis) spectrogram was conducted on a UV-2550 spectrophotometer (Shimadzu, Japan). The fluorescence spectra were obtained by G9800A Cary Eclipse fluorescence spectrophotometer (Agilent, USA). X-ray photoelectron spectroscopy (XPS) characterization was performed with PHI5000 VersaProbe-II with monochromatized Al Kα radiation (ULVAC-PHI, Japan). The size and the morphology of carbon dots were analyzed under a TecnaiG2 F30 S-Twin (FEI, USA) transmission electron microscope. The pH was adjusted with HCl or NaOH solutions and monitored by employing a digital pH-meter (PHS-3, Shanghai, China).2.3 Preparation of real samples
The pretreatment procedure of hotpot condiment and chilli paste from the local supermarket was modified slightly.34 Two food substrates (1.0 g) were placed in a beaker, 10 mL of double-distilled water was added, and boiled for 30 minutes. After cooling, the suspension was centrifuged at 8000 rpm for 15 min and filtered to obtain the clear supernatant. The precipitate was further washed three times with double-distilled water, centrifuged and then filtered. The volume was replenished with double-distilled water to 40 mL. The supernatant and petroleum ether (v/v, 1![[thin space (1/6-em)]](https://www.rsc.org/images/entities/char_2009.gif) :
:![[thin space (1/6-em)]](https://www.rsc.org/images/entities/char_2009.gif) 1) were placed in a separation funnel and mixed thoroughly. After 10 min, the aqueous phase of the lower layer was collected and the current operation was replicated twice. Finally, the collected solution is concentrated on a rotary evaporator to a small volume (1 mL) for morphine detection.
1) were placed in a separation funnel and mixed thoroughly. After 10 min, the aqueous phase of the lower layer was collected and the current operation was replicated twice. Finally, the collected solution is concentrated on a rotary evaporator to a small volume (1 mL) for morphine detection.
2.4 Preparation of N,Cl-CDs
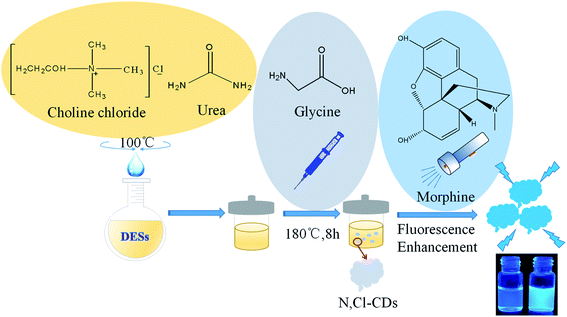
Synthesis schematic diagram of fluorescent N,Cl-CDs was displayed in Fig. 1. Choline chloride (0.61 g) and urea (1.39 g) were placed in a 250 mL round-bottom vessel and stirred at 100 °C until a transparent and viscous mixture of choline chloride–urea DES was formed.33 Glycine (0.75 g) and double-distilled water (100 mL) were added to this flask with DES under stirring until glycine was completely dissolved. Then, the mixture was transferred in 150 mL Teflon-coated autoclave and heated at 180 °C for 8 h. Followed by filtration through 0.22 μm membrane, the large agglomerated particles were separated by centrifugation at 10![[thin space (1/6-em)]](https://www.rsc.org/images/entities/char_2009.gif) 000 rpm for 15 min. With an external 1000 Da dialysis membrane, the resulting N,Cl-CDs were purified for 24 h and stored at 4 °C in the cold section of refrigerator.
000 rpm for 15 min. With an external 1000 Da dialysis membrane, the resulting N,Cl-CDs were purified for 24 h and stored at 4 °C in the cold section of refrigerator.
2.5 Quantum yield (QY) calculation
According to the reference, quinine sulfate was selected as the reference substance, and its quantum yield in 0.05 M sulfuric acid solution was 0.55.35 The fluorescence intensity was recorded at 350 nm excitation and the quantum yield was calculated following the formula:| QCDs = QR × (ICDs/IR) × (AR/ACDs) × (ηCDs2/ηR2) |
2.6 Fluorescent detection of morphine
The synthesized N,Cl-CDs solution was diluted for 5 times with double-distilled water. The different concentrations of morphine standard solutions were combined with 500 μL of N,Cl-CDs solution at room temperature and the pH was adjusted to 7.0. The emission intensity was recorded at 400 nm upon excitation at 320 nm, setting both emission and excitation slit width at 5 nm. The different interfering substances (magnesium sulfate, sodium chloride, zinc sulfate, glucose, potassium sulfate, urea, sodium carbonate, calcium chloride and cysteine) and analogs (methamphetamine, heroin, ephedrine, nicotine, pseudoephedrine, theophylline and betaine) at the same concentration of 350 μg mL−1 were studied under the same experimental conditions to evaluate the specificity of N,Cl-CDs towards morphine.3. Results and discussion
3.1 Characterization results of N,Cl-CDs
The synthesis and characterization of DES derived from choline chloride and urea have been previously reported.36,37 Also, that DES was prepared and obtained as previously reported (as mentioned in the Material and methods section).38The nanostructure of N,Cl-CDs was studied under Transmission Electron Microscopy (TEM). The TEM images of N,Cl-CDs are given at different scales in Fig. 2A and B. As presented in Fig. 2A, synthesized carbon dots are granular with a wide particle-size distribution. The size of smaller particles was approximately 4 nm while larger particles reached nearly 20 nm. According to Fig. 2B, N,Cl-CDs have clear lattice fringes with an interval of 0.27 nm, suggesting a high crystallinity of the synthesized carbon dots.
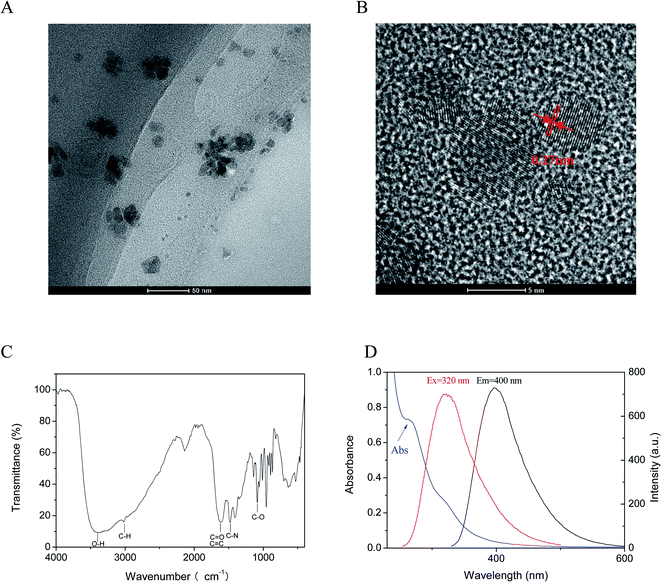 | ||
| Fig. 2 The analysis of N,Cl-CDs using (A) and (B) TEM images at different scales; (C) FT-IR spectra; (D) Fluorescence and UV-vis absorption spectrum. | ||
Fig. 2C represents FT-IR spectrum of N,Cl-CDs. The low-intensity band at 3434 cm−1 is assigned to –OH stretching vibrations. A sharp peak at 2950 cm−1 originates from C–H stretching vibrations. The absorption peak at 1650 cm−1 associated with C![[double bond, length as m-dash]](https://www.rsc.org/images/entities/char_e001.gif) O and C
O and C![[double bond, length as m-dash]](https://www.rsc.org/images/entities/char_e001.gif) C bending vibrations.33 The sharp peaks at 1401 cm−1 was assigned to the vibrations of C–N.33 Absorption peak at 1092 cm−1 was ascribed the C–O stretching vibration.28 The UV-vis spectrum of N,Cl-CDs was displayed in Fig. 2D. The shoulder peak around 260 nm is attributed to the n–π* transitions.39
C bending vibrations.33 The sharp peaks at 1401 cm−1 was assigned to the vibrations of C–N.33 Absorption peak at 1092 cm−1 was ascribed the C–O stretching vibration.28 The UV-vis spectrum of N,Cl-CDs was displayed in Fig. 2D. The shoulder peak around 260 nm is attributed to the n–π* transitions.39
The chemical groups at the surface of N,Cl-CDs were analyzed with the application of XPS. The peaks at 284.8, 400.8, and 531.2 eV (Fig. 3A) originate from C1s, N 1s, and O 1s energy levels. The C 1s spectrum is resolved in three peaks at 284.8, 286.3 and 287.5 eV (Fig. 3B) that could be assigned to C![[double bond, length as m-dash]](https://www.rsc.org/images/entities/char_e001.gif) C, C–N and C
C, C–N and C![[double bond, length as m-dash]](https://www.rsc.org/images/entities/char_e001.gif) O groups.33 The two peaks observed in N1s spectrum at 399.8 and 402.6 eV (Fig. 3C) could be in association with N–H and N–O bond types.40 Further analysis of O 1s spectrum (Fig. 3D) revealed three main peaks at 530.6, 532.2 and 533.7 eV that originate from O–H, C
O groups.33 The two peaks observed in N1s spectrum at 399.8 and 402.6 eV (Fig. 3C) could be in association with N–H and N–O bond types.40 Further analysis of O 1s spectrum (Fig. 3D) revealed three main peaks at 530.6, 532.2 and 533.7 eV that originate from O–H, C![[double bond, length as m-dash]](https://www.rsc.org/images/entities/char_e001.gif) O and C–O groups.41 Furthermore, the quantum yield of N,Cl-CDs was 14%.
O and C–O groups.41 Furthermore, the quantum yield of N,Cl-CDs was 14%.
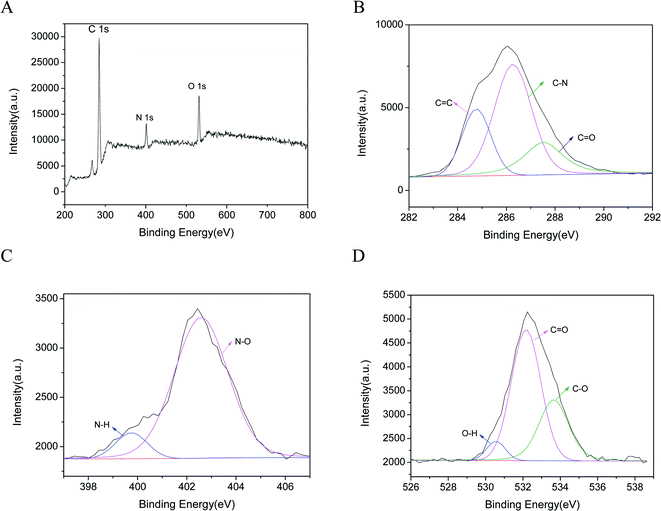 | ||
| Fig. 3 (A) XPS spectra of N,Cl-CDs, high resolution (B) C 1s, (C) N 1s, and (D) O 1s peaks of N,Cl-CDs. | ||
3.2 Optimization of fluorescent detection procedure
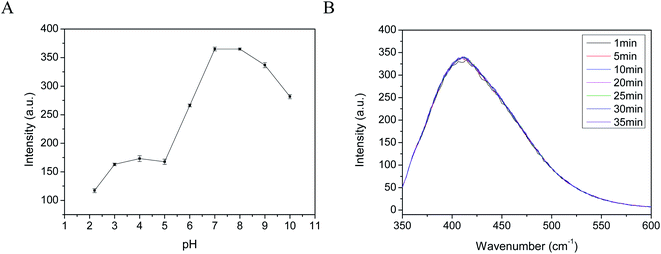
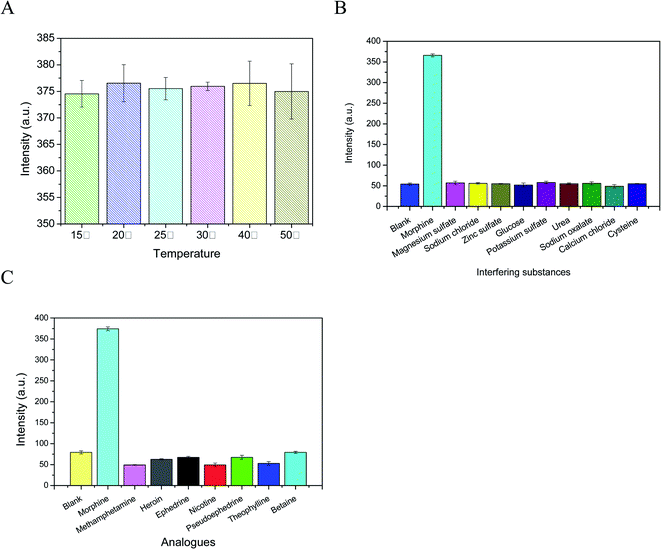
The sensitivity of the method was optimized through variation of several experimental variables including solution pH, interaction time, system temperature, interfering substances and analogs.3.3 Method validation
Under the optimum experimental setup, the system exhibited a linear fluorescence intensity in the range of morphine concentrations from 0.15 μg mL−1 to 280.25 μg mL−1. The corresponding trendline is y = 0.835x + 92.821, with the high correlation coefficient r2 > 0.9969 (Fig. 6). Based on parallel determination of 10 groups of samples (200 μg mL−1), the proposed method exhibited excellent reproducibility with a relative standard deviation (RSD) of 3.1%. According to the IUPAC recommendation, the limit of detection (LOD) of the method was calculated as 46.5 ng mL−1 using 3s K−1 (s is the standard deviation of continuous determination of 10 blanks, K is the slope of calibration trendline).42 Therefore, it was concluded that N,Cl-CDs could be satisfactorily used for rapid identification and quantitative detection of morphine.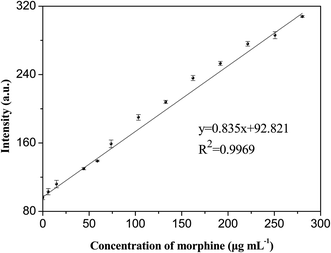 | ||
| Fig. 6 The linear dependence of luminescence intensity of N,Cl-CDs with the increasing morphine concentration. | ||
3.4 Analysis of real samples
The hotpot condiment and chilli paste were spiked with three levels (2, 20, 200 μg mL−1) of morphine, submitted to the pretreatment procedure, and explored by the developed method (Table 1). The recovery of novel fluorescent method was between 95.2% and 102.8%, and RSDs were less than 5.0%. Table 2 reviews the analytical data of different methods for the determination of morphine.6–9,12,34,43–46 Compared with anti-morphine antibody-labeled C-Dots and colloidal gold labeling, N,Cl-CDs is a low-cost and easy-obtaining material. Moreover, there is no participation of precious metals, which was environmentally friendly and affordable. In comparison with electrochemical sensor and graphene quantum dots fluorescence, the proposed method is simpler and highly accurate. The results show that the presented method can be introduced for quickly screening illegal addition of poppy shell in foods as described methods.| Materials | Detection methods | Linearity range | LOD | Reference |
|---|---|---|---|---|
| C18 cartridges | HPLC | 50–750 ng mL−1 | 50 ng mL−1 | 6 |
| Silica-based hydrophobic cation exchange copolymer | GC | 10–600 ng mL−1 | — | 7 |
| Acidic potassium permanganate chemiluminescence | CE | 2.5 × 10⁻⁷ to 1 × 10⁻⁴ M | 2.5 × 10⁻⁷ M | 8 |
| Liquid–liquid extraction | UPLC-MS/MS | 1–2000 ng mL−1 | — | 9 |
| Liquid–liquid extraction | Direct MS | 10–10 × 103 ppb | 2 ppb | 12 |
| Carbon quantum dot-labeled antibody | Fluorescence immunoassays | 3.2 × 10⁻⁴ to 1 mg L−1 | 2.7 × 10⁻⁴ mg L−1 | 34 |
| Anti-morphine antibody-labeled C-Dots | Fluorescence immunoassays | 3.2 × 10⁻⁴ to 10 mg L−1 | 3.0 × 10⁻⁴ mg L−1 | 43 |
| Colloidal gold labeling | Immunochromatography | — | 0.1 ppb | 44 |
| Modified multiwall carbon nanotubes paste electrode | Electrochemical sensor | 0.2–250 μM | 0.09 μM | 45 |
| Graphene quantum dots | Fluorescence | — | 0.06 μM | 46 |
| N,Cl-CDs | Fluorescence | 0.15–280.25 μg mL−1 | 46.5 ng mL−1 | This work |
3.5 Mechanism of N,Cl-CDs
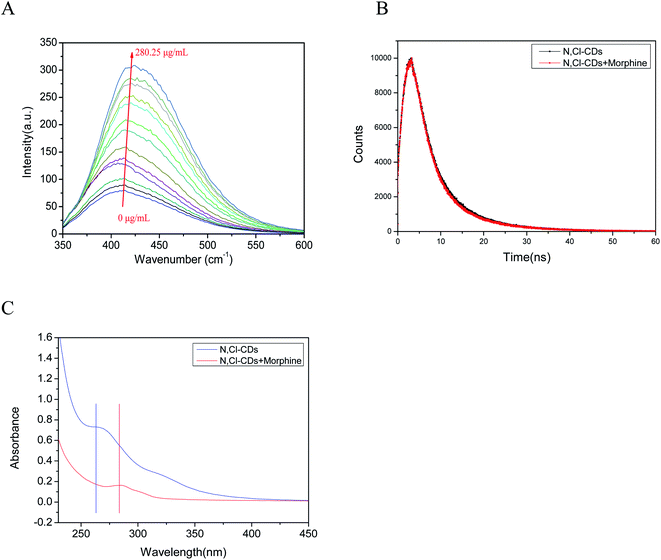
In the current work, a highly sensitive fluorescent probe based on N,Cl-CDs in a choline chloride/urea DES was constructed to identify morphine. The molecule of morphine contains two hydroxyl groups (−OH), which is a typical Lewis base. Based on the infrared image (Fig. 2C), N,Cl-CDs contain C![[double bond, length as m-dash]](https://www.rsc.org/images/entities/char_e001.gif) O and C–O on their surface, which is a typical Lewis acid. Thus, morphine can serve as a hydrogen donor and further alter the surface property of N,Cl-CDs. Fig. 7A illustrates the PL spectra of N,Cl-CDs in morphine solutions with different concentrations. When the morphine concentration increases from 0 μg mL−1 to 280.25 μg mL−1, the emission peak shifts from 413 nm to 423 nm, which may be attributable to the following reasons. At first, morphine can play the role of a hydrogen donor and further alter the surface of N,Cl-CDs. Therefore, the emission peaks can shift towards the long wavelength. Secondly, the emission peak of N,Cl-CDs is red-shifted with respect to the functionality with halogens (such as Cl), which is in consistence with the literature data.47
O and C–O on their surface, which is a typical Lewis acid. Thus, morphine can serve as a hydrogen donor and further alter the surface property of N,Cl-CDs. Fig. 7A illustrates the PL spectra of N,Cl-CDs in morphine solutions with different concentrations. When the morphine concentration increases from 0 μg mL−1 to 280.25 μg mL−1, the emission peak shifts from 413 nm to 423 nm, which may be attributable to the following reasons. At first, morphine can play the role of a hydrogen donor and further alter the surface of N,Cl-CDs. Therefore, the emission peaks can shift towards the long wavelength. Secondly, the emission peak of N,Cl-CDs is red-shifted with respect to the functionality with halogens (such as Cl), which is in consistence with the literature data.47
The fluorescence lifetime curve is shown in Fig. 7B. The lifetime components of N,Cl-CDs are τ1 = 4.76 ns (60.72%) and τ2 = 11.53 ns (39.28.%), and the mean fluorescence lifetime is 8.89 ns (χ2 = 1.457). After adding morphine, the lifetime components are τ1 = 4.55 ns (62.14%) and τ2 = 11.86 ns (37.86%), and the mean fluorescence lifetime is 9.04 ns (χ2 = 1.609). Based on these data, it can be observed that the fluorescence lifetime is almost unchanged after morphine addition, indicating that the interaction between PA and the ground state molecules of N,Cl-CDs contributes leads to fluorescence enhancement.
Fig. 7C showed the UV-vis absorption spectra of N,Cl-CDs before and after addition of morphine. This proves that there was interaction between morphine and N,Cl-CDs. According to FT-IR and XPS diagrams, the surface of N,Cl-CDs has hydrophilic functional groups such as carbonyl group, cyano group, amino group, hydroxyl group and carboxyl group. This may be related to the abundant functional groups and their interactions in choline chloride-urea DES and glycine. These functional groups can lower the non-radiative recombination of N,Cl-CDs and transfer the emission of N,Cl-CDs from defect state to eigenstate. In addition, previous studies reported that the amines of the target could enhance emission intensity of nano-range molecules.48,49 The hydrogen bonding and charge transfer interactions of morphine with the N,Cl-CDs via its tertiary amino group increases the surface electron density.50 The binding of morphine on N,Cl-CDs stabilizes the surface and decreases the surface defects that act as electron traps,48,49 and therefore enhancing the fluorescence intensity.
4. Conclusions
To conclude, in the current work, we report a hydrothermal synthesis of N,Cl-CDs starting from DES as raw material and their application as the probe for the sensitive and selective fluorescent detection of morphine in foods. In addition, we also investigated the effects of different pH, interaction time, system temperature, potential interfering substances and analogues. The developed method possesses several advantages such as high efficiency, facile usage and environmental-friendliness, indicating a large potential for practical application of N,Cl-CDs in the determination of illegal addition of poppy shells in food. Moreover, we expect that this technique will be sufficiently sensitive and repetitive to screen for the traces of poppy shell in foods.Conflicts of interest
The authors have declared no conflict of interest.Acknowledgements
This work was supported by Basic Research Project of Yunnan Province/General Project (202001AT070002), Scientific Research Foundation of Department of Education of Yunnan Province (2020J0481) and Scientific Research Foundation of Yunnan Police College (19A008).References
- S. S. Pandey, S. Singh, C. S. V. Babu, K. Shanker, N. K. Srivastava and A. Kalra, Planta, 2016, 243, 1097–1114 CrossRef CAS PubMed
.
- I. Celik, H. Camci, A. Kose, F. C. Kosar, S. Doganlar and A. Frary, Mol. Breed., 2016, 36, 1–13 CrossRef
.
- J. Listos, M. Upina, S. Talarek, A. Mazur and J. Kotlińska, Int. J. Mol. Sci., 2019, 20, 4302 CrossRef CAS PubMed
.
- R. V. D. Rondina, A. L. Bandoni and J. D. Coussio, J. Pharm. Sci., 1973, 62, 502–504 CrossRef CAS PubMed
.
- S. Ebel and D. Rost, Arch. Pharm., 1980, 313, 337–343 CrossRef CAS PubMed
.
- M. Freiermuth and J. C. Plasse, J. Pharm. Biomed., 1997, 15, 759–764 CrossRef CAS PubMed
.
- T. Vu-Duc and A. Vernay, Biomed. Chromatogr., 1990, 4, 65–69 CrossRef CAS PubMed
.
- N. W. Barnett, B. J. Hindson and S. W. Lewis, Analyst, 2000, 125, 91–95 RSC
.
- P. Heydari, M. L. F. Martins, H. Rosing, M. J. X. Hillebrand, A. Gebretensae, A. H. Schinkel and J. H. Beijnen, J. Chromatogr. B: Anal. Technol. Biomed. Life Sci., 2020, 122403 Search PubMed
.
- C. Sproll, R. C. Perz and D. L. Lachenmeier, J. Agric. Food Chem., 2006, 54, 5292–5298 CrossRef CAS PubMed
.
- T. Mahdy, T. H. El-Shihi, M. M. Emara, S. Chericoni, M. Giusiani and M. Giorgi, J. Anal. Toxicol., 2012, 36, 548–559 CrossRef CAS PubMed
.
- S. Saha, M. K. Mandal and K. Hiraoka, Anal. Methods, 2013, 5, 4731–4738 RSC
.
- S. Saha, L. C. Chen, M. K. Mandal and K. Hiraoka, J. Am. Soc. Mass Spectrom., 2013, 24, 341–347 CrossRef CAS PubMed
.
- M. B. Jr, M. Moronne, P. Gin, S. Weiss and A. P. Alivisatos, Science, 1998, 281, 2013–2016 CrossRef PubMed
.
- H. Meng, Y. Yang, Yi. Chen, Y. Zhou, Y. Liu, H. Ma, Z. Tang, D. Liu and L. Jiang, Chem. Commun., 2009, 17, 2293–2295 RSC
.
- P. Singh, R. K. Singh and R. Kumar, RSC Adv., 2021, 11, 2512–2545 RSC
.
- H. R. Rajabi and M. Farsi, J. Mol. Catal. A: Chem., 2015, 399, 53–61 CrossRef CAS
.
- R. Gui, X. Bu, W. He and H. Jin, New J. Chem., 2018, 42, 16217–16225 RSC
.
- T. Kameyama, H. Yamauchi, T. Yamamoto, T. Mizumaki and T. Torimoto, ACS Appl. Nano Mater., 2020, 3, 3275–3287 CrossRef CAS
.
- X. Jiang, H. Jin, Y. Sun and R. Gui, Microchim. Acta, 2019, 186, 580 CrossRef CAS PubMed
.
- A. S. Chang, A. Tahira, F. Chang, N. N. Memon, A. Nafady, A. Kasry and Z. H. Ibupoto, RSC Adv., 2021, 11, 5156–5162 RSC
.
- X. Bu, Y. Fu, X. Jiang, H. Jin and R. Gui, Microchim. Acta, 2020, 187, 154 CrossRef CAS PubMed
.
- M. F. Majid, H. F. M. Zaid, C. F. Kait, K. Jumbri and S. Rajasuriyan, J. Mol. Liq., 2020, 306, 112870 CrossRef CAS
.
- N. Kaur and V. Singh, New J. Chem., 2017, 41, 2844–2868 RSC
.
- B. Tang, H. Zhang and K. H. Row, J. Sep. Sci., 2015, 38, 1053–1064 CrossRef CAS PubMed
.
- M. K. Miraki, J. A. Mehraban, E. Yazdani and A. Heydari, J. Mol. Liq., 2017, 234, 129–132 CrossRef CAS
.
- D. J. Cronin, X. Chen, L. Moghaddam and X. Zhang, ChemSusChem, 2020, 13, 4678–4690 CrossRef CAS PubMed
.
- K. Pang, Y. Hou, W. Wu, W. Guo, W. Peng and K. N. Marsh, Green Chem., 2012, 14, 2398–2401 RSC
.
- Y. Dai, G. J. Witkamp, R. Verpoorte and Y. H. Choi, Anal. Chim. Acta, 2013, 766, 61–68 CrossRef CAS PubMed
.
- S. D. Çalhan, M. Ö. Alaş, M. Aşık, F. N. D. Kaya and R. Genç, J. Mater. Sci., 2018, 53, 15362–15375 CrossRef
.
- G. Ren, X. Hou, Y. Kang, R. Zhang, M. Zhang, W. Liu, L. Li, S. Wei, H. Wang, B. Wang and H. Diao, Spectrochim. Acta, Part A, 2020, 234, 118251 CrossRef CAS PubMed
.
- A. D. Crescenzo, M. Tiecco, R. Zappacosta, S. Boncompagni, P. D. Profio, V. Ettorre, A. Fontana, R. Germani and G. Siani, J. Mol. Liq., 2018, 268, 371–375 CrossRef
.
- Z. Gao, X. Li, L. Shi and Y. Yang, Spectrochim. Acta, Part A, 2019, 220, 117080 CrossRef CAS PubMed
.
- C. Zhang, Y. Han, L. Lin, N. Deng, B. Chen and Y. Liu, J. Agric. Food Chem., 2017, 65, 1290–1295 CrossRef CAS PubMed
.
- Y. Li, X. Zhang, B. Zhu, J. Yan and W. Xu, Anal. Sci., 2010, 26, 1077–1080 CrossRef CAS PubMed
.
- A. P. Abbott, G. Capper, D. L. Davies, R. K. Rasheed and V. Tambyrajah, Chem. Commun., 2003, 9, 70–71 RSC
.
- Q. Gao, Y. Zhu, X. Ji, W. Zhu, L. Lu and X. Lu, Fluid Phase Equilib., 2018, 470, 134–139 CrossRef CAS
.
- H. Sun, Y. Li, X. Wu and G. Li, J. Mol. Model., 2013, 19, 2433–2441 CrossRef CAS PubMed
.
- M. Bagherzadeh and M. Zare, J. Coord. Chem., 2013, 66, 2885–2900 CrossRef CAS
.
- S. Tao, Y. Song, S. Zhu, J. Shao and B. Yang, Polymer, 2017, 116, 472–478 CrossRef CAS
.
- H. Wang, S. Liu, Y. Xie, J. Bi, Y. Li, Y. Song, S. Cheng, D. Li and M. Tan, New J. Chem., 2018, 42, 3729–3735 RSC
.
- L. Peng, R. Wei, K. Li, Z. Zhou, P. Song and A. Tong, Analyst, 2013, 138, 2068–2072 RSC
.
- C. Zhang, X. Yu, X. Shi, Y. Han, Z. Guo and Y. Liu, Food Anal. Method., 2020, 13, 1042–1049 CrossRef
.
- W. Chen, X. Li, Q. Wu, L. Yao and J. Xu, Food Sci. Hum. Well., 2019, 8, 40–45 CrossRef
.
- A. Mokhtari, H. Karimi-Maleh, A. A. Ensafi and H. Beitollahi, Sens. Actuators, B, 2012, 169, 96–105 CrossRef CAS
.
- M. Masteri-Farahani and N. Mosleh, Mater. Lett., 2019, 241, 206–209 CrossRef CAS
.
- O. Bolton, K. Lee, H. J. Kim, K. Y. Lin and J. Kim, Nat. Chem., 2011, 3, 207–212 CrossRef PubMed
.
- G. Wang, H. Jiao, X. Zhu, Y. Dong and Z. Li, Talanta, 2012, 93, 398–403 CrossRef CAS PubMed
.
- A. E. Vikraman, A. R. Jose, M. Jacob and K. G. Kumar, Anal. Methods, 2015, 7, 6791–6798 RSC
.
- M. Zhang, J. Qiao, S. Zhang and L. Qi, Talanta, 2018, 182, 595–599 CrossRef CAS
.
| This journal is © The Royal Society of Chemistry 2021 |

