 Open Access Article
Creative Commons Attribution 3.0 Unported Licence
Characterisation of hydration water in Nafion membrane†
Stewart F. Parker * and
Shrey Shah‡

ISIS Facility, STFC Rutherford Appleton Laboratory, Chilton, Didcot, Oxon, OX11 0QX, UK. E-mail: stewart.parker@stfc.ac.uk
First published on 1st March 2021
Abstract
Nafion, a polytetrafluoroethylene polymer with perfluorinated-vinyl-polyether side chains ending in sulfonic acid groups, is widely used as the proton-exchange membrane in polymer electrolyte fuel cells, particularly low temperature hydrogen-oxygen fuel cells. The state of hydration of the sulfonic acid groups is crucial to its operation. By using a combination of inelastic neutron scattering (INS) and infrared spectroscopies, and by comparison to a series of trifluoromethanesulfonic acid hydrates of well-defined stoichiometry, we characterise how the hydration changes as a function of water content.
Introduction
First manufactured in the 1970s by DuPont, Nafion1 is composed of a polytetrafluoroethylene (PTFE) backbone, with perfluorinated-vinyl-polyether side chains terminating in sulfonic acid groups. After synthesis, Nafion is cast into thin membranes by heating in aqueous alcohol at 250 °C in an autoclave.2 These membranes are characterised by both their thickness and equivalent weight (EW), which is the mass of dry Nafion per mole of sulfonic acid groups when the material is in acid form.1 For example, Nafion 112 has an equivalent weight of 1100 and a thickness of 0.002 inches.Nafion is used as the proton-exchange membrane in polymer electrolyte fuel cells, particularly low temperature hydrogen-oxygen fuel cells, owing to its excellent ion conductivity, especially at low humidity, and chemical–mechanical stability, characteristic of perfluorinated polymers. These fuel cells are already being used in electric cars as they offer a compact, energy-dense alternative to conventional lithium-ion battery cells. It is not, however, the perfect material for these applications, as it is expensive and has high gas permeability, as well as low environmental compatibility.3 It is important to understand the reason for Nafion's high proton conductivity at low humidity, so that different proton exchange membranes can be developed which do not have the drawbacks of Nafion but still function well at low humidity.
Because of its commercial importance, Nafion has been the subject of extensive research. Knowledge of the state of water in the membrane is of crucial importance to understanding its role and properties. Vibrational spectroscopy has played a major role in these studies.3–9 Typically, attenuated total internal reflection infrared (ATR-IR) spectroscopy is preferred over Raman spectroscopy, as the Nafion membranes often fluoresce, even with near infrared excitation. Moreover, Raman spectroscopy is much less sensitive to water and related species than IR. However, it is sometimes beneficial to use Raman and ATR-IR in conjunction, as even the thinnest Nafion membranes are totally absorbing with respect to infrared light, however, the focal point of the Raman laser can be adjusted to look at any specific area within the material. This means that while ATR-IR spectroscopy is limited to looking at water on the surface of the membrane, Raman spectroscopy can be used to investigate water within the membrane. Both techniques are well established, so data can be obtained relatively quickly and easily.
In this paper, inelastic neutron scattering (INS) spectroscopy has been used in combination with ATR-IR to determine the structure of water within the wetted Nafion membranes. INS spectroscopy is a form of vibrational spectroscopy conceptually similar to Raman spectroscopy, however instead of a photon being inelastically scattered, neutrons are used. The intensity,10 S, of an INS band is given by:
 | (1) |
1H has a particularly large incoherent scattering cross-section of 80.3 barn, whereas most other elements sit at <5 barn.11 1H is also the lightest isotope of the lightest element, and consequently has the largest amplitude of vibration. Therefore, for materials containing hydrogen, incoherent scattering due to hydrogen dominates the spectrum. For this reason, INS is the ideal technique to study water within Nafion, as the perfluorinated components are barely visible in the resulting spectra.
One approach in determining the state of water in Nafion is to investigate the structure of model compounds. A simple model of the sulfonic acid functionality is trifluoromethanesulfonic acid (CF3SO3H, or TFSA). This forms a series of structurally characterised hydrates: TFSA·nH2O (n = 0,12 0.5,13 1,14,15 2,13 4,16 5![[thin space (1/6-em)]](https://www.rsc.org/images/entities/char_2009.gif) 27 ), (the phase diagram13 is reproduced in Fig. S1†), which contain progressively more complex forms of protonated water (oxonium ions) ranging from just the sulfonic acid functionality (n = 0), to hydroxonium ions (n = 1), H5O2+ ions (n = 2), to H9O4+ ions (n = 4 and 5). The n = 0.5 material contains a 1
27 ), (the phase diagram13 is reproduced in Fig. S1†), which contain progressively more complex forms of protonated water (oxonium ions) ranging from just the sulfonic acid functionality (n = 0), to hydroxonium ions (n = 1), H5O2+ ions (n = 2), to H9O4+ ions (n = 4 and 5). The n = 0.5 material contains a 1![[thin space (1/6-em)]](https://www.rsc.org/images/entities/char_2009.gif) :
:![[thin space (1/6-em)]](https://www.rsc.org/images/entities/char_2009.gif) 1 mixture of sulfonic acid and hydroxonium ions. The fifth water molecule in the n = 5 compound links the H9O4+ ions.
1 mixture of sulfonic acid and hydroxonium ions. The fifth water molecule in the n = 5 compound links the H9O4+ ions.
In this paper we are leveraging the selectivity of neutron scattering to hydrogen vibrations to characterise the state of water in Nafion as a function of hydration. To this end, we use TFSA hydrates as model compounds of known stoichiometry to determine the state of water as the hydration level varies.
Experimental
Nafion™ N-117 membrane (0.18 mm thickness, >0.90 meq g−1 exchange capacity, lot no. W27E078) was purchased from Alfa Aesar. Samples with different water contents were prepared as shown in Table 1. The water content was determined gravimetrically, assuming that the 180 °C dried sample was water-free (this was confirmed by the spectra).| Preparation method | Water content/wt% | Moles H2O per SO3 |
|---|---|---|
| Dried in vacuum oven at 180 °C for two days | 0 | 0 |
| Dried in glove box at room temperature for seven days | 1.51 | 1.0 |
| Dried over P2O5 for 6 days | 2.46 | 1.6 |
| Dried over MgCl2 for 6 days | 6.10 | 4.0 |
| Used as received | 7.33 | 4.8 |
| Soaked in distilled water for three days | 19.39 | 12.7 |
Trifluoromethanesulfonic acid (≥99%) was purchased from Sigma-Aldrich and used as received. The TFSA hydrates were made by carefully mixing stoichiometric amounts of TFSA and distilled water under a flow of inert gas.
INS spectra were recorded using the TOSCA17 and MAPS11,18 spectrometers at the ISIS Pulsed Neutron and Muon Facility (Chilton, Oxfordshire, UK).19 The two instruments are complementary: on TOSCA, the resolution is 1.25% of the energy transfer across the entire energy range, thus provides high resolution spectra in the 0–2000 cm−1 range, however, instrumental factors10,11 mean that there is little information at >2000 cm−1. MAPS provides access to the O–H stretch region with modest resolution. The INS spectra shown have been normalised to 1 g of Nafion or 1 g of TFSA. The TOSCA spectra are available from the INS database at: http://wwwisis2.isis.rl.ac.uk/INSdatabase/. Infrared spectra (4 cm−1 resolution, 64 scans) were recorded between 105 K and 298 K with a Bruker Vertex 70 Fourier transform infrared spectrometer using a Specac single reflection variable temperature attenuated total internal reflection accessory. FT-Raman spectra were recorded with a Bruker MultiRam spectrometer using 1064 nm excitation, 4 cm−1 resolution, 500 mW laser power and 64 scans at room temperature.
Results and discussion
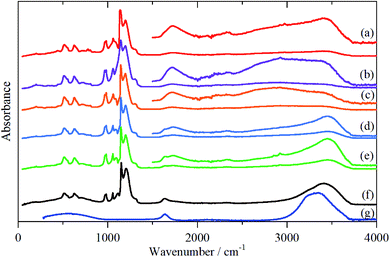
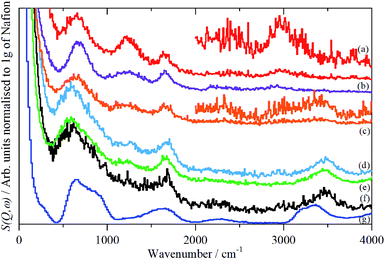
The infrared spectra of Nafion at various degrees of hydration are shown in Fig. 1. These are in good agreement with previous work.5,8 As expected, the region below 1500 cm−1 is dominated by the modes of the perfluoro skeleton and only the H–O–H bending and O–H stretch modes of water are clearly seen; the librational and translational modes are unobserved. In contrast, in the INS spectra, Fig. 2 and 3, all of the water and oxonium-related modes are apparent, the perfluoro skeletal modes are absent. This arises because the INS spectra are dominated by modes that involve significant displacement of hydrogen atoms. Note that only motion is required; thus for water the librational modes at 500–1000 cm−1 exhibit high intensity, Fig. 2g, even though there is (almost) no change in the H–O–H angle or O–H distances as the mode is executed.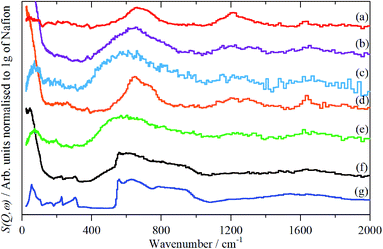 | ||
| Fig. 2 INS (TOSCA) spectra of Nafion at various levels (wt%) of hydration: (a) 0, (b) 1.51, (c) 2.46, (d) 6.10, (e) 7.33, (f) 19.39 (g) ice Ih. | ||
There is a marked difference in the appearance of the O–H stretch modes between the infrared and INS spectra, Fig. S2–S7.† A degree of caution is required as the infrared spectra are measured by ATR-IR, so are representative of the surface material, whereas the INS spectra are an average of the entire (surface + bulk) film, where the bulk dominates. The infrared spectra are strongly affected by electrical anharmonicity, which results in the O–H stretch bands being extremely broad, this is especially noticeable for the low hydration spectra (Fig. 1a–c) where the bands are ∼800 cm−1 wide, whereas the widths in the corresponding INS spectra (Fig. 3a–c) are half this.
Comparison of the infrared and INS spectra allows some trends to be picked out. As the hydration level increases, the O–H stretch modes move to higher energy. In the most hydrated samples, these occur above the modes of water or ice Ih, showing that the hydrogen bonding is weaker than in water. The TOSCA spectra (Fig. 2) show that at all, except for the highest, hydration levels, the water (and/or oxonium ions) are present as disordered materials, as shown by the absence of structure in the translational (0–300 cm−1) and librational (500–1000 cm−1) modes. In contrast, at the highest hydration level (Fig. 2f) water (ice) is present in both ordered i.e. ice Ih and disordered forms, as may be seen by comparison of Fig. 2f with 2e and g: 2f is clearly a superposition of the two.
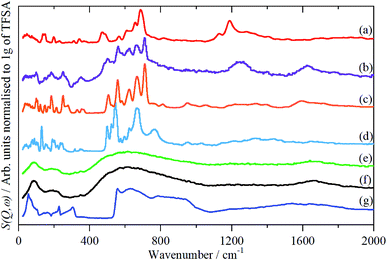
In order to aid the assignment of the Nafion spectra, we have also recorded the spectra of a series of model compounds, TFSA·nH2O, that have crystallographically characterised forms of oxonium, Fig. 4–6. These have melting points at: 233, 258, 307.5, 267, 225 and 227 K for n = 0, 0.5, 1, 2, 4 and 5 respectively (see Fig. S1†13). Thus all of them, except for the monohydrate, are liquids at room temperature. As may be expected, there are significant changes in the infrared spectra between the liquid and solid state, particularly for the O–H stretch modes (see Fig. S8–S19†). As the INS spectra are recorded below 20 K, the solid state infrared spectra are shown in Fig. 4.
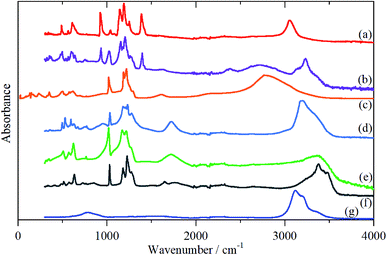 | ||
| Fig. 4 Solid state infrared spectra of TFSA·nH2O: (a) n = 0 at 173 K, (b) n = 0.5 at 158 K, (c) n = 1 at 299 K, (d) n = 2 at 158 K, (e) n = 4 at 175 K, (f) n = 5 at 200 K, (g) ice Ih at 200 K. | ||
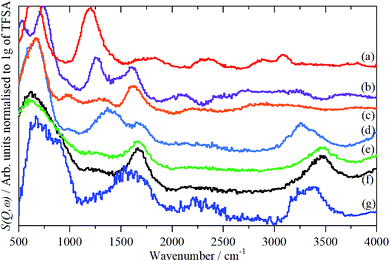 | ||
| Fig. 6 INS (MAPS) spectra of TFSA.nH2O at <20 K: (a) n = 0, (b) n = 0.5, (c) n = 1, (d) n = 2, (e) n = 4, (f) n = 5, (g) ice Ih. Relative to (d)–(f); (a)–(c) ×2 ordinate expanded. | ||
As with Nafion, the infrared spectra below 1500 cm−1 are dominated by skeletal modes, in this case of the [CF3SO3]− ion, Fig. 4, as are the Raman spectra (where they are available, Fig. S11, S12, S15, S17, S19†). In the infrared spectra, there is little change between the liquid and solid states for the [CF3SO3]− ion modes. Comparison of Fig. 4a–c and 5a–c show that, as might be expected, the spectrum of the n = 0.5 compound is a simple summation of the spectra of the parent acid and that of the monohydrate.
The availability of both the infrared and the INS spectra enables the key features of the various species to be assigned by inspection. The results are given in Table 2. From this, and the spectra, several trends are apparent. As the oxonium ion becomes larger, the O–H stretch shifts to higher energy. This is a reflection of the weaker hydrogen bonding present between water and the central H3O+ ion than that between sulfonate and the ion. Thus, in the n = 1 compound, there are three H-bonds to sulfonate; in the n = 2 there are two and one to water; in n = 4 and 5 there are none to sulfonate and three to water. The asymmetric bending mode also shifts to higher energy as n increases. In the infrared spectrum of the n = 2 compound (Fig. 5d), a shoulder is apparent on the low energy side of the asymmetric bending mode, this is more apparent in the n = 4 and 5 compounds. This is assigned to the bending mode of the H-bonded water molecules. All of the spectra of the n = 4 and 5 compounds are strikingly similar, suggesting that the additional water molecule only causes a minor perturbation to the H9O4+ ion found in the n = 4 material.
| Description | Species | ||||
|---|---|---|---|---|---|
| Ice | n = 0 | n = 1 (H3O+) | n = 2 (H5O3+) | n = 4 (H9O4+) | |
| a oop = out-of-plane S–O–H bend, ip = in-plane S–O–H bend.b asym = asymmetric bend, sym = symmetric bend.c sh = shoulder. | |||||
| O–H stretch | 3215, 3380 | 3090 | 2850 | 3260, 3380 | 3460 |
| O–H bend | 1580 | 685 (oop), 1185 (ip)a | 950 (sym), 1616 (asym)b | 1640 (sh),c 1730 | 1644, 1746 |
| Librations | 535–1000 | 480–830 | 470–810 | 370–1040 | |
| Translations | 20–325 | 20–300 | 20–270 | 20–260 | |
The translational (0–300 cm−1) and librational (450–1000 cm−1) modes of water in ice and the n = 0.5, 1 and 2 compounds give sharp bands, as expected for ordered structures. In contrast, the bands of the n = 4 and 5 compounds are broad with little structure and are much more characteristic of those seen for disordered water on surfaces.20–22
From the ratio of water to sulfonic acid in Table 1 and by knowing how the protons are organised in the TFSA·nH2O compounds, we can deduce how the water is present in the Nafion samples. Thus Nafion dried at 180 °C would be expected to only contain sulfonic acid groups; the samples dried in the glove box and over P2O5 would contain only H3O+ ions; the as-received and dried over MgCl2 samples would contain largely H9O4+ ions and the sample soaked in water would be a mixture of H9O4+ ions and water.
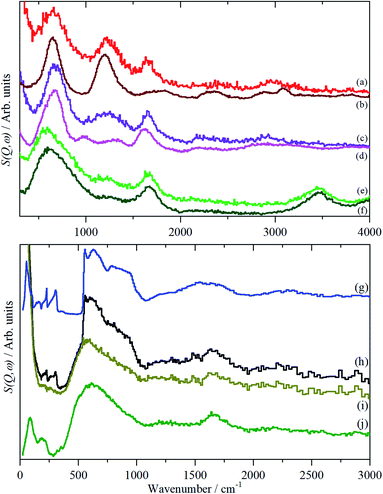
A comparison of the spectra of Nafion with the appropriate model compound supports these assignments, Fig. 7. The infrared and INS spectra of Nafion support these assignments. In the infrared spectra, Fig. 1a–c, the broad bands at 2500–3000 cm−1 are characteristic of the electrical anharmonicity caused by the strong hydrogen-bonding present with the H3O+ ion, (we believe that its presence in the fully dried material, Fig. 1a, is the result of re-adsorption of water by the sulfonic acid groups at the surface, as the INS spectrum, Fig. 3a, which is a bulk measurement, shows only sulfonic acid). As the hydration levels increase, the O–H stretch bands move to higher energy as seen for the TFSA·nH2O compounds.
Compilations of each type of spectra recorded are presented in the ESI†: Nafion Fig. S2–S7† and TFSA and its hydrates in Fig. S8–S17.†
Conclusions
In this work we have characterised the state of hydration of a Nafion membrane as a function of water content by comparison to series of model compounds of defined structure.It is surprisingly difficult to dehydrate Nafion: an extended period at high temperature is required to remove all the water and just leave the sulfonic acid groups. Hydroxonium, H3O+, groups are present at low water contents. For the as received membrane, water is present as a complex oxonium ion, H9O4+. Addition of more water molecules by immersion in water does not change this ion, rather the additional water is present as unperturbed water molecules. This is shown by the formation of ice Ih. Subtraction of the ice contribution to the spectrum, Fig. 7i, shows that approximately 50% of the water is present in this form and this is presumably also the case for the working material.
The results presented here support the current models of proton transport in Nafion (reviewed in ref. 23). These show that at low hydration levels, the conductivity is largely by diffusion of H3O+ ions, above 5 wt% H2O molecular dynamics24 studies show that the H9O4+ ion becomes increasingly important and that the conduction mechanism is dominated by Grotthuss hopping between ions. Our results show that below 5 wt%, only H3O+ ions are present, at higher water concentrations the H9O4+ ion is present and at saturation, unbound water is also present, that facilitates the Grotthuss proton transport mechanism.
Conflicts of interest
There are no conflicts to declare.Acknowledgements
The STFC Rutherford Appleton Laboratory is thanked for access to neutron beam facilities.25,26 This research has been performed with the aid of facilities at the Research Complex at Harwell, including the FT-Raman spectrometer. The authors would like to thank the Research Complex for access to, and support of, these facilities and equipment.References
- K. A. Mauritz and R. B. Moore, Chem. Rev., 2004, 4535–4585 CrossRef CAS.
- C. Heitner-Wirquin, J. Membr. Sci., 1996, 120, 1–33 CrossRef.
- R. S. K. Kunimatsu, K. Miyatake and T. Tsuneda, Macromolecules, 2016, 49, 6621–6629 CrossRef.
- D. Ostrovskii, A. Brodin and L. Torell, Solid State Ionics, 1996, 85, 323–327 CrossRef CAS.
- A. Gruger, A. Régis, T. Schmatko and P. Colomban, Vib. Spectrosc., 2001, 26, 215–225 CrossRef CAS.
- D. Waren and A. McQuillan, J. Phys. Chem. B, 2008, 112, 10535–10543 CrossRef.
- D. Hofmann, L. Kuleshova, B. D'Aguanno, V. D. Noto, E. Negro, F. Conti and M. Vittadello, J. Phys. Chem. B, 2009, 113, 632–639 CrossRef CAS.
- S. Morita and K. Kitagawa, J. Mol. Struct., 2010, 974, 56–59 CrossRef CAS.
- A. Aquino and D. Tunega, J. Phys. Chem. C, 2017, 49, 6621–6629 Search PubMed.
- P. C. H. Mitchell, S. F. Parker, A. J. Ramirez-Cuesta and J. Tomkinson, Vibrational spectroscopy with neutrons, with applications in chemistry, biology, materials science and catalysis, World Scientific, Singapore, 2005 Search PubMed.
- S. F. Parker, D. Lennon and P. Albers, Appl. Spectrosc., 2011, 65, 1325–1341 CrossRef CAS.
- K. Bartmann and D. Moot, Acta Crystallogr., Sect. C: Cryst. Struct. Commun., 1990, 46, 319–320 CrossRef.
- R. Delaplane, J. Lundgren and I. Olovsson, Acta Crystallogr., Sect. B: Struct. Sci., Cryst. Eng. Mater., 1975, 31, 2208–2213 CrossRef.
- J. Spencer and J. Lundgren, Acta Crystallogr., Sect. B: Struct. Crystallogr. Cryst. Chem., 1973, 29, 1923–1928 CrossRef CAS.
- J. Lundgren, R. Tellgren and I. Olovsson, Acta Crystallogr., Sect. B: Struct. Crystallogr. Cryst. Chem., 1978, 34, 2945–2947 CrossRef.
- J. Lundgren, Acta Crystallogr., Sect. B: Struct. Crystallogr. Cryst. Chem., 1978, 34, 2428–2431 CrossRef.
- R. Pinna, S. Rudić, S. F. Parker, J. Armstrong, M. Zanetti, G. Škoro, S. P. Waller, D. Zacek, C. A. Smith, M. J. Capstick, D. J. McPhail, D. E. Pooley, G. D. Howells, G. Gorini and F. Fernandez-Alonso, Nucl. Instrum. Methods Phys. Res., Sect. A, 2018, 896, 68–74 CrossRef CAS.
- R. A. Ewings, J. R. Stewart, T. G. Perring, R. I. Bewley, M. D. Le, D. Raspino, D. E. Pooley, G. Škoro, S. P. Waller, D. Zacek, C. A. Smith and R. C. Riehl-Shaw, Rev. Sci. Instrum., 2019, 90, 035110 CrossRef CAS.
- https://www.isis.stfc.ac.uk/Pages/home.aspx.
- Y. Wang and S. Dong, Phys. Rev. B: Condens. Matter Mater. Phys., 2003, 68, 172201 CrossRef.
- H.-W. Wang, M. J. DelloStritto, N. Kumar, A. I. Kolesnikov, P. R. C. Kent, J. D. Kubicki, D. J. Wesolowski and J. O. Sofo, J. Phys. Chem. C, 2014, 118, 10805–10813 CrossRef CAS.
- S. F. Parker, S. J. Robertson and S. Imberti, Mol. Phys., 2019, 117, 3417–3423 CrossRef CAS.
- A. Kusoglu and A. Z. Weber, Chem. Rev., 2017, 117, 987–1104 CrossRef CAS.
- S. Cui, J. Liu, M. E. Selvan, D. J. Keffer, B. J. Edwards and W. V. Steele, J. Phys. Chem. B, 2007, 111, 2208–2218 CrossRef CAS.
- S. F. Parker, STFC, ISIS Neutron Muon Source, 2018, DOI:10.5286/ISIS.E.RB1910022.
- S. F. Parker, STFC, ISIS Neutron Muon Source, 2019, DOI:10.5286/ISIS.E.RB1920052.
- J. Lundgren, Acta Crystallogr., Sect. B: Struct. Crystallogr. Cryst. Chem., 1978, 34, 2432–2435 CrossRef.
Footnotes |
| † Electronic supplementary information (ESI) available. See DOI: 10.1039/d0ra00791b |
| ‡ Current address: 25 Friern Mount Drive, London, N20 9DP. |
| This journal is © The Royal Society of Chemistry 2021 |

