
 Open Access Article
 This Open Access Article is licensed under a Creative Commons Attribution-Non Commercial 3.0 Unported Licence
Pressure-driven electronic phase transition in the high-pressure phase of nitrogen-rich 1H-tetrazoles†
Ying Liu‡
 ab,
Huifang Du‡c,
Leiming Fang‡d,
Fei Sune,
Haipeng Sua,
Zhongxue Ge*a,
Wei Guo*c and
Jinlong Zhu*be
ab,
Huifang Du‡c,
Leiming Fang‡d,
Fei Sune,
Haipeng Sua,
Zhongxue Ge*a,
Wei Guo*c and
Jinlong Zhu*be
aXi'an Modern Chemistry Research Institute, Xi'an, 710065, China. E-mail: gzx204@sina.com
bDepartment of Physics, Shenzhen Engineering Research Center for Frontier Materials Synthesis at High Pressures, Southern University of Science and Technology, Shenzhen 518055, China. E-mail: zhujl@sustech.edu.cn
cBeijing Key Laboratory of Nanophotonics and Ultrafine Optoelectronic Systems, School of Physics, Beijing Institute of Technology, Beijing 100081, People's Republic of China. E-mail: weiguo7@bit.edu.cn
dKey Laboratory for Neutron Physics, Institute of Nuclear Physics and Chemistry, China Academy of Engineering Physics, Mianyang 621900, China
eCenter for High Pressure Science and Technology Advanced Research (HPSTAR), Beijing 100094, China
First published on 17th June 2021
Abstract
High-energy-density materials (HEDMs) require new design rules collected from experimental and theoretical results and a proposed mechanism. One of the targeted systems is the nitrogen-rich compounds as precursors for possible polymeric nitrogen or its counterpart in a reasonable pressure range. 1H-tetrazole (CH2N4) with hydrogen bonds was studied under pressure by both diffraction and spectroscopy techniques. The observed crystal structure phase transition and hydrogen bond-assisted electronic structure anomaly were confirmed by first-principles calculation. The rearrangement of the hydrogen bonds under pressure elucidates the bonding interactions of the nitrogen-rich system in local 3D chemical environments, allowing the discovery and design of a feasible materials system to make new-generation high-energy materials.
Introduction
Nitrogen-rich compounds have attracted considerable attention due to their potential as high-energy-density materials (HEDMs).1–6 Their high-energy contents are closely related to a large amount of energy released upon decomposition of single- and/or double-bonded nitrogen in a condensed phase into triple-bonded gas-phase diatomic N2 molecules. The critical challenge is to form relatively stable single-bond or double-bonded nitrogen polymorphs when these states are metastable compared with the easily formed and fairly stable triple bonds.7,8 Alternatively, high pressure can be an effective tool to manipulate structural configuration and, therefore, the stereo-chemical bond environment for the possible novel dimer, trimer, or new polymer polymorphs. Some unsaturated organic molecules tend to form a more saturated polymer with an extended structure and higher density under pressure.9–11 For instance, several structures of polymeric nitrogen have been predicted to exist under extreme high-pressure conditions, such as cubic-gauche (cg-N), and layered (LP-N) polymeric nitrogen.12–16 Polymeric nitrogen, a pure single-bonded nitrogen compound, has attracted much interest because of the significant difference between the single bond (∼160 kJ mol−1) and triple bond (∼946 kJ mol−1). However, the transitions to single-bonded nitrogen polymers in the cubic gauche phase (cg-N) require extremely high pressure above 110 GPa and temperature higher than 2000 K. Furthermore, this dense state of nitrogen eventually transforms back to its precursor N2 counterpart once the pressure is released below 42 GPa. Therefore, the first obstacle to overcome for possible practical application is to decrease the phase transition pressure to ambient conditions or at least lower than 30 GPa, which can be generally realized using a large volume press. Hydrogen bonds in small organic molecules or large proteins play a key role in maintaining their structures,17 and more importantly, they can be easily tuned by pressure by rearrangement,18,19 reconstruction, and,20,21 their symmetrization.22,23 Therefore, hydrogen-bonded molecular crystals can undergo a series of structural and conformational changes as well as hydrogen-bond-assisted polymerization24 upon an increase of pressure. Here, we chose 1H-tetrazole (CH2N4), composed of a single and double bonding ring with 80% nitrogen content by weight as the starting precursor to consider the reduction of the energetic barrier for possible polymerization under high pressure. Its ambient structure has a layered triclinic structure (P1, with one molecular in unit cell) with N–H⋯N and C–H⋯N 2D hydrogen-bonded network.25 It is expected that these typical unsaturated nitrogen-rich molecules will polymerize more easily into nitrogen-rich extended compounds. Secondly, it has been reported that the amorphous high-pressure phase of 1H-tetrazole (CH2N4) can be quenched to ambient pressure,26 which could meet the requirement of possible high-energy and density metastable phase acquisition at ambient conditions. Also, in the report of 1H-tetrazole (CH2N4), Li et al.26 reported a phase transition at 3 GPa and an amorphous transition at ∼14 GPa up to 50 GPa with irreversibility.In this study, we investigated the phase transition of 1H-tetrazole under high pressure at room temperature using in situ Raman, IR spectra, synchrotron X-ray diffraction (XRD) and neutron diffraction techniques. Combined with first-principles calculations, we propose a possible hydrogen-bond-assisted phase transition in the high-pressure counterpart, which has not been reported in previous studies. We uncover the novel electronic and stereo-chemical evolution of 1H-tetrazole (CH2N4), providing a fundamental understanding of the nitrogen-rich system and a potential pathway to find a targeted system for new-generation high-energy materials.
Results and discussion
Fig. 1 plots the crystal structures of 1H-tetrazole at ambient conditions and high pressures, respectively. Similarly, there is a phase transition from the low-pressure phase25 starting at ∼3 GPa to the high-pressure phase at 4 GPa. For the high-pressure phase, by DFT theoretical optimum, the structure we obtained is also belongs to P1 space group with two non-equivalent molecules CH2N4 in unit cell, but slightly different to the structure adopted in ref. 26. The tetrazole molecule orientation in the ambient phase is denoted as type-O along the a-axis and denoted as type-A and type-B for the non-equivalent molecules in the high-pressure phase. The ambient phase is a standard layered structure with hydrogen bonds formed in each layer. While the high-pressure phase changes to a 3D structure.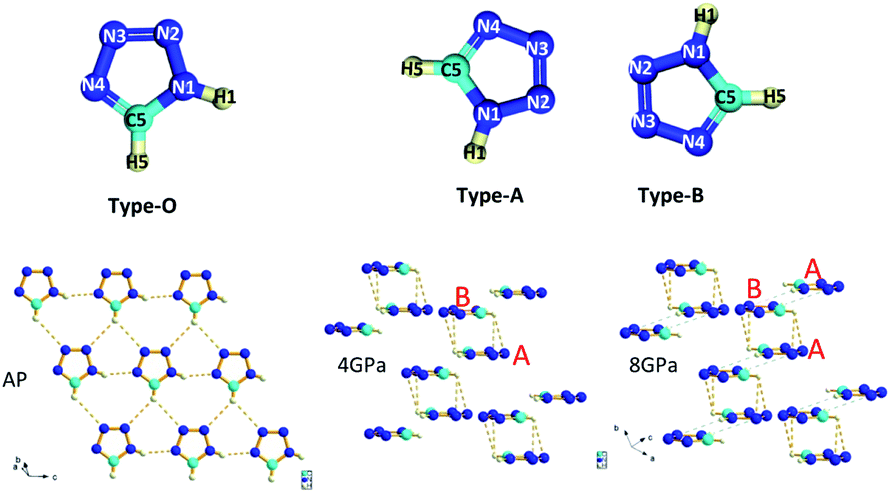 | ||
| Fig. 1 Ambient and high-pressure crystal structures for 1H-tetrazole. The details are listed in Tables S1 & S2.† Type-O has N1–H1 along 4 o'clock, C5–H5 along 6 o'clock; type-A has N1–H1 along 7 o'clock, C5–H5 along 9 o'clock; type-B has N1–H1 along 1 o'clock, C5–H5 along 3 o'clock, respectively. The molecular orientation of type-A and type-B on the top is the up-view of the crystal structure. The orange dashed lines represent the hydrogen bonds and the translucent green dashed lines indicates that newly proposed hydrogen bonds will form at ∼10 GPa. | ||
As the pressure increases, the intralayer hydrogen-bonds of the ambient phase gradually change to the interlayer hydrogen close contacts of the high-pressure phase, where new hydrogen-bonds C5–H5⋯N2 and C5–H5⋯N3 form between the two layers. Thus, a pair of type-As and type-Bs molecules were coupled by hydrogen bonding interaction presented by orange dashed lines. Based on this configuration, the behavior of directional hydrogen bonding interaction and repulsion of the lone pair electrons on nitrogen in the type-A and type-B molecules under external compression leads to gradually decreasing of layer spacing, as well as sliding between interlayers, as demonstrated in Fig. 1. The sub-lattice of type-A heterocyclic ring shifts to the left relatively to sub-lattice of type-B as the increase of pressure, resulting in type-A-type-B molecules more overlapped, and an anticipated H–π interaction denoted by translucent green dashed lines in Fig. 1. Simultaneously, the entangled angle changes of P1 structure were plotted in Fig. 2. The angle γ is mainly related to the layered distance of the coupled type-As and type-Bs molecular planes. The increase of angle α and decrease of angle β both related to the relative position sliding in the direction perpendicular to the molecular planes. As the pressure increasing, these will further wrinkle the layers and increase the energy of crystal as the distortion increasing in Fig. 1, the schematic show of 8 GPa structure. Two runs of synchrotron X-ray diffraction (XRD) of higher pressure were conducted to further investigate the structure evolution, as plotted in Fig. S1 & S2.† By employing the rigid body model in the GSAS II software package, we conducted a sequential refinement with pressures of 4 GPa, 6 GPa and 8 GPa of the neutron data and the refined volume was plotted in Fig. S2† with X-ray results. The abnormal volume increase at ∼10 GPa as shown in Fig. S2† could be from the shear stresses in the DAC, which is exaggerated by the layered character of the crystal structure. A proposed new H–π interaction between type-As and type-Bs layers forms at pressure of ∼10 GPa, where the anomaly of crystal angle shows up in Fig. 2b and c. This new hydrogen bonding interaction, confirmed further by the spectroscopic data, will release part of the energy for staying in the same structure at high pressure. The detailed, refined parameters are listed in Tables S1 & S2.†
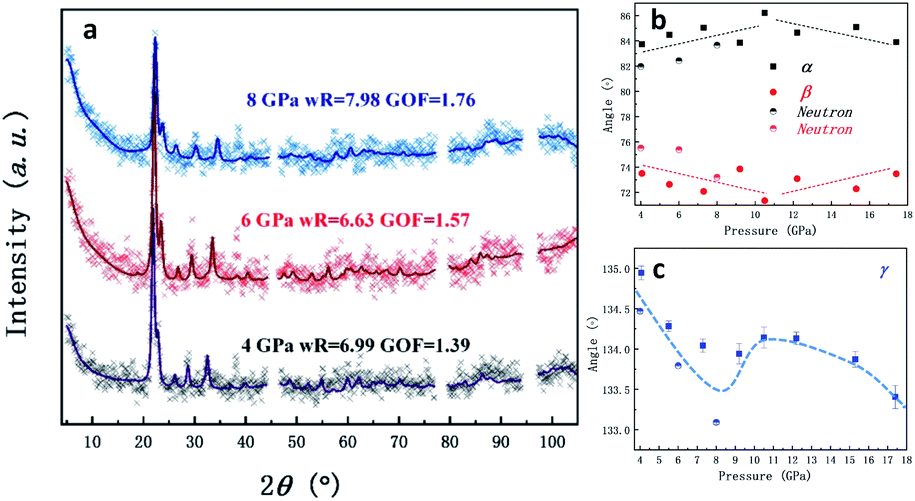 | ||
| Fig. 2 (a) Neutron diffractions patterns of 1H-tetrazole as a function of pressure (the diffraction patterns of X-ray under pressure are plotted in Fig. S1†). The excluded region is the diffraction from the Al gasket; (b) and (c) angle parameter evolutions of the high-pressure 1H-tetrazole phase (the dot lines are guiding for the eyes). The anomaly at around 9 GPa is proposed to be related to the newly-formed hydrogen bonding interaction. | ||
The Raman and IR transmittance spectra collected at near ambient pressure are shown in Fig. S3† of the ESI and are consistent with previous reports.26,27 The detailed assignment of different crystal vibrational modes is provided in Table S3.†9,26,28 We also observed three additional Raman modes at 107, 130, and 159 cm−1 in the lattice-based vibrational region, which correspond to the intermolecular vibrations. Briefly, the readers should pay attention to the C–H vibrational mode at wavenumbers higher than 3000 cm−1 and N–N vibrational modes located between 1000 cm−1 and 1100 cm−1 for both Raman and IR, which show an apparent anomaly at ∼9 GPa.
In situ high-pressure Raman and IR spectra are plotted in Fig. 3a and b, and the Raman spectra in a particular spectral region are presented in Fig. S4 in the ESI.† As shown, upon compression to 4.0 GPa, new Raman peaks emerge at 180 cm−1, 956 cm−1, 1083 cm−1, and 1138 cm−1, respectively, which is more likely to be indicative of the appearance of Davydov splitting such as stated in Cui's work.26,29 However the result of non-hydrostatic compression can not be excluded. This type of splitting may be caused by enhanced interactions between non-equivalent molecules, as shown in the high-pressure crystal structure in Fig. 1. Similarly, the IR mode at 951.5 cm−1 observed at ambient conditions and corresponding to the in-plane bending mode δ(N![[double bond, length as m-dash]](https://www.rsc.org/images/entities/char_e001.gif) C–N) disappears. Simultaneously, a new IR mode at 1258 cm−1 caused by the splitting of the ν(C5–N1) mode emerges, further indicating the relevance of the first phase transition to the reduced crystal structure symmetry. The dependencies of both the Raman and IR shift on pressure are plotted in Fig. 4.
C–N) disappears. Simultaneously, a new IR mode at 1258 cm−1 caused by the splitting of the ν(C5–N1) mode emerges, further indicating the relevance of the first phase transition to the reduced crystal structure symmetry. The dependencies of both the Raman and IR shift on pressure are plotted in Fig. 4.
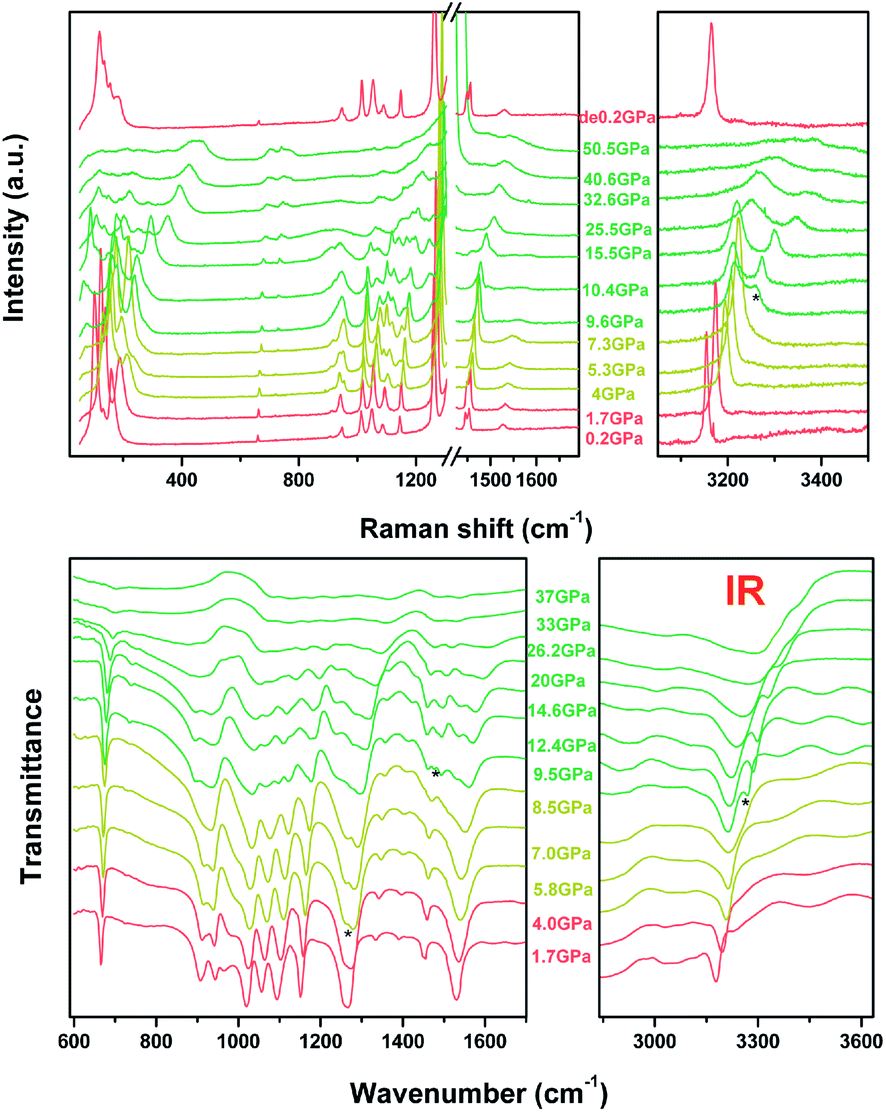 | ||
| Fig. 3 Raman and IR changes of 1H-tetrazole as a function of pressure, respectively. | ||
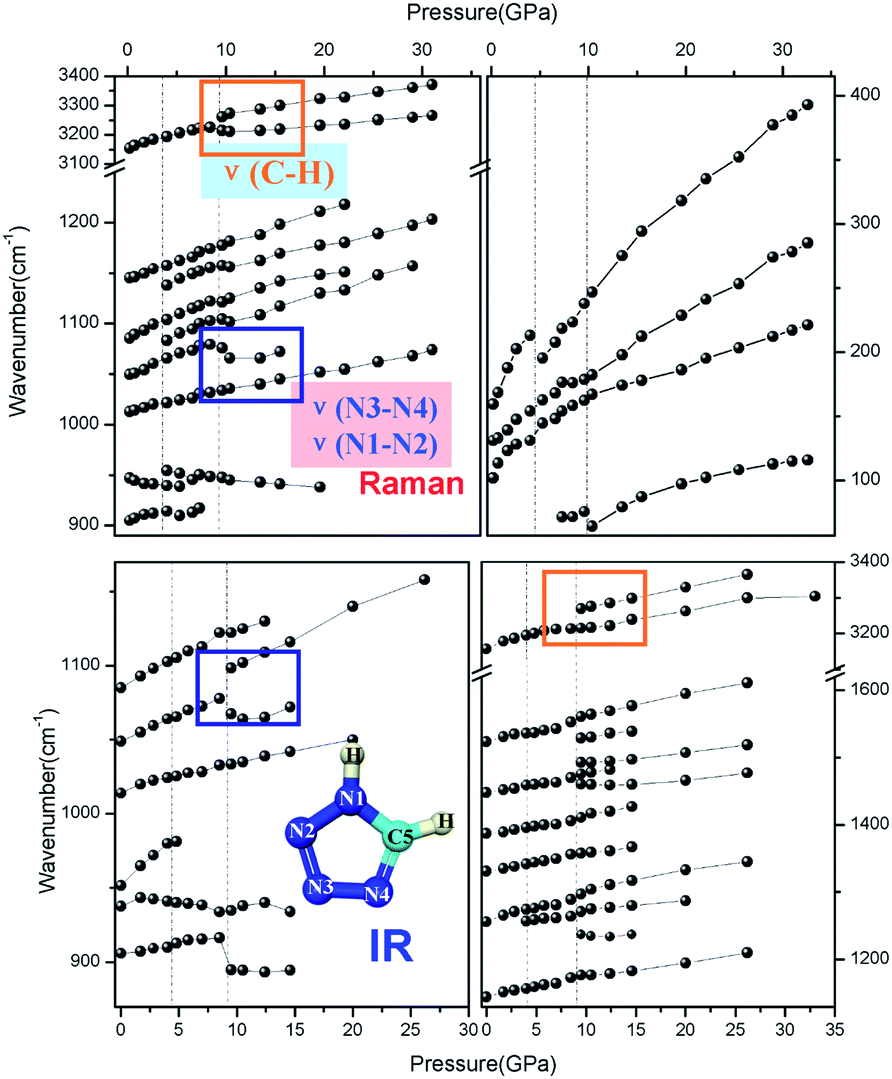 | ||
| Fig. 4 Vibration modes changes at ∼9 GPa accompanying the structure anomaly. | ||
As expected, most of the vibrational modes exhibit a substantial blue shift under increasing pressure, and only a few modes display a red shift. First, the Raman vibrational mode of δ(NC–N) at 947 cm−1 and the IR mode of δ(NN–N) at 937 cm−1 exhibit a red shift under pressure, which may indicate the disappearance of the original hydrogen bond accompanied by the gradual formation of the new interlayer hydrogen-bonds of C5–H5⋯N2 and C5–H5⋯N3 with increasing pressure, eventually resulting in the phase transition. From a static crystal structure framework perspective, the refined NC–N and NN–N bond length and the bend angle of the newly formed hydrogen bond support such an unusual red shift. This also implies that the newly formed hydrogen bond causes a decrease of the vibration energy, which accordingly stabilizes the molecule in the new high-pressure phase. Furthermore, the new Raman peak at 956 cm−1 that splits from the δ(NC–N) mode also shows a pressure-dependent red shift before vanishing. Additionally, the γ(C5–H5) mode at 906 cm−1 shows a sudden drop at 4 GPa, which might be connected with the change of spatial configuration and the conversion from the original hydrogen-bond C5–H5⋯N2 and C5–H5⋯N3 between neighboring molecules in the same layer, which are connected between the adjacent layers during the structural phase transition to the high-pressure phase.
Both Raman and IR spectroscopic data indicated that, upon a continuous increase of pressure, there is a transition at ∼9–10 GPa, while the crystal structure remains unchanged. The 9–10 GPa anomaly has some signature changes; both the Raman and IR spectra show that at wave number 3211 cm−1, the C–H stretching vibration splits into two modes along with the original ν(C5–H5) mode showing a temporary significant red shift. At the same time, the out-of-plane C5–H5 bending IR mode at 907 cm−1 and the C5–H5 bending Raman mode at 1085 cm−1 display a sudden drop. Meanwhile, the N4C5 vibrational mode at 1550 cm−1 disappears at a pressure above 10 GPa; the N4–N3 mode at 1075 cm−1 softens simultaneously; the IR mode of δ(NN–N) at 937 cm−1 exhibits a V-shape via pressure, and the N1–N2 vibration mode remains unchanged. In addition, the peaks at 1083 cm−1 and 1138 cm−1 appear when the phase transition displays a slight red shift. Several small peaks or shoulders appear near the C5–N1 stretching vibrations, and also between C5N4 and N2N3 stretching vibrations.
This comprehensive evolution indicates that the new H–π interaction formed and its surrounding electronic configuration changed with a further increase of pressure. Considering the interlayer slip via pressure, we speculate that at around 9–10 GPa the N1–H1⋯π hydrogen bond formed between the new type-As and type-Bs molecule pairs in the adjacent layer as forecasted in Fig. 1. Based on this speculation, the tetrazole heterocyclic ring of one type-B(A) molecule can be donors of two different type-A(B) molecules in the adjacent layer. With the new N1–H1⋯π bond formed, the charge centre of the donor deviates to the new linked adjacent molecule. Therefore, the bonds of C5–H5 and the ring vibration change accordingly, resulting in the observed anomalies in the Raman and IR spectra. According to the refined high-pressure angle parameters, the angle γ turned to increasing from decreasing at ∼9–10 GPa, which is caused by the change of interaction between the coupled molecular planes and consistent with the trends of several vibration modes, such as the stretching of N3–N4 and bending mode of C5–H5. Thus, the new hydrogen bonding interaction between the interlayer molecules is most likely due to the occurrence of an electronic phase transition at around 9–10 GPa.
Using DFT calculations to optimize the lattice obtained from our experiments, we found that the lattice parameters and bond lengths were abnormal near 9 GPa, consistent with the observed anomaly in our experimental results. We have calculated phonon dispersion relations at 8 GPa, shown as Fig. S5.† No imaginary phonon frequency is found in the whole Brillouin zone, which reveals that the structure of 1H-tetrazole may be stable under this pressure in theory. To observe the abnormality of its electronic structure, we have calculated its electronic band structure and density of states (DOS) at different pressures. Fig. S6† shows the electronic band at different pressures and the change of band gap. By observing the change in band gap, we found that an anomaly occurred near 9 GPa. Fig. 5 summarizes the variation of the DOS at 8 GPa, 9 GPa, and 10 GPa. Fig. 5a reveals that both the conduction band and the valence band reduce in energy from 8 GPa to 9 GPa, while they shift higher energy from 9 GPa to 10 GPa. We quantitatively calculated the band centers of the conduction band and valence band around 9 GPa, confirming that these energy shifts caused the structural anomaly. For the specific values, see Table S4.† The PDOS of C 2p N 2p and H 1s is shown in Fig. 5b. We also calculated the band centers of these atoms, as shown in Table S5.† The changes in the unit-cell, bond length, and electronic structures are all consistent, indicating that they are nonlinear with respect to the increasing pressure from 8 to 10 GPa.
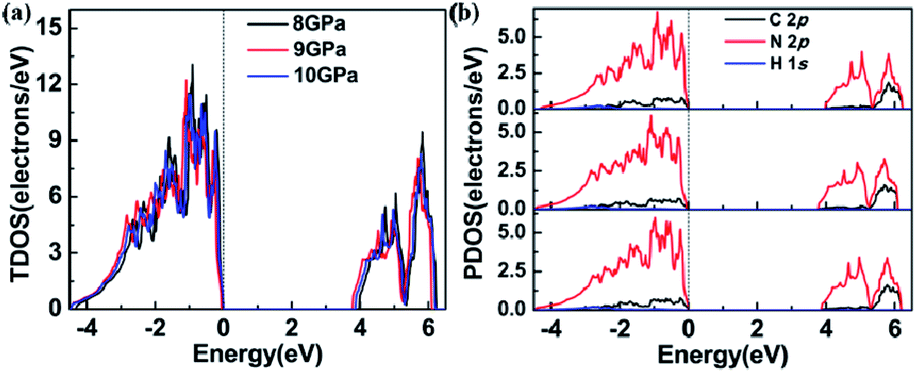 | ||
| Fig. 5 (a) The total density of states (TDOS) of 1H-tetrazole and (b) the projected density of states (PDOS) of atoms C, N, and H at 8 GPa, 9 GPa, and 10 GPa, respectively. The dotted line represents the Fermi energy level. | ||
To understand the structural anomaly near 9 GPa, we calculated the phonon density of states (PHDOS) of 1H-tetrazole, as shown in Fig. 6. The frequencies of 1H-tetrazole at Gamma at 8 GPa, 9 GPa, 10 GPa are listed in Table S6.† We observed that the most obvious change in PHDOS at pressures from 8 GPa to 10 GPa is the intensity of the peak at 860 cm−1 and the peak position at 2400 cm−1. Fig. 6b–d show that the vibrational modes from the N and H atoms are the main contribution from the low frequency at 860 cm−1 and the high frequency at 2400 cm−1, respectively. The vibrational intensity of the N atoms at 860 cm−1 increases from 8 GPa to 9 GPa, but decreases from 9 GPa to 10 GPa. At 2400 cm−1, the vibration of the H atom moves toward high frequency from 8 GPa to 9 GPa and then moves toward low frequency from 9 GPa to 10 GPa. This nonlinear change in the vibrational modes of the N and H atoms near 9 GPa may be due to the formation of new hydrogen bonds between the interlayer molecules, which is consistent with the experimental results.
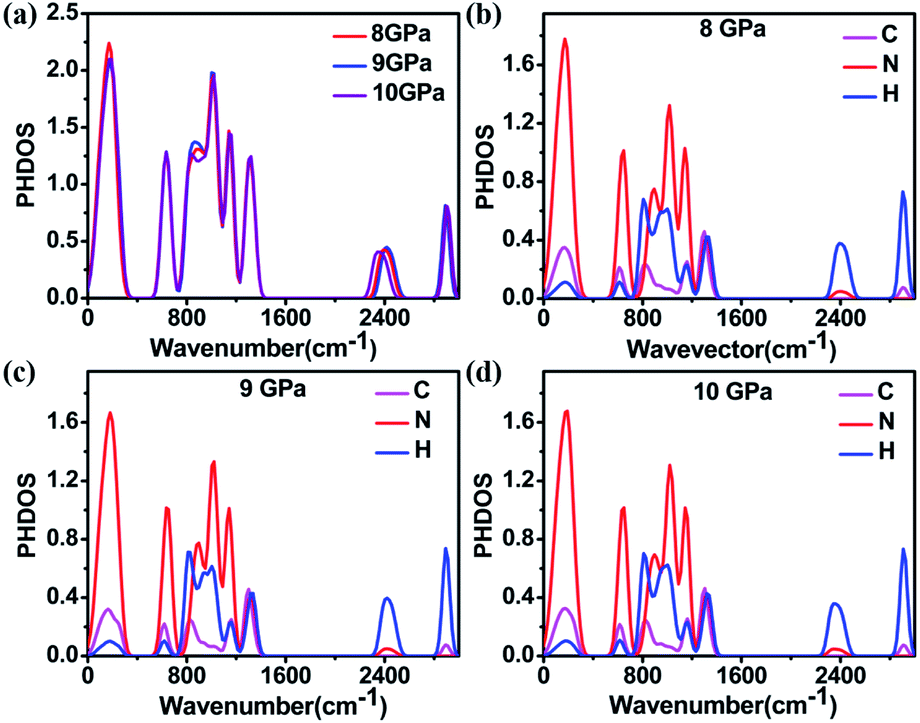 | ||
| Fig. 6 (a) The total and (b)–(d) projected phonon density of states (PHDOS) of 1H-tetrazole at 8 GPa, 9 GPa, and 10 GPa. | ||
Experimental section
1H-tetrazole was purchased from Innochem (98%, A78881) and used in experiments without any further purification. For the in situ Raman and synchrotron X-ray diffraction (XRD) experiments, the samples were loaded into a symmetric-type diamond-anvil cell (DAC) with a pair of type-I diamond anvils with a culet size of 300 μm. A pair of type II diamond anvils was used for the IR experiment. The T301 stainless steel gasket between the two diamond anvils was pre-indented to about 30 μm in thickness. A hole with a diameter of 110 μm was drilled into the center for the sample chamber. The pressure was determined by the ruby R1 fluorescence line shift30–32 and the Raman edge of the diamond.33 For the Raman and XRD experiments, only the sample with two ruby balls was loaded into the sample chamber. No pressure-transmitting medium was used because 1H-tetrazole is as soft as NaCl. For the in situ IR spectra experiment, spectral quality KBr powders were also loaded into the chamber to use as both a pressure-transmitting medium and to dilute the sample as background.The high-pressure Raman experiments were conducted through a HORIBA HR EVOLUTION Raman microscope with a liquid-nitrogen-cooled CCD detector and spectral resolution of about 1 cm−1. The exciting laser had a wavelength of 532 nm. High-pressure in situ IR spectra were collected in a Bruker VERTEX 80V FTIR spectrometer and HYPERION 2000 IR microscope, which was operated under a vacuum of <3 hPa. The IR beam was set to a spot size of 20 × 30 μm by a pair of knife-edge diaphragms. The IR spectra were recorded using a nitrogen-cooled broad-band mercury cadmium telluride detector. The spectral resolution was 4 cm−1. The Raman spectrum of the sample quenched from 50 GPa returned to the original state, indicating that the local chemical environment was still preserved, and the amorphization reported in ref. 26 could be due to different pressurization routes and history. For instance, the pressurization rate/step and hydrostatic degree could play important roles in the amorphization of small molecular crystals. However, this is beyond the scope of this work and will not be discussed here.
High-pressure angle-dispersive X-ray was used for monitoring the structural change of the 1H-tetrazole sample and performed at Cornell High Energy Synchrotron Source (CHESS) at room temperature.34 The X-ray wavelength was λ = 0.4859 Å, and the diffracted X-rays were detected by an imaging plate (Mar345). To elaborate the refined results, the second experimental run was conducted at the 4W2 High Pressure Station of Beijing Synchrotron Radiation Facility (BSRF), where the X-ray wavelength was λ = 0.6199 Å.
High-pressure neutron diffractions was collected at HPND beamline of CMRR. PE-cell with polycrystalline nano-diamond anvil and Al gasket was used for high pressure experiments at room temperature. The wavelength was λ = 1.5925 Å.
XRD patterns were integrated from the images with FIT2D and GSAS II software,35,36 and then refined with GSAS I and GSAS II37,38 for additional analysis. The lattice parameters were obtained by LeBail fitting of all the X-ray data. Since a P1 structure has 6 refinable parameters, plus one for intensity, and 3 more per 1H-tetrazole (using a rigid body model,37 we only refined 3 parameters (x,y,z) for the molecule's center of mass position). Additionally, peak shape, thermal displacements were also refined. The background was fitted in advance for reducing the refine parameters. In total, 15 parameters were refined. Considering the compressibility of C–C, as in graphite only 0.01–0.02 A changes in 10 GPa, which is within the error bar and resolution range, so the bond length in the rigid body was fixed as ambient ones and not refined for the three pressure data points.38
A DFT calculation based on our refined crystal structure was performed. The atomic positions were optimized at each fixed pressure. The geometric optimization and electronic property calculation were performed using the Vienna Ab Initio simulation package (VASP) program39 based on the density functional theory (DFT).40 The exchange–correlation function was described by the Perdew–Burke–Ernzerh (PBE) of the generalized gradient approximation (GGA).41 The C 2s22p2, N 2s22p3, and H 1s1 orbitals were explicitly included as valence electrons. The intermolecular van der Waals interactions42,43 (DFT-D3) were implemented in the structural optimization. A plane-wave basis set cutoff of 550 eV and a k-mesh grid of 5 × 7 × 7 for Brillouin zone sampling44 were chosen. The convergence criterion of the energy and force in the ionic relaxation was set as 10−5 eV and 0.02 eV Å−1 in the simulation. The phonon density of state was calculated using the supercell method with the PHONOPY code.45
Conclusions
In summary, the high-pressure phase of 1H-tetrazole is a dimer like bi-molecular phase with a 3D network consisting of C5–H5⋯N2 and C5–H5⋯N3 hydrogen bonds. Continuous compression destabilized the stability of the tetrazole molecular ring and, therefore, the vibrational modes, resulting in a new hydrogen-bonding configuration. This electronic state is a pre-state for the following molecular conjugation, as the 1s/2p electrons of N/C at the Fermi level show a strong redox feature, preparing for the formation of extra hydrogen bonds among the single molecules.Author contributions
Z. X. Ge and J. L. Zhu conceived and supervised this project. Y. Liu performed most of the high-pressure measurements with the assistance of F. Sun and H. P. Su. L. M. Fang performed the neutron diffraction measurements and data analysis. The calculations were carried out by H. F. Du and supervised by W. Guo. Y. Liu wrote the paper with support from J. L. Zhu. All authors contributed to the general discussion.Conflicts of interest
There are no conflicts to declare.Acknowledgements
This work was supported by National Science Foundation of China (Grant No. U1930401, No. 11904281), by open funding of Xi'an Modern Chemistry Research Institute (Grants No. SYJJ200303), by Fundamental Research Funds for the Central Universities (Grant No. 2017CX10007) and by Shenzhen Development and Reform Commission Foundation for Shenzhen Engineering Research Canter for Frontier Materials Synthesis at High Pressures. We thank Z. Wang for the helpful discussions. We acknowledge CHESS at Cornell University, which is primarily supported by the National Science Foundation. We acknowledge BSRF, which is supported by Chinese Academy of Sciences.Notes and references
- T. M. Klapötke and D. G. Piercey, 1,1’-Azobis(tetrazole):A Highly Energetic Nitrogen-Rich Compound with a N10 Chain, Inorg. Chem., 2011, 50, 2732–2734 CrossRef PubMed.
- Y. C. Li, Q. Cai and S. H. Li, et al., 1,1'-Azobis-1,2,3-triazole: A high-nitrogen compound with stable N8 structure and photo-chromism, J. Am. Chem. Soc., 2010, 132, 12172–12173 CrossRef CAS PubMed.
- R. P. Singh, R. D. Verma, D. T Meshri and J. M. Shreeve, Energetic Nitrogen-Rich Salts and Ionic Liquids, Angew. Chem. Int. Ed., 2006, 45, 3584–3601 CrossRef CAS PubMed.
- H. A. Rachid, A. G. Hu, V. Timoshevskii, Y. F. Song and L. Lussier, Nanoscale High Energetic Materials: A Polymeric Nitrogen Chain N8 Confined inside a Carbon Nanotube, Phys. Rev. Lett., 2008, 100, 196401 CrossRef PubMed.
- C. Zhang, C. G. Sun, B. C. Hu, C. M. Yu and M. Lu, Synthesis and characterization of the pentazolate anion cyclo-N5 in (N5)6(H3O)3(NH4) 4Cl, Science, 2017, 355, 374–376 CrossRef CAS PubMed.
- T. M. Klapötke, P. Mayer, C. M. Sabaté, J. M. Welch and N. Wiegand, Simple, Nitrogen-Rich, Energetic Salts of 5-Nitrotetrazole, Inorg. Chem., 2008, 47, 6014–6027 CrossRef PubMed.
- S. Duwal, Y.-J. Ryu, M. Kim, C.-S. Yoo, S. Bang, K. Kim and N. Hur, Transformation of hydrazinium azide to molecular N8 at 40 GPa, J. Chem. Phys., 2018, 148, 134310 CrossRef PubMed.
- Y. W. Li, X. L. Feng, H. Y. Liu, J. Hao, S. A. T. Redfern, W. W. Lei, D. Liu and Y. M. Ma, Route to high-energy density polymeric nitrogen t-N via He−N compounds, Angew. Chem. Int. Ed., 2018, 9, 722 Search PubMed.
- X. D. Wen, R. Hoffmann and N. W. Ashcroft, Benzene under High Pressure: a Story of Molecular Crystals Transforming to Saturated Networks, with a Possible Intermediate Metallic Phase, J. Am. Chem. Soc., 2011, 133, 9023–9035 CrossRef CAS PubMed.
- J. M. Sun, X. Dong and Y. J. Wang, et al., Pressure-Induced Polymerization of Acetylene: Structure-Directed Stereoselectivity and a Possible Route to Graphane, Angew. Chem. Int. Ed., 2017, 129, 6653–6657 CrossRef.
- H. Y. Zheng, K. Li and G. D. Cody, et al., Polymerization of Acetonitrile via a Hydrogen Transfer Reaction from CH3 to CN under Extreme Conditions, Angew. Chem. Int. Ed., 2016, 55, 12040–12044 CrossRef CAS PubMed.
- C. Mailhiot, L. H. Yang and A. K. McMahan, Polymeric nitrogen, Phys. Rev. B: Condens. Matter Mater. Phys., 1992, 46, 14419–14435 CrossRef CAS.
- M. I. Eremets, A. G. Gavriliuk, I. A. Trojan, D. A. Dzivenko and R. Boehler, Single-bonded cubic form of nitrogen, Nat. Mater., 2004, 3, 558–563 CrossRef CAS PubMed.
- C. Ji, A. A. Adeleke, L. X. Yang, B. Wan, H. Y. Gou, Y. S. Yao, B. Li, Y. Meng, J. S. Smith, V. B. Prakapenka, W. J. Liu, G. Y. Shen, W. L. Mao and H. K. Mao, Sci. Adv., 2020, 6, eaba9206 CrossRef CAS PubMed.
- Y. Ma, A. R. Oganov, Z. Li, Y. Xie and J. Kotakoski, Novel high pressure structures of polymeric nitrogen, Phys. Rev. Lett., 2009, 102, 065501 CrossRef PubMed.
- D. Tomasino, M. Kim, J. Smith and C.-S. Yoo, Pressure-induced symmetry-lowering transition in dense nitrogen to layered polymeric nitrogen (LP-N) with colossal raman intensity, Phys. Rev. Lett., 2014, 113, 205502 CrossRef PubMed.
- G. Nielsen and H. Schwalbe, Hydrogen bonds under pressure, Nat. Chem., 2012, 4, 693–695 CrossRef CAS PubMed.
- C. Murli, S. M. Sharma, S. Karmakar and S. K. Sikka, α-Glycine under high pressures: a Raman scattering study, Physica B, 2003, 339, 23–30 CrossRef CAS.
- B. A. Zakharov, E. A. Losev and E. V. Boldyreva, Polymorphism of “glycine-glutaric acid” co-crystals: the same phase at low temperatures and high pressures, CrystEngComm, 2013, 15, 1693–1697 RSC.
- A. K. Mishra, C. Murli and S. M. Sharma, High Pressure Raman Spectroscopic Study of Deuterated γ-Glycine, J. Phys. Chem. B, 2008, 112, 15867–15874 CrossRef CAS PubMed.
- A. K. Mishra, C. Murli, N. Garg, R. Chitra and S. M. Sharma, Pressure-induced structural transformations in bis (glycinium) oxalate, J. Phys. Chem. B, 2010, 114, 17084–17091 CrossRef CAS PubMed.
- K. Aoki, H. Yamawaki, M. Sakashita and H. Fujihisa, Infrared absorption study of the hydrogen-bond symmetrization in ice to 110 GPa, Phys. Rev. B: Condens. Matter Mater. Phys., 1996, 54, 15673–15677 CrossRef CAS PubMed.
- M. Benoit, D. Marx and M. Parrinello, Tunneling and zero-point motion in high-pressure ice, Nature, 1998, 392, 258–261 CrossRef CAS.
- A. F. Goncharov, M. R. Manaa, J. M. Zaug, R. H. Gee, L. E. Fried and W. B. Montgomery, Polymerization of formic acid under high pressure, Phys. Rev. Lett., 2005, 94, 065505–065508 CrossRef.
- R. Goddard, O. Heinemann and C. Krüger, α-1H-1,2,3,4-Tetrazole, Acta Crystallogr., Sect. C: Cryst. Struct. Commun., 1997, 53, 590–592 CrossRef.
- W. B. Li, X. L. Huang and K. Bao, et al., A Novel High-Density Phase and Amorphization of Nitrogen-Rich 1H-Tetrazole (CH2N4) under High Pressure, Sci. Rep., 2017, 7, 39249 CrossRef CAS PubMed.
- F. Billes, H. Endrédi and G. Keresztury, Vibrational spectroscopy of triazoles and tetrazole, J. Mol. Struct.: THEOCHEM, 2000, 530, 183–200 CrossRef CAS.
- M. M. Sokolova and V. V. Melynikov, et al., Zh. Obshch. Khim., 1975, 11, 1744 CAS.
- A. S. Davydov, Theory of Molecular Excitons, McGraw-Hill Book Co, New York, 1962 Search PubMed.
- D. S. McClure, Optical spectra of transition-metal ions in corundum, J. Chem. Phys., 1962, 36, 2757 CrossRef CAS.
- J. Eggert, K. Goettel and I. Silvera, Phys. Rev. B: Condens. Matter Mater. Phys., 1989, 40, 5724 CrossRef CAS PubMed.
- H. K. Mao, J. Xu and P. M. Bell, Calibration of the ruby pressure gauge to 800 kbar under quasi-hydrostatic conditions, J. Geophys. Res., 1986, 91, 4673 CrossRef CAS.
- Y. Akahama and H. Kawamura, Pressure calibration of diamond anvil Raman gauge to 310 GPa, J. Appl. Phys., 2006, 100, 043516 CrossRef.
- Z. W. Wang, O. Chen, Y. C. Cao, K. Finkelstein, D. M. Smilgies, X. M. Lu and W. A. Bassett, Integrating in situ high pressure small and wide angle synchrotron x-ray scattering for exploiting new physics of nanoparticle supercrystals, Rev. Sci. Instrum., 2010, 81, 093902 CrossRef PubMed.
- A. P. Hammersley, S. O. Svensson, M. Hanfland, A. N. Fitch and D. Hausermann, Two-dimensional detector software: From real detector to idealised image or two theta scan, High Pres. Res., 1996, 14, 235 CrossRef.
- B. H. Toby, EXPGUI, a graphical user interface for GSAS, J. Appl. Crystallogr., 2001, 34, 210 CrossRef CAS.
- B. H. Toby and R. B. Von Dreele, GSAS-II: the genesis of a modern open-source all purpose crystallography software package, J. Appl. Crystallogr., 2013, 46, 544–549 CrossRef CAS.
- Y. J. Wang, X. Dong and X. Y. Tang, et al., Angew. Chem., Int. Ed., 2019, 58, 1468–1473 CrossRef CAS PubMed.
- G. Kresse and J. Furthmüller, Efficient iterative schemes for ab initio total-energy calculations using a plane-wave basis set, Phys. Rev. B: Condens. Matter Mater. Phys., 1996, 54, 11169–11186 CrossRef CAS.
- W. Kohn and L. J. Sham, Self-Consistent Equations Including Exchange and Correlation Effects, Phys. Rev., 1965, 140, A1133–A1138 CrossRef.
- J. P. Perdew, K. Burke and M. Ernzerhof, Generalized Gradient Approximation Made Simple, Phys. Rev. Lett., 1996, 77, 3865–3868 CrossRef CAS PubMed.
- J. Klimeš, D. R. Bowler and A. Michaelides, van der Waals density functionals applied to solids, Phys. Rev. B: Condens. Matter Mater. Phys., 2011, 83, 195131 CrossRef.
- M. Dion, H. Rydberg, E. Schröder, D. C. Langreth and B. I. Lundqvist, van der Waals Density Functional for General Geometries, Phys. Rev. Lett., 2004, 92, 246401 CrossRef CAS PubMed.
- J. D. Pack and H. J. Monkhorst, Special points for Brillouin-zone integrations-a reply, Phys. Rev. B: Condens. Matter Mater. Phys., 1977, 16, 1748 CrossRef.
- A. Togo, F. Oba and I. Tanaka, First-Principles Calculations of the Ferroelastic Transition between Rutile-Type and CaCl2-Type SiO2 at High Pressures, Phys. Rev. B: Condens. Matter Mater. Phys., 2008, 78, 134106 CrossRef.
Footnotes |
| † Electronic supplementary information (ESI) available. See DOI: 10.1039/d1ra00522g |
| ‡ Y. L., H. D. and L. F. contributed equally to this work. |
| This journal is © The Royal Society of Chemistry 2021 |