 Open Access Article
Hydrophilic and organophilic pervaporation of industrially important α,β and α,ω-diols†
Shivshankar Chaudharia,
HyeonTae Shina,
SeoungYong Choia,
KieYong Cho *a,
MinYoung Shon
 *a,
SeungEun Namb and
YouIn Parkb
aDepartment of Industrial Chemistry, Pukyong National University, San 100, Yongdang-Dong, Nam-Gu, Busan 608-739, Korea. E-mail: kieyongh@gmail.com; myshon@pknu.ac.kr; Fax: +82 51 629 6429; Tel: +82 51 629 6440
bCenter for Membranes, Korea Research Institute of Chemical Technology, 141 Gajeong-ro, Yuseong-gu, Daejeon 305-600, Korea
First published on 1st March 2021
Abstract
The distillation-based purification of α,β and α,ω-diols is energy and resource intensive, as well as time consuming. Pervaporation separation is considered to be a remarkable energy efficient membrane technology for purification of diols. Thus, as a core pervaporation process, hydrophilic polyvinyl alcohol (PVA) membranes for the removal of water from 1,2-hexanediol (1,2-HDO) and organophilic polydimethylsiloxane–polysulfone (PDMS–PSF) membranes for the removal of isopropanol from 1,5 pentanediol (1,5-PDO) were employed. For 1,2-HDO/water separation using a feed having a 1![[thin space (1/6-em)]](https://www.rsc.org/images/entities/char_2009.gif) :
:![[thin space (1/6-em)]](https://www.rsc.org/images/entities/char_2009.gif) 4 weight ratio of 1,2-HDO/water, the membrane prepared using 4 vol% glutaraldehyde (GA4) showed the best performance, yielding a flux of 0.59 kg m−2 h−1 and a separation factor of 175 at 40 °C. In the organophilic pervaporation separation of the 1,5-PDO/IPA feed having a 9
4 weight ratio of 1,2-HDO/water, the membrane prepared using 4 vol% glutaraldehyde (GA4) showed the best performance, yielding a flux of 0.59 kg m−2 h−1 and a separation factor of 175 at 40 °C. In the organophilic pervaporation separation of the 1,5-PDO/IPA feed having a 9![[thin space (1/6-em)]](https://www.rsc.org/images/entities/char_2009.gif) :
:![[thin space (1/6-em)]](https://www.rsc.org/images/entities/char_2009.gif) 1 weight ratio of components, the PDMS membrane prepared with a molar ratio of TEOS alkoxy groups to PDMS hydroxyl groups of 70 yielded a flux of 0.12 kg m−2 h−1 and separation factor of 17
1 weight ratio of components, the PDMS membrane prepared with a molar ratio of TEOS alkoxy groups to PDMS hydroxyl groups of 70 yielded a flux of 0.12 kg m−2 h−1 and separation factor of 17![[thin space (1/6-em)]](https://www.rsc.org/images/entities/char_2009.gif) 638 at 40 °C. Long term stability analysis found that both hydrophilic (PVA) and organophilic (PDMS) membranes retained excellent pervaporation output over 18 days' continuous exposure to the feed. Both the hydrophilic and organophilic membranes exhibited promising separation performance at elevated operating conditions, showing their great potential for purification of α,β and α,ω-diols.
638 at 40 °C. Long term stability analysis found that both hydrophilic (PVA) and organophilic (PDMS) membranes retained excellent pervaporation output over 18 days' continuous exposure to the feed. Both the hydrophilic and organophilic membranes exhibited promising separation performance at elevated operating conditions, showing their great potential for purification of α,β and α,ω-diols.
Introduction
Diols contain two hydroxyl groups per molecule and are very important industrial chemicals because they can be synthesized from bio-resources such as lignin, making them promising renewable materials.1,2 α,ω-Diols have a broad range of applications in various industries, for example, as monomers for polymer synthesis, such as polyester and polyurethane, bio-fuels, in pharmaceuticals as solvents, and as moisturizer components in cosmetics.3–6 The worldwide value of the cosmetic market was US$ 507.8 billion in 2018 and is projected to increase to US$ 758.4 billion by 2025. Two important diols in cosmetics are 1,5-pentanediol (1,5-PDO) and 1,2-hexanediol (1,2-HDO). Thus, these diols have huge market potential. In fact, the global market for 1,2-HDO is expected to reach US$ 54 million by 2024 from US$ 40 million in 2019. 1,5-PDO is used in place of 1,6-hexanediol and 1,4-butanediol and also has a huge market potential, which is projected to reach a compound annual growth rate (CAGR) of 5.5% between 2017 and 2021.3–7The hydrogenation of the ecofriendly bio-product furfural produces furfural alcohol. Further hydrogenation of furfural alcohol, for which isopropyl alcohol (IPA) is used as the solvent, produces both 1,2- and 1,5-PDO.8 In contrast, 1,2-HDO is synthesized by the dehydrogenization of hexane to 1-hexene, followed by further oxidation of the double bond in 1-hexene by hydrogen peroxide, yielding 1,2-HDO.9
Both 1,2-HDO and 1,5-PDO are essential in the manufacture of cosmetics and dermatological pharmaceutical formulations.4,10–12 In the syntheses of both 1,2-HDO and 1,5-PDO by the above methods, the last stages of the process involve separation, purification, and concentration; however, these processes are very complicated, typically requiring large facilities and being energy intensive. The gas–liquid separation method has been used to remove the IPA solvent from 1,5-PDO. However, as the concentration of the solution increases, separation becomes increasingly difficult, and trace amounts of IPA remain in the product. Therefore, multi-stage distillation is often used, but this is also an energy intensive technique. In contrast, for the production of 1,2-HDO, vacuum distillation is used to remove excess water. Again, this process is challenging, particularly because of the formation of bubbles in the mixture. Thus, when standard distillation methods are used, a large amount of energy is consumed and a large amount of time is required.
As an alternative to distillation, pervaporation is becoming popular. The pervaporation process requires less space and less energy than traditional distillation methods.13–15
Pervaporation operates on the solution diffusion principle,16 in which the selective adsorption and diffusion of the target occur. Pervaporation separation can be achieved by creating a potential gradient across a membrane by applying a pressure difference over the membrane.16,17
Polysulfone (PSF) is one of the most widely used membrane materials, and membranes fabricated from PSF have excellent mechanical properties, heat aging resistance, and chemical stability.18 Additionally, PSF exhibits inherent hydrophobicity and high biocompatibility. Polydimethylsiloxane (PDMS) is another widely used membrane material, having applications in the recovery of various solvents because of its excellent hydrophobicity (organophilicity), low permeation resistance because of its amorphous nature, and excellent biocompatibility.19,20 Commercial PDMS is an oligomer and does not have membrane properties. Therefore, to form a membrane, the PDMS oligomers must be crosslinked.21 Tetraethyl orthosilicate (TEOS) has four crosslinkable alkoxide groups and can be used for this purpose. After crosslinking, the TEOS occupies a very small fraction of material bulk but has a significant effect on the membrane structure and performance.22 After crosslinking with TEOS, the mobility of the PDMS polymer chains can be controlled by increasing or decreasing the crosslinking density. Thus, PSF and PDMS membranes have excellent inherent hydrophobic (organophilic) properties and are compatible, and it is possible to use PSF as a support and PDMS as an active layer to fabricate a PDMS-coated PSF composite membrane with enhanced performance.23 In the pervaporation separation of 1,5-PDO and IPA, the amorphous PDMS membrane allows a higher flux of IPA with less diffusion resistance because the IPA molecules are much smaller than those of 1,5-PDO. Additionally, the hydrophobic nature of PDMS is likely to have a higher affinity for IPA than 1,5-PDO.
For the pervaporation separation of 1,2-HDO, a hydrophilic membrane is required. Poly(vinyl alcohol) (PVA) is a semi-crystalline, aliphatic material frequently used as a base material for the preparation of hydrophilic membranes, making it a good candidate material.24,25 The large number of hydroxyl groups in the polymer main chain give PVA an inherently hydrophilic nature. Furthermore, membranes prepared from PVA are robust, exhibiting excellent chemical and mechanical stability. However, in aqueous feed mixtures, PVA membranes undergo excessive swelling. Therefore, membranes prepared with PVA must be post crosslinked using agents such as glutaraldehyde at relatively low temperatures.26,27 Because the molecular size of water is much less than that of 1,2-HDO and because of the hydrophilic nature of PVA, it is likely to have a higher affinity (via hydrogen bonds and dipole–dipole interactions) for water than 1,2-HDO.
As pervaporation is profound technique for saving an energy against energy consuming traditional distillation process, therefore application of pervaporation process in various industries is expanding day by days. In the beginning it was started from the dehydration of various alcohol, now it applied for recovery of bio fuel,14,28 treatment of effluent treatment in pharmaceutical industries.29 Therefore, to expand the applications of pervaporation to the production of important raw materials in the cosmetics industry, we examined the potential of PVA- and PDMS-based pervaporation membranes for the removal of excess water from 1,2-HDO (hydrophilic approach) and trace amounts of IPA from 1,5-PDO (organophilic approach), respectively, with low energy consumption. For both hydrophilic and organophilic separation, the synthetic and operating conditions were varied to optimize the pervaporation output of both membranes. To date, there have been no reports of the pervaporation separation of 1,2-HDO and water and that of IPA and 1,5-PDO.
Experimental
Materials
PSF (Ultrason 3010, 55![[thin space (1/6-em)]](https://www.rsc.org/images/entities/char_2009.gif) 000 g mol−1) granules were purchased from BASF Korea. Hydroxyl-terminated PDMS (OH-PDMS, 110
000 g mol−1) granules were purchased from BASF Korea. Hydroxyl-terminated PDMS (OH-PDMS, 110![[thin space (1/6-em)]](https://www.rsc.org/images/entities/char_2009.gif) 000 g mol−1) was procured from Sigma-Aldrich (USA). Dibutyltin dilaurate (DBDA, 95%) and TEOS (99.5%) were purchased from Aldrich (USA). 1,5-PDO (95%), 1,2-HDO (97%), and PVA (98–99% hydrolyzed, 8800–97
000 g mol−1) was procured from Sigma-Aldrich (USA). Dibutyltin dilaurate (DBDA, 95%) and TEOS (99.5%) were purchased from Aldrich (USA). 1,5-PDO (95%), 1,2-HDO (97%), and PVA (98–99% hydrolyzed, 8800–97![[thin space (1/6-em)]](https://www.rsc.org/images/entities/char_2009.gif) 000) were purchased from Alfa Aesar (USA). All other chemicals, such as glutaraldehyde (25% aqueous solution), hydrochloric acid (36%), IPA (99.5%), n-hexane, and N-methyl pyrrolidone, were procured from Dae-Jung Chemicals & Metal Co., Korea.
000) were purchased from Alfa Aesar (USA). All other chemicals, such as glutaraldehyde (25% aqueous solution), hydrochloric acid (36%), IPA (99.5%), n-hexane, and N-methyl pyrrolidone, were procured from Dae-Jung Chemicals & Metal Co., Korea.
Membrane preparation
The PDMS–PSF composite membrane was prepared by mixing OH-PDMS (6.11 g) oligomer in n-hexane (40 mL) with stirring. Thereafter, different amounts of TEOS (0.058, 0.23, 0.405, and 0.58 g equivalent to molar ratios of the alkoxy groups in TEOS to hydroxyl groups in OH-PDMS of 10, 40, 70, and 100, respectively) and 0.1 g of DBDA catalyst were added. The PDMS-doped crosslinking solution was then stirred at a constant speed for 30 min at room temperature. Meanwhile, the PSF support was fixed to a glass plate with tape, and the crosslinking solution was cast on the PSF support using a casting applicator (casting thickness set to 300 μm). After drying at room temperature for 3 h to remove residual solvent, the film was transferred to an oven preheated to 75 °C and thermally cured for 20 h. Later, the fabricated membranes were cut into circles. The thicknesses of the PDMS active layers of the membranes ranged from 16 to 20 μm (ESI, Fig. S5b†). The membranes are labeled with respect to the molar ratio of alkoxy groups in TEOS to hydroxyl groups in PDMS in the membrane (i.e., 10 M, 40 M, 70 M, and 100 M).
Membrane characterization
Porometry (Porolux 100 (IB-FT GmbH)) was used to measure the pore size distribution in the PSF support. Using the capillary Porometry method, the pore size distribution in the PSF was determined. The structural characteristics of PVA and PDMS were analyzed by attenuated total reflection Fourier transform infrared spectroscopy (ATR FT-IR, Nicolet iS10, USA). All the spectra were recorded between 400 and 4000 cm−1 by accumulating 32 scans at 2 cm−1 resolution frequency. Thermogravimetric analysis (TGA) of the PVA and PVA–glutaraldehyde crosslinked membranes was performed using a TGA 7 device (TA Instruments, Perkin Elmer, USA). The membrane samples were heated from 25 to 600 °C at a heating rate of 10 °C min−1. The surface and cross-sectional morphology of the PSF supports and PDMS and PVA membranes were examined by field-emission scanning electron microscopy (FE-SEM, Vega II, Tescan, Czech Republic). The membrane specimens were coated with silver before analysis to make the film conductive. Tensile strength of GA2 to GA5 membrane samples were calculated using Shimadzu AGX-X Universal Testing Machine (UTM) equipped with Trapezium software. Previously dried samples (vacuum oven at 25 °C for 24 h) were cut in 25 × 100 mm and UTM test was performed at room temperature.Pervaporation experiment set-up
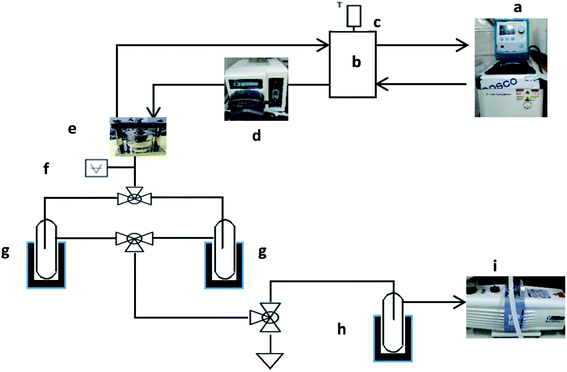
The pervaporation experiments were conducted using a PV apparatus, as shown schematically in Fig. 1. The membrane cell was divided into two parts: one joined to the feed tank and the other connected to the downstream side. A round membrane sample (PDMS or PVA) was affixed to the membrane cell, and the feed side membrane was wetted by the feed solution (HDO/water or 1,5-PDO/IPA) by dynamic circulation (70 g min−1) by a circulation pump (Cole Palmer, USA). Based on the design of the cell, the effective area of the membrane was 0.0019643 m2. The permeated vapor was collected in a tube and dipped in a cylinder of liquid nitrogen. A vacuum pump (Edwards, RV8) was used to maintain the pressure and create a driving force for the experiment. For all experiments, the pressure on the downstream was less than 1 torr, as measured by a digital pressure gauge (Super Bee, Instrutech Inc.). On the feed side, the temperatures of the feed solution were maintained at 30–50 and 50–70 °C for the PVA and PDMS membranes, respectively. The collected permeate samples were then weighed with an electronic balance (Sartorius BA210S). For each type of membrane specimen, three successive tests were carried out, and the average value of flux with a relative standard deviation less than 5% was obtained. The feed mixtures were varied from 10 wt% to 20 wt% IPA and 25 wt% to 15 wt% 1,2-HDO for the IPA- and water-containing feeds, respectively. These feed compositions were selected because the separation of diols in feeds of this range is energetically costly. The separation factor was calculated based on the exact concentrations of 1,5-PDO, 1,2-HDO, and IPA in the feed and permeate, which were measured using gas chromatography (DS Sci. DS7200 equipped with a flame ionization detector (FID)).Eqn (1)–(3) were used to evaluate the membrane performance based on the pervaporation flux (J), separation factor (α), and flux of individual components (Ji) for each membrane.
| J = Q/(At) | (1) |
In this study, the target components for removal were water (for hydrophilic 1,2-HDO separation) and IPA (for organophilic 1,5-PDO separation). Therefore, the separation factors (α) were calculated for water and IPA with respect to 1,2-HDO and 1,5-PDO, respectively.
 | (2) |
 | (3) |
The pervaporation separation index (PSI) is given by eqn (4).
| PSI = Jα | (4) |
Results and discussion
Details of the characterization of both PDMS and PVA membranes are given in the ESI (Fig. S1–S8†).Pervaporation of α,ω-diol feed mixtures
The separation performances of the PVA and PDMS membranes developed in this study were optimized by measuring the fluxes and separation factors of these membranes for the pervaporation of 1,2-HDO/water and 1,5-PDO/IPA feed mixtures, respectively. To achieve this, a range of experimental conditions were applied, and the results are given below.Effect of crosslinker concentration
Pervaporation tests were carried out to evaluate the effect of the GA crosslinker concentration on the flux and separation factor on the dehydration of the 1,2-HDO/water system. Fig. 2 shows the effect of the GA concentration on the flux and separation factor with a 25![[thin space (1/6-em)]](https://www.rsc.org/images/entities/char_2009.gif) :
:![[thin space (1/6-em)]](https://www.rsc.org/images/entities/char_2009.gif) 75 (wt%) 1,2-HDO/water feed composition at 40 °C. As in the swelling degree study (Fig. S8†), the flux followed a similar trend, decreasing from 1.27 to 0.51 kg m−2 h−1 for the membranes prepared with GA concentrations from 2 to 5 vol%. In contrast, the separation factor increased from 59 to 196, and the water content of the permeate solution also increased from 99.43 to 99.83 wt%. As it can be seen from the FTIR analysis, in the crosslinking reaction, the hydroxyl moieties in PVA and GA react, leading to the formation of hydrophobic ether linkages in the membrane structure.30 This results in increased membrane compactness and reduced membrane swelling, as well as the reduced free volume of the membrane.31 As shown in Fig. S3† the lower content of GA in the PVA produced loose polymer network of membrane and vice versa. Therefore, there is less space for the permeation of water and 1,2-HDO through the membrane. However, there are abundant hydroxyl functional groups in the PVA that can form hydrogen bonds with water and 1,2-HDO. The Hansen solubility parameters of PVA (15.9 MPa1/2), water (15.5 MPa1/2), and 1,2-HDO (16.31 MPa1/2) are comparable.32,33 Therefore, PVA, 1,2-HDO, and water are likely to form polar–polar and hydrogen-bonding interactions. Conversely, the separation factor increased with increase in crosslinking agent concentration, possibly because of the intermolecular crosslinking of PVA chains, which reduces the gap between polymer chains and prohibits the passage of the larger 1,2-HDO molecules but not that of the small water molecules. Therefore, improvement in separation was achieved when using a higher crosslinking agent concentration.
75 (wt%) 1,2-HDO/water feed composition at 40 °C. As in the swelling degree study (Fig. S8†), the flux followed a similar trend, decreasing from 1.27 to 0.51 kg m−2 h−1 for the membranes prepared with GA concentrations from 2 to 5 vol%. In contrast, the separation factor increased from 59 to 196, and the water content of the permeate solution also increased from 99.43 to 99.83 wt%. As it can be seen from the FTIR analysis, in the crosslinking reaction, the hydroxyl moieties in PVA and GA react, leading to the formation of hydrophobic ether linkages in the membrane structure.30 This results in increased membrane compactness and reduced membrane swelling, as well as the reduced free volume of the membrane.31 As shown in Fig. S3† the lower content of GA in the PVA produced loose polymer network of membrane and vice versa. Therefore, there is less space for the permeation of water and 1,2-HDO through the membrane. However, there are abundant hydroxyl functional groups in the PVA that can form hydrogen bonds with water and 1,2-HDO. The Hansen solubility parameters of PVA (15.9 MPa1/2), water (15.5 MPa1/2), and 1,2-HDO (16.31 MPa1/2) are comparable.32,33 Therefore, PVA, 1,2-HDO, and water are likely to form polar–polar and hydrogen-bonding interactions. Conversely, the separation factor increased with increase in crosslinking agent concentration, possibly because of the intermolecular crosslinking of PVA chains, which reduces the gap between polymer chains and prohibits the passage of the larger 1,2-HDO molecules but not that of the small water molecules. Therefore, improvement in separation was achieved when using a higher crosslinking agent concentration.
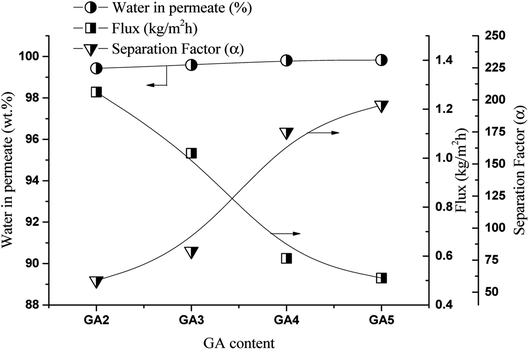 | ||
| Fig. 2 Effect of GA concentration in crosslinking solution on flux and separation factor, feed solution 25/75 (1,2-HDO/water, w/w, %) at 40 °C. | ||
Recently, Cai et al. have developed for PVA-modified by TiC2Tx membrane for the pervaporation dehydration of ethanol, where TiC2Tx acted as crosslinker and reported that, the flux decreased and separation factor increased with increased of TiC2Tx attributed to decline in the hydrophilicity of the membrane by crosslinking.34
For the organophilic approach for the separation of the IPA/1,5-PDO mixture, pervaporation tests were carried out to evaluate the effect of the alkoxy-to-hydroxyl ratio in the PDMS casting solution on the flux and separation of a 80![[thin space (1/6-em)]](https://www.rsc.org/images/entities/char_2009.gif) :
:![[thin space (1/6-em)]](https://www.rsc.org/images/entities/char_2009.gif) 20 (wt%) 1,5-PDO/IPA feed at 50 °C. The results are shown in Fig. 3. The flux and separation factor were not significantly influenced by the crosslinking density. The flux dropped from 0.22 to 0.19 kg m−2 h−1, the separation factor increased from 2206 to 3072, and the IPA content in the permeate increased from 99.82 to 99.87 wt% with increase in the hydroxyl-to-alkoxy molar ratio in the crosslinking solution from 10 to 100, respectively. This means that the pervaporation performance of all membranes only varied marginally with the crosslinking density. This is because the PDMS membrane is amorphous elastomeric polymer and the glass transition temperature of PDMS is below 25 °C.35 Therefore, the PDMS membrane has a large free volume to penetrate small IPA as well as big 1,5-PDO molecules through it, and only the hydrophobicity of PDMS affects the membrane performance. In addition, the affinity of the PDMS layer for IPA (hydrophobic) is higher than that for 1,5-PDO (hydrophilic). Thus, all membranes exhibited excellent separation performance. Because the PSF support is also hydrophobic in nature, pervaporation tests were also performed using a PSF membrane alone under the same conditions to determine the effect of the PDMS coating layer; the results are shown in Fig. 3. In the initial 2 h of PV test the PSF membrane also exhibited excellent performance (J = 0.25 kg m−2 h−1 and α = 1996) for IPA/1,5-PDO separation. However, as the pervaporation operation time was extended beyond 3 h, the membrane began to leak and performance dropped. This is due to, as shown in Fig. S1,† the PS membrane has thin skin layer followed by finger like connected macro void structure and porous in nature. Therefore, overall, the PDMS coating layer slightly affected the separation performance of the IPA/PDO feed mixture system; however, it is necessary to cover the defects (pore) in the PSF support membrane.
20 (wt%) 1,5-PDO/IPA feed at 50 °C. The results are shown in Fig. 3. The flux and separation factor were not significantly influenced by the crosslinking density. The flux dropped from 0.22 to 0.19 kg m−2 h−1, the separation factor increased from 2206 to 3072, and the IPA content in the permeate increased from 99.82 to 99.87 wt% with increase in the hydroxyl-to-alkoxy molar ratio in the crosslinking solution from 10 to 100, respectively. This means that the pervaporation performance of all membranes only varied marginally with the crosslinking density. This is because the PDMS membrane is amorphous elastomeric polymer and the glass transition temperature of PDMS is below 25 °C.35 Therefore, the PDMS membrane has a large free volume to penetrate small IPA as well as big 1,5-PDO molecules through it, and only the hydrophobicity of PDMS affects the membrane performance. In addition, the affinity of the PDMS layer for IPA (hydrophobic) is higher than that for 1,5-PDO (hydrophilic). Thus, all membranes exhibited excellent separation performance. Because the PSF support is also hydrophobic in nature, pervaporation tests were also performed using a PSF membrane alone under the same conditions to determine the effect of the PDMS coating layer; the results are shown in Fig. 3. In the initial 2 h of PV test the PSF membrane also exhibited excellent performance (J = 0.25 kg m−2 h−1 and α = 1996) for IPA/1,5-PDO separation. However, as the pervaporation operation time was extended beyond 3 h, the membrane began to leak and performance dropped. This is due to, as shown in Fig. S1,† the PS membrane has thin skin layer followed by finger like connected macro void structure and porous in nature. Therefore, overall, the PDMS coating layer slightly affected the separation performance of the IPA/PDO feed mixture system; however, it is necessary to cover the defects (pore) in the PSF support membrane.
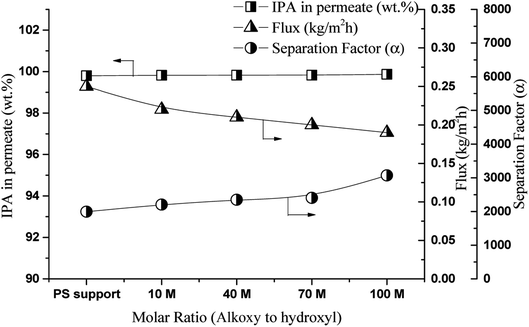 | ||
| Fig. 3 Effect of alkoxy to hydroxyl ratio on flux and separation factor, feed 80/20 1,5-PDO/IPA, w/w, %, temperature 50 °C. | ||
Because the GA4 and 70 M membranes were comparatively robust, they were selected for further testing for the optimization of the operating conditions.
Effect of operating conditions
Fig. 4 shows the effect of the feed concentration on membrane performance. The 1,2-HDO concentration was varied from 15 to 25 wt% at 40 °C. In general, more water in the feed increases the plasticization of PVA, leading to polymer chain loosening. This is the reason for the decrease in flux (1.0 to 0.59 kg m−2 h−1).34 In addition, the plasticization of the membrane results in the formation of a large gap between the polymer chains in the membrane structure, which promotes the permeation of water, as well as that of the larger 1,2-HDO molecules, thus reducing the separation factor (175 to 167). Additionally, the PSI values calculated from eqn (4) are also decreased (167, 133, and 103 kg m−2 h−1) on increasing the 1,2-HDO concentration from 15 to 25 wt%, respectively, at 40 °C.36 Nevertheless, the water content in the permeate (99.80 ± 0.009 wt%) was negligibly affected by the changes in the feed composition. Thus, the PVA membrane shows excellent performance in this feed range; in contrast, the separation of water and 1,2-HDO by vacuum distillation is challenging in this range of feed compositions because the large amount of water in the solution results in the formation of many bubbles. Thus, pervaporation separation is more efficient than vacuum distillation.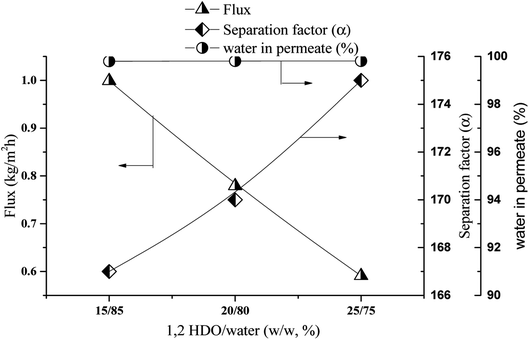 | ||
| Fig. 4 Effect of feed concentration on flux and separation factor, temperature 40 °C, membrane: GA4. | ||
Next, the effect of the feed composition on the performance of the 70 M membrane for the separation of 1,5-PDO from IPA at 50 °C in terms of flux and separation factor is discussed. The IPA concentration in the feed was varied from 10 to 30 wt%, and the results are shown in Fig. 5. In pervaporation separation, typically, as the content of the target component selective to the membrane in the feed increases, the driving force for its permeation also increases.16,22 PDMS is IPA-selective (hydrophobic in nature); therefore, as the IPA concentration in the feed increased, the flux increased from 0.10 to 0.23 kg m−2 h−1. However, because a high IPA concentration in the feed induces membrane swelling, the separation factor decreased. Similar trends of pervaporation out put through PDMS membrane for n-butanol and ethanol aqueous solution have reported by the Cheng et al.28 and Li et al.37 respectively. Despite this, the IPA content in the permeate was only reduced from 99.93 to 99.86 wt%, and the PSI values were 1342, 481, and 377 kg m−2 h−1 as the IPA content of the feed was varied from 10 to 30 wt%, respectively. The PSI value is very high at a feed composition of 10![[thin space (1/6-em)]](https://www.rsc.org/images/entities/char_2009.gif) :
:![[thin space (1/6-em)]](https://www.rsc.org/images/entities/char_2009.gif) 90 IPA/1,5-PDO (wt%) for the 70 M PDMS membrane, suggesting that it has excellent potential for processing high-IPA feed mixtures. In contrast, conventional multi-stage distillation and liquid–gas separation are costly and require large-scale equipment, making the pervaporation separation of high-IPA-content IPA/1,5-PDO feeds using the PDMS membrane very attractive.
90 IPA/1,5-PDO (wt%) for the 70 M PDMS membrane, suggesting that it has excellent potential for processing high-IPA feed mixtures. In contrast, conventional multi-stage distillation and liquid–gas separation are costly and require large-scale equipment, making the pervaporation separation of high-IPA-content IPA/1,5-PDO feeds using the PDMS membrane very attractive.
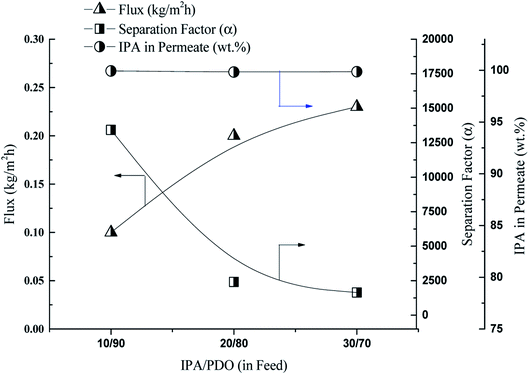 | ||
| Fig. 5 Effect of feed concentration on flux and separation factor, membrane 70 M, temperature – 50 °C. | ||
Fig. 6 shows the effect of the operating temperature on the flux and separation factor of the GA4 membrane with a feed containing 25![[thin space (1/6-em)]](https://www.rsc.org/images/entities/char_2009.gif) :
:![[thin space (1/6-em)]](https://www.rsc.org/images/entities/char_2009.gif) 75 (wt%) 1,2-HDO/water. As often observed in pervaporation separation, the polymer membrane flux increased with increase in temperature, whereas the separation factor decreased. This occurs because an increase in the temperature of the feed solution increases (1) the polymer free volume because of the increased thermal motion of the polymer chains and the (2) vapor pressure on the feed side increases but that of the permeate side remains the same. These two factors increase the driving force for the permeation of both components; therefore, the flux increases and the separation factor decreases.17,38,39
75 (wt%) 1,2-HDO/water. As often observed in pervaporation separation, the polymer membrane flux increased with increase in temperature, whereas the separation factor decreased. This occurs because an increase in the temperature of the feed solution increases (1) the polymer free volume because of the increased thermal motion of the polymer chains and the (2) vapor pressure on the feed side increases but that of the permeate side remains the same. These two factors increase the driving force for the permeation of both components; therefore, the flux increases and the separation factor decreases.17,38,39
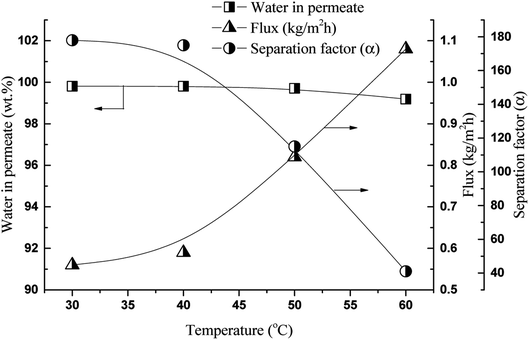 | ||
| Fig. 6 Effect of operating temperature on flux and separation factor, feed: 25/75 (1,2-HDO/water, w/w, %) membrane: GA4. | ||
The effect of temperature on the pervaporation flux and separation factor using the 70 M PDMS membrane with a 10![[thin space (1/6-em)]](https://www.rsc.org/images/entities/char_2009.gif) :
:![[thin space (1/6-em)]](https://www.rsc.org/images/entities/char_2009.gif) 90 (wt%) IPA/PDO feed was examined, and the results are shown in Fig. 7. As is common in pervaporation separation, the flux increased with increase in temperature. However, the IPA content in the permeate and separation factor also increased with temperature. This is because of the large difference in the boiling points of IPA and 1,5-PDO (82 and 238 °C, respectively). As a result, as the temperature increased, the saturated pressure of the mixture increased because IPA is a lower boiling liquid; (Boiling Point = 82.5 °C) therefore, the driving force for IPA permeation was greater than that of 1,5-PDO (Boiling Point = 242 °C). Thus, at higher temperatures, flux was enhanced without affecting the IPA content in the permeate. Similar behavior has been reported for the pervaporation separation of ethylene glycol/water and n-butanol/water mixtures.40,41 Li et al. developed, PDMS membrane with self-assembled monolayers for ethanol/water pervaporation separation, with increased of feed temperature they have found to be increased both flux and separation factor attributed to the increased diffusion rate of ethanol than water by temperature.37 Nevertheless, this phenomenon was not observed for 1,2-HDO/water separation, possibly because PVA is hydrophilic and has affinity for both 1,2-HDO and water. On increasing the temperature, the increased free volume in the membrane resulted in the permeation of both components across the membrane; therefore, the flux increased and the separation factor decreased.34,42 The temperature dependence of flux can be expressed by the Arrhenius-type relationship show in eqn (5).39,43
90 (wt%) IPA/PDO feed was examined, and the results are shown in Fig. 7. As is common in pervaporation separation, the flux increased with increase in temperature. However, the IPA content in the permeate and separation factor also increased with temperature. This is because of the large difference in the boiling points of IPA and 1,5-PDO (82 and 238 °C, respectively). As a result, as the temperature increased, the saturated pressure of the mixture increased because IPA is a lower boiling liquid; (Boiling Point = 82.5 °C) therefore, the driving force for IPA permeation was greater than that of 1,5-PDO (Boiling Point = 242 °C). Thus, at higher temperatures, flux was enhanced without affecting the IPA content in the permeate. Similar behavior has been reported for the pervaporation separation of ethylene glycol/water and n-butanol/water mixtures.40,41 Li et al. developed, PDMS membrane with self-assembled monolayers for ethanol/water pervaporation separation, with increased of feed temperature they have found to be increased both flux and separation factor attributed to the increased diffusion rate of ethanol than water by temperature.37 Nevertheless, this phenomenon was not observed for 1,2-HDO/water separation, possibly because PVA is hydrophilic and has affinity for both 1,2-HDO and water. On increasing the temperature, the increased free volume in the membrane resulted in the permeation of both components across the membrane; therefore, the flux increased and the separation factor decreased.34,42 The temperature dependence of flux can be expressed by the Arrhenius-type relationship show in eqn (5).39,43
| Ji = Ap × e−Ep/RT | (5) |
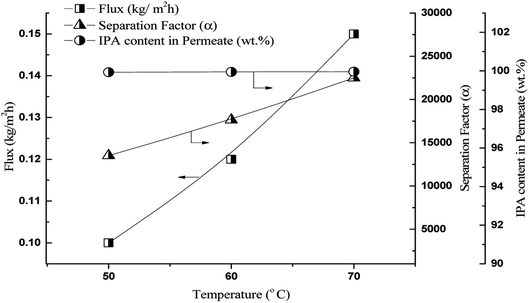 | ||
| Fig. 7 Effect of feed temperature on flux and separation factor, membrane – 70 M, feed 10/90 IPA/PDO, w/w, % solution. | ||
To calculate the apparent activation energy for permeation, the log of both sides of eqn (5) is taken (eqn (6)).
 | (6) |
 | (7) |
Thus, by plotting ln![[thin space (1/6-em)]](https://www.rsc.org/images/entities/char_2009.gif) Ji versus 1000/T, Ep can be obtained. The logarithmic plots for both hydrophilic and organophilic pervaporation separation are shown in Fig. 8 and 9. The Ep values for water, 1,2-HDO, IPA, and 1,5-PDO are 22.45, 62.15, 18.68, and −20.05 kJ mol−1, respectively. In the case of 1,2-HDO/water pervaporation, the higher Ep of 1,2-HDO compared that of water indicates that the permeation of 1,2-HDO is more sensitive to temperature.43,44 On the other hand, for IPA/PDO separation, the positive value of Ep for IPA suggests that the flux of IPA increases with temperature, whereas the negative value of Ep of 1,5-PDO suggests that the flux of 1,5-PDO decreases with increasing temperature of the feed solution.45
Ji versus 1000/T, Ep can be obtained. The logarithmic plots for both hydrophilic and organophilic pervaporation separation are shown in Fig. 8 and 9. The Ep values for water, 1,2-HDO, IPA, and 1,5-PDO are 22.45, 62.15, 18.68, and −20.05 kJ mol−1, respectively. In the case of 1,2-HDO/water pervaporation, the higher Ep of 1,2-HDO compared that of water indicates that the permeation of 1,2-HDO is more sensitive to temperature.43,44 On the other hand, for IPA/PDO separation, the positive value of Ep for IPA suggests that the flux of IPA increases with temperature, whereas the negative value of Ep of 1,5-PDO suggests that the flux of 1,5-PDO decreases with increasing temperature of the feed solution.45
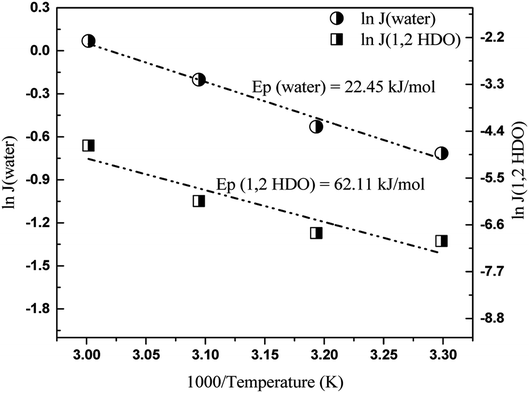 | ||
| Fig. 8 Plot of log of individual fluxes of water and 1,2-HDO versus 1000/temperature, feed: 25/75 (1,2-HDO/water, w/w, %) membrane: GA4. | ||
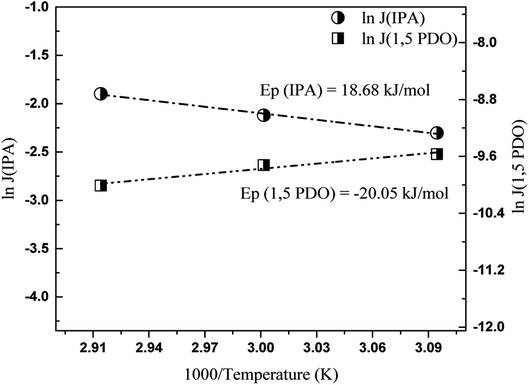 | ||
| Fig. 9 Plot of log of individual fluxes of IPA and 1,5-PDO versus 1000/temperature, membrane – 70 M, feed 10/90 IPA/PDO, w/w, % solution. | ||
Long-term pervaporation operation stability of membranes
The performance of both the hydrophilic and organophilic membranes for α,β and α,ω-diol production can only be considered efficient if they exhibit constant long-term separation output.Therefore, to examine the long-term stability of the PVA membrane (GA4), a feed containing 25![[thin space (1/6-em)]](https://www.rsc.org/images/entities/char_2009.gif) :
:![[thin space (1/6-em)]](https://www.rsc.org/images/entities/char_2009.gif) 75 (wt%) 1,2-HDO/water at 40 °C was continuously circulated through the feed side of the membrane. At intervals, pervaporation tests were carried out, and the pervaporation flux and water content of the permeate solution were determined. In total, the membrane operation stability tests were carried out for 18 days. Fig. 10 shows the effect of long-term pervaporation on membrane performance. As shown in the figure, the flux only slightly increased (0.56 to 0.62), and the water content of the permeate solution marginally decreased (99.81 to 99.63 wt%) from 1 to 18 days. This suggests that the PVA GA4 membrane has potential for the long-term separation of water from 1,2-HDO.
75 (wt%) 1,2-HDO/water at 40 °C was continuously circulated through the feed side of the membrane. At intervals, pervaporation tests were carried out, and the pervaporation flux and water content of the permeate solution were determined. In total, the membrane operation stability tests were carried out for 18 days. Fig. 10 shows the effect of long-term pervaporation on membrane performance. As shown in the figure, the flux only slightly increased (0.56 to 0.62), and the water content of the permeate solution marginally decreased (99.81 to 99.63 wt%) from 1 to 18 days. This suggests that the PVA GA4 membrane has potential for the long-term separation of water from 1,2-HDO.
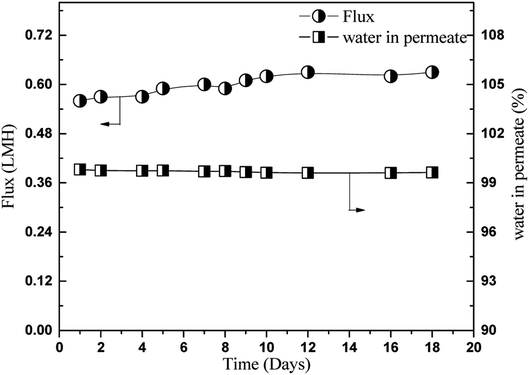 | ||
| Fig. 10 Long term stability evaluation in 25/75 (HDO/water, w/w, %) feed mixture of GA4 membrane at 40 °C. | ||
For the organophilic approach, the long-term stability of the PDMS–PSF membrane (70 M) with a feed containing 10![[thin space (1/6-em)]](https://www.rsc.org/images/entities/char_2009.gif) :
:![[thin space (1/6-em)]](https://www.rsc.org/images/entities/char_2009.gif) 90 (wt%) IPA/1,5-PDO was continuously circulated on either side of the membrane at 60 °C. Again, at intervals, pervaporation tests were carried out to evaluate the pervaporation flux and amount of IPA in the permeate solution. In this case, the membrane stability tests were carried out for 18 days. The effect of long-term pervaporation on membrane performance is shown in Fig. 11. As shown, the flux decreased initially by a small amount (from 0.12 to 0.09 kg m−2 h−1) but subsequently remained almost constant until the end of the tests (day 18). Further, the IPA content of the permeate remained 99.9 ± 0.1 wt% during the whole test period.
90 (wt%) IPA/1,5-PDO was continuously circulated on either side of the membrane at 60 °C. Again, at intervals, pervaporation tests were carried out to evaluate the pervaporation flux and amount of IPA in the permeate solution. In this case, the membrane stability tests were carried out for 18 days. The effect of long-term pervaporation on membrane performance is shown in Fig. 11. As shown, the flux decreased initially by a small amount (from 0.12 to 0.09 kg m−2 h−1) but subsequently remained almost constant until the end of the tests (day 18). Further, the IPA content of the permeate remained 99.9 ± 0.1 wt% during the whole test period.
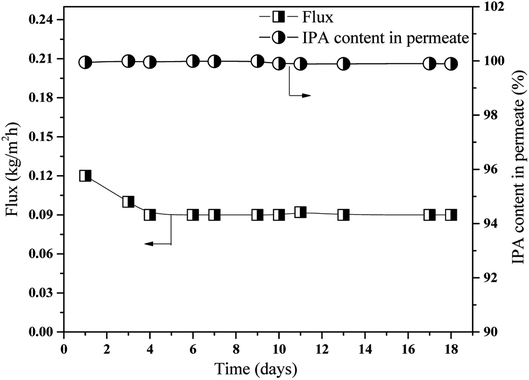 | ||
| Fig. 11 Long term stability evaluation, membrane – 70 M, feed 10/90 IPA/PDO, w/w, % solution at 60 °C. | ||
Thus, on the basis of the stability evaluation, both hydrophilic (PVA-based) and organophilic (PDMS-based) separation membranes have tremendous potential for use in the low-cost, low-energy industrial pervaporation of α,β and α,ω-diols mixtures. Additionally, although this was a laboratory-scale study accordingly free-standing flat PVA sheets and a PDMS–PSF composite membrane were used, the pervaporation output could be scaled up by (1) changing the membrane module configuration from a flat sheet to a hollow fiber module system, and (2) reducing the active layer membrane thickness from the micrometer to nanometer range.
Conclusions
From an energy-saving perspective, the use of hydrophilic (PVA-based membrane) and organophilic (PDMS-based membrane) pervaporation separation for α,ω-diol production were examined. As a result of our evaluation, the following conclusions were drawn.For the pervaporation dehydration of water/1,2-HDO feeds, a free-standing glutaraldehyde-crosslinked PVA membrane was developed. The membrane thickness was around 70 μm. For the pervaporation separation of a feed containing a 25![[thin space (1/6-em)]](https://www.rsc.org/images/entities/char_2009.gif) :
:![[thin space (1/6-em)]](https://www.rsc.org/images/entities/char_2009.gif) 75 weight ratio of 1,2-HDO and water at 40 °C, the membranes showed decreased membrane swelling and flux (1.27 to 0.51 kg m−2 h−1) but increased separation factor (59 to 196) with increase in GA crosslinker contents from 2 to 5 wt%, respectively. Using the same feed conditions but with the temperature varied from 30 to 60 °C, the flux increased from 0.56 to 1.08 kg m−2 h−1 and the separation factor decreased from 178 to 41. In the long-term stability evaluation of the GA4 membrane with the 25
75 weight ratio of 1,2-HDO and water at 40 °C, the membranes showed decreased membrane swelling and flux (1.27 to 0.51 kg m−2 h−1) but increased separation factor (59 to 196) with increase in GA crosslinker contents from 2 to 5 wt%, respectively. Using the same feed conditions but with the temperature varied from 30 to 60 °C, the flux increased from 0.56 to 1.08 kg m−2 h−1 and the separation factor decreased from 178 to 41. In the long-term stability evaluation of the GA4 membrane with the 25![[thin space (1/6-em)]](https://www.rsc.org/images/entities/char_2009.gif) :
:![[thin space (1/6-em)]](https://www.rsc.org/images/entities/char_2009.gif) 75 (wt%) 1,2-HDO/water feed at 40 °C, the hydrophilic membrane exhibited excellent performance with only a slight increase in flux and no significant reduction in the water content of the permeate.
75 (wt%) 1,2-HDO/water feed at 40 °C, the hydrophilic membrane exhibited excellent performance with only a slight increase in flux and no significant reduction in the water content of the permeate.
For the pervaporation separation of 1,5-PDO and IPA feeds, a PDMS–PSF membrane was developed. The amount of TEOS crosslinker used for membrane preparation had no effect on the membrane flux but had a slight effect on the separation factor. For the 70 M membrane, a flux of approximately 0.20 kg m−2 h−1 and separation factor of 2406 were obtained using a 20![[thin space (1/6-em)]](https://www.rsc.org/images/entities/char_2009.gif) :
:![[thin space (1/6-em)]](https://www.rsc.org/images/entities/char_2009.gif) 80 (wt%) IPA/1,5-PDO feed at 50 °C. In addition, using the same membrane, the effect of the feed composition was studied by varying the IPA content from 10 to 20 wt%. The flux increased from 0.10 to 0.23 kg m−2 h−1, whereas the separation factor decreased from 13
80 (wt%) IPA/1,5-PDO feed at 50 °C. In addition, using the same membrane, the effect of the feed composition was studied by varying the IPA content from 10 to 20 wt%. The flux increased from 0.10 to 0.23 kg m−2 h−1, whereas the separation factor decreased from 13![[thin space (1/6-em)]](https://www.rsc.org/images/entities/char_2009.gif) 423 to 1641, and the IPA content of the permeate increased slightly from 99.93% to 99.96%. In the long-term stability evaluation of the PDMS membrane, the 70 M membrane showed excellent stability with only slightly decreased flux, and the IPA content in the permeated solution was approximately 99.9% throughout the study. Overall, it can be concluded from the stability evaluation that both hydrophilic (PVA) and organophilic (PDMS) membranes have tremendous potential for processing water/1,2-HDO and IPA/1,5-PDO, respectively, mixtures. Crucially, these systems require less energy than traditional distillation-based processes and, thus, will help increase the economics of industrial α,ω-diol production.
423 to 1641, and the IPA content of the permeate increased slightly from 99.93% to 99.96%. In the long-term stability evaluation of the PDMS membrane, the 70 M membrane showed excellent stability with only slightly decreased flux, and the IPA content in the permeated solution was approximately 99.9% throughout the study. Overall, it can be concluded from the stability evaluation that both hydrophilic (PVA) and organophilic (PDMS) membranes have tremendous potential for processing water/1,2-HDO and IPA/1,5-PDO, respectively, mixtures. Crucially, these systems require less energy than traditional distillation-based processes and, thus, will help increase the economics of industrial α,ω-diol production.
Conflicts of interest
There are no conflicts to declare.Acknowledgements
This work was supported by the (1) Korea Institute of Energy Technology Evaluation and Planning (KETEP) and the Ministry of Trade, Industry & Energy (MOTIE) of the Republic of Korea (No. 20194010201840) (2) Korea Institute of Energy Technology Evaluation and Planning (KETEP) grant funded by the Korea government (MOTIE) (20202020800330, Development and demonstration of energy efficient reaction–separation·purification process for fine chemical industry).Notes and references
- G. W. Huber and J. He, Catalytic Processes for the Production of Fuels and Chemicals from Lignocellulosic Biomass, Univ. of Wisconsin, Madison, WI (United States), Office of Scientific and Technical Information, 2013, DOI:10.2172/1480118.
- J. He, K. Huang, K. J. Barnett, S. H. Krishna, D. M. Alonso, Z. J. Brentzel, S. P. Burt, T. Walker, W. F. Banholzer, C. T. Maravelias, I. Hermans, J. A. Dumesic and G. W. Huber, Faraday Discuss., 2017, 202, 247–267 RSC.
- K. Huang, Z. J. Brentzel, K. J. Barnett, J. A. Dumesic, G. W. Huber and C. T. Maravelias, ACS Sustainable Chem. Eng., 2017, 5, 4699–4706 CrossRef CAS.
- W. Johnson, W. F. Bergfeld, D. V. Belsito, R. A. Hill, C. D. Klaassen, D. Liebler, J. G. Marks, R. C. Shank, T. J. Slaga, P. W. Snyder and F. A. Andersen, Int. J. Toxicol., 2012, 31, 147S–168S CrossRef.
- D. Sun, S. Sato, W. Ueda, A. Primo, H. Garcia and A. Corma, Green Chem., 2016, 18, 2579–2597 RSC.
- J. Cerar, A. Jamnik and M. Tomšič, J. Mol. Liq., 2019, 276, 307–317 CrossRef CAS.
- Global 1,2-Hexanediol (CAS 6920-22-5) Market by Manufacturers, Regions, Type and Application: Forecast to 2024, https://www.decisiondatabases.com/ip/15303-1-2-hexanediol-cas-6920-22-5-market-analysis-report.
- R. Mariscal, P. Maireles-Torres, M. Ojeda, I. Sádaba and M. López Granados, Energy Environ. Sci., 2016, 9, 1144–1189 RSC.
- I. T. Kim, Y. N. Lee and J. M. Lee, Process for Preparing 1,2-Hexanediol, KR Pat. KR101620925B1, 2016.
- E.-Y. Choi, Kor. J. Aesthet. Cosmetol., 2015, 13, 213–220 Search PubMed.
- E. Lee, S. An, S. A. Cho, Y. Yun, J. Han, Y. K. Hwang, H. K. Kim and T. R. Lee, Int. J. Cosmet. Sci., 2011, 33, 421–425 CrossRef CAS.
- J. J. Sundberg and J. Faergemann, Expert Opin. Invest. Drugs, 2008, 17, 601–610 CrossRef CAS.
- R. Castro-Muñoz, F. Galiano and A. Figoli, Chem. Eng. Res. Des., 2020, 164, 68–85 CrossRef.
- L. Vane, V. Namboodiri, G. Lin, M. Abar and F. Alvarez, ACS Sustainable Chem. Eng., 2016, 4, 4442–4450 CrossRef CAS.
- G. Liu, W. Wei and W. Jin, ACS Sustainable Chem. Eng., 2014, 2, 546–560 CrossRef CAS.
- J. G. Wiljmans and R. W. Baker, J. Membr. Sci., 1995, 107, 1–21 CrossRef.
- G. Jyoti, A. Keshav and J. Anandkumar, J. Eng., 2015, 2015, 1–24 CrossRef.
- Z. Fan, Z. Wang, N. Sun, J. Wang and S. Wang, J. Membr. Sci., 2008, 320, 363–371 CrossRef CAS.
- J. Y. Lee, S. O. Hwang, H. J. Kim, D. Y. Hong, J. S. Lee and J. H. Lee, Sep. Purif. Technol., 2019, 209, 383–391 CrossRef CAS.
- C. Xue, F. Liu, M. Xu, J. Zhao, L. Chen, J. Ren, F. Bai and S. T. Yang, Biotechnol. Bioeng., 2016, 113, 120–129 CrossRef CAS.
- A. M. Kansara, V. K. Aswal and P. S. Singh, RSC Adv., 2015, 5, 51608–51620 RSC.
- J. Y. Lee, J. S. Lee and J. H. Lee, Sep. Purif. Technol., 2020, 235, 116142 CrossRef.
- J. Guo, G. Zhang, W. Wu, S. Ji, Z. Qin and Z. Liu, Chem. Eng. J., 2010, 158, 558–565 CrossRef CAS.
- J. Sun, X. Qian, Z. Wang, F. Zeng, H. Bai and N. Li, J. Membr. Sci., 2020, 599, 117838 CrossRef CAS.
- L. L. Xia, C. L. Li and Y. Wang, J. Membr. Sci., 2016, 498, 263–275 CrossRef CAS.
- L. Liu and S. E. Kentish, J. Membr. Sci., 2018, 553, 63–69 CrossRef CAS.
- S. Chaudhari, Y. S. Kwon, M. Y. Shon, S. E. Nam and Y. I. Park, RSC Adv., 2019, 9, 5908–5917 RSC.
- C. Cheng, F. Liu, H. Yang, K. Xiao, C. Xue and S. Yang, Ind. Eng. Chem. Res., 2020, 59, 7777–7786 CrossRef CAS.
- M. Hir, A. Magne, T. Clair, E. Carretier and P. Moulin, Org. Process Res. Dev., 2020 DOI:10.1021/acs.oprd.0c00442.
- K. Figueiredo, T. Alves and C. Borges, J. Appl. Polym. Sci., 2008, 111, 3074–3080 CrossRef.
- Q. G. Zhang, Q. L. Liu, A. M. Zhu, Y. Xiong and L. Ren, J. Membr. Sci., 2009, 335, 68–75 CrossRef CAS.
- V. S. Chandane, A. P. Rathod and K. L. Wasewar, Chem. Eng. Process., 2017, 119, 16–24 CrossRef CAS.
- J. Brandrup, E. H. Immergut and E. A. Grulke, Polymer Handbook, John Wiley, New York, 1999 Search PubMed.
- W. Cai, X. Cheng, X. Chen, J. Li and J. Pei, ACS Omega, 2020, 5, 6277–6287 CrossRef CAS.
- M. Kohoutová, A. Sikora, Š. Hovorka, A. Randová, J. Schauer, M. Tišma, K. Setničková, R. Petričkovič, S. Guernik, N. Greenspoon and P. Izák, Eur. Polym. J., 2009, 45, 813–819 CrossRef.
- J. Ge, Y. Cui, Y. Yan and W. Jiang, J. Membr. Sci., 2000, 165, 75–81 CrossRef CAS.
- J. Li, S. Ji, G. Zhang and H. Guo, Langmuir, 2013, 29, 8093–8102 CrossRef CAS.
- S. K. Choudhari and M. Y. Kariduraganavar, J. Colloid Interface Sci., 2009, 338, 111–120 CrossRef CAS.
- S. Chaudhari, D. W. Chang, K. Y. Cho, M. Y. Shon, Y. S. Kwon, S. E. Nam and Y. I. Park, J. Taiwan Inst. Chem. Eng., 2020, 114, 103–114 CrossRef CAS.
- O. G. Nik, A. Moheb and T. Mohammadi, Chem. Eng. Technol., 2006, 29, 1340–1346 CrossRef CAS.
- H. Fan, N. Wang, S. Ji, H. Yan and G. Zhang, J. Mater. Chem. A, 2014, 2, 20947–209457 RSC.
- X. Cheng, W. Cai, X. Chen, Z. Shi and J. Li, RSC Adv., 2019, 9, 15457–15465 RSC.
- H. Jiang, W. Shi, Q. Liu, H. Wang, J. Li, C. Wu, Y. Li and Z. Wei, Sep. Purif. Technol., 2021, 256, 117802 CrossRef CAS.
- K. Cao, Z. Jiang, J. Zhao, C. Zhao, C. Gao, F. Pan, B. Wang, X. Cao and J. Yang, J. Membr. Sci., 2014, 469, 272–283 CrossRef CAS.
- B. Liang, W. Zhan, G. Qi, S. Lin, Q. Nan, Y. Liu, B. Cao and K. Pan, J. Mater. Chem. A, 2015, 3, 5140–5147 RSC.
Footnote |
| † Electronic supplementary information (ESI) available. See DOI: 10.1039/d1ra00467k |
| This journal is © The Royal Society of Chemistry 2021 |

