 Open Access Article
Effect of relative percentage of acid and base sites on the side-chain alkylation of toluene with methanol
Huijun Li†
a,
Bin Wang† a,
Yueli Wen
 *b,
Chunyao Haoa,
Yuhua Liua and
Wei Huang
 *ac
*ac
aKey Laboratory of Coal Science and Technology of Ministry of Education and Shanxi Province, Taiyuan University of Technology, Taiyuan 030024, Shanxi, China. E-mail: huangwei@tyut.edu.cn
bCollege of Environmental Science and Engineering, Taiyuan University of Technology, Taiyuan, Shanxi 030024, China. E-mail: wenyueli@tyut.edu.cn
cCoal Conversion Technology & Engineering Co., Ltd., Taiyuan University of Technology, Taiyuan, 030024, Shanxi, China
First published on 8th April 2021
Abstract
K3PO4/NaX catalysts were prepared by loading potassium phosphate on NaX zeolite, and the catalytic performance was studied for the side-chain alkylation of toluene with methanol to styrene and ethylbenzene. Combined with the characterization of XRD, TPD-NH3, TPD-CO2, and FTIR and the determination of phosphorus content, it is revealed that firstly, the P element loaded on the catalyst surface can prominently promote the percentage of middle base sites, which will accordingly enhance the selectivity of the products (styrene and ethylbenzene) of side-chain alkylation of toluene; secondly, if there are enough middle base sites distributed on the catalysts, the higher percentage of strong base sites benefit the selectivity of styrene, which is confirmed by the performance of the two-stage catalysts.
1 Introduction
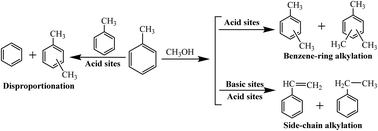
In 1967, Sidorenko et al. first reported that side-chain alkylation of toluene with methanol could form styrene and ethylbenzene on an alkali-metal modified X-zeolite catalyst,1 and thereafter researchers around the world followed this discovery. Recently, extensive efforts have been made on studying the reaction mechanism of the side-chain alkylation of toluene. It is well known that side-chain alkylation of toluene with methanol (SCAT) is an acid–base synergistic catalysis process.2–4 During the toluene side-chain alkylation process, the main reaction networks occur as follows:For the SCAT reaction, it is worth noting that both the base and acid sites are necessary. The base sites are in charge of absorbing and stabilizing toluene, while the acid sites are responsible for activating the C–H bonds on the side chain of toluene and dehydrogenation of methanol to formaldehyde.5,6 Otherwise, in this process, the formation of xylene by disproportionation of toluene and the benzene-ring alkylation of toluene will occur on acid sites.7 In addition, strong basic sites are required for the abstraction of H+ from toluene. However, very strong basic sites would promote the formation of formaldehyde from methanol, and formaldehyde would further decompose into carbon monoxide and hydrogen.8 Furthermore weak basic sites could only promote the dehydrogenation of methanol to formaldehyde without abstracting H+ from toluene. So it is very meaningful to discover the optimal acid–base property and amount of acid and base sites for side-chain alkylation of toluene with methanol.
In the study of catalysts for this reaction, most of the research has concentrated on the modification of various zeolites with alkali metals, alkaline earth metals and other promoters to adjust the acidity and alkalinity of the catalysts. Quite a lot of types of catalysts have been investigated for SCAT so far, like X zeolite catalysts modified with different composites (such as alkali earth metal,9,10 rare earth metal,11 transition metal,12–15 boron16,17 and phosphorus18–20), metal oxide catalysts,21,22 layered double hydroxides (LDHs),23,24 N-doped catalysts25,26 and other alkaline catalysts, in which X zeolite27–29 modified with alkaline metal showed the superior catalytic performance. Our group has prepared K3PO4/CsX catalysts and used for SCAT, and it was found that the moderate addition of K3PO4 could decrease the amount of weak acid sites and increase the amount of middle base sites. Herein, in order to discover how the acid/base sites affect the catalytic performance for SCAT, a series of K3PO4/NaX catalysts were prepared and the effect of the relative percentage of acid/base sites on this catalytic reaction were investigated in this work.
2 Experimental
2.1 Materials
All reagents including methanol, methylbenzene, potassium hydroxide, potassium phosphate, anhydrous ethanol were all of analytical grade (purchased from Tianjin Kemiou Chemical Reagent Co. Ltd of China) and were used without further purification. NaX zeolite (Si/Al = 1.25) were purchased from Tianjin Nankai University. Distilled water was used in all experiments without further treatment.2.2 Catalyst preparation
In order to discover how the strong base sites affect the side-chain alkylation of toluene with methanol to styrene, the co-catalyst was placed in front of pro-catalyst, separated by quartz wool.
2.3 Catalyst characterization
The powder X-ray diffraction (XRD) patterns were collected on a Rigaku D/Max-2500 (λ = 0.1542 nm) diffractometer with a Ni-filtered Cu Kα radiation source operating at 40 kV and 100 mA. The angle 2θ were recorded from 5° to 85° with a scanning rate of 8 min−1. Temperature-programmed desorption (TPD) was carried out using CO2 or NH3 as probe molecules. The procedures were as follows: 100 mg of fresh catalyst was preprocessed at 450 °C under He stream for 30 min and then cooled down to 50 °C. CO2 or NH3 was infused into the stream at 50 °C for 30 min. The physically adsorbed CO2 or NH3 was removed by He stream at 50 °C for 1 h. Then the catalyst was heated from 50 °C to 850 °C in He stream at a heating rate of 10 °C min−1, and the desorbed gas was detected by a thermal conductivity detector at the same time. Determination of P elements content in the catalysts was based on Chinese Standard GB175-1999 by using ultraviolet-visible (UV-vis) spectrophotometer. Fourier transform infrared spectroscopy (FTIR) were recorded on a Bio-Rad FTS-60A spectrometer with the KBr wafer technique.2.4 Catalysis reaction and products analysis
The evaluation of catalysis activity for side-chain alkylation of toluene with methanol was carried out at atmospheric pressure in a stainless steel fixed-bed reactor. In order to prevent blockage happening in the reactor, the catalysts were granulated to 40–60 mesh. The catalyst sample (0.9 g) was firstly activated at 450 °C for 2 h under a flow of N2 and then cooled down to 425 °C, the desired reaction temperature. The liquid mixture of toluene and methanol with a molar ratio of 5![[thin space (1/6-em)]](https://www.rsc.org/images/entities/char_2009.gif) :
:![[thin space (1/6-em)]](https://www.rsc.org/images/entities/char_2009.gif) 1 was pumped into the reactor using a peristaltic pump at a rate of 0.6 mL h−1, the vaporized reactants were diluted by flowing nitrogen stream (3 mL min−1). After the catalysts reached steady state, the reaction products were analyzed by an on-line gas chromatograph (GC950, China Shanghai HaiXin Chromatographic Instruments Co. Ltd) with a flame ionization detector (FID) using an FFAP capillary column (0.53 mm × 50 m).
1 was pumped into the reactor using a peristaltic pump at a rate of 0.6 mL h−1, the vaporized reactants were diluted by flowing nitrogen stream (3 mL min−1). After the catalysts reached steady state, the reaction products were analyzed by an on-line gas chromatograph (GC950, China Shanghai HaiXin Chromatographic Instruments Co. Ltd) with a flame ionization detector (FID) using an FFAP capillary column (0.53 mm × 50 m).
The conversion of methanol, selectivity and yield of the products (SX and YX) were defined in the following equations:
| YX = SX × CMeth |
3 Results and discussion
3.1 Catalyst characterization
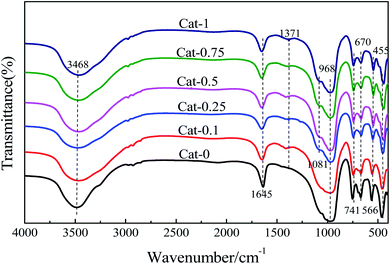
![[double bond, length as m-dash]](https://www.rsc.org/images/entities/char_e001.gif) O was found at 1371 cm−1 in the catalyst obtained by ion exchange with the K3PO4 solution compared to NaX. When the concentration of K3PO4 solution is larger than 0.1 mol L−1, a weak absorption peak appears at 1081 cm−1, which belongs to the P–O vibration of K3PO4. This indicated that when K3PO4 with higher concentrations were used as an exchange solution, some of the PO43− ions could be loaded on the catalyst.
O was found at 1371 cm−1 in the catalyst obtained by ion exchange with the K3PO4 solution compared to NaX. When the concentration of K3PO4 solution is larger than 0.1 mol L−1, a weak absorption peak appears at 1081 cm−1, which belongs to the P–O vibration of K3PO4. This indicated that when K3PO4 with higher concentrations were used as an exchange solution, some of the PO43− ions could be loaded on the catalyst.
| Catalyst | Weak/all (%) | Middle/all (%) |
|---|---|---|
| Cat-0 | 67 | 33 |
| Cat-0.1 | 97 | 3 |
| Cat-0.25 | 95 | 5 |
| Cat-0.5 | 95 | 5 |
| Cat-0.75 | 93 | 7 |
| Cat-1 | 97 | 3 |
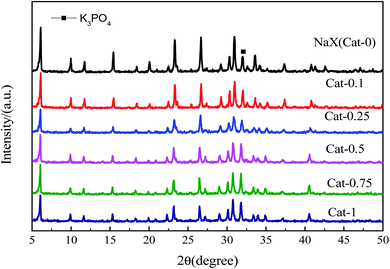
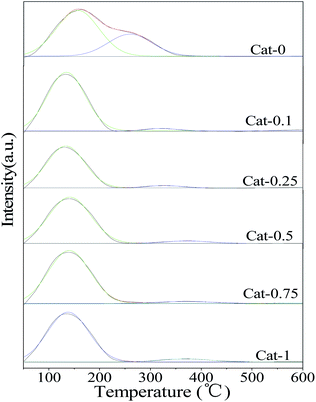
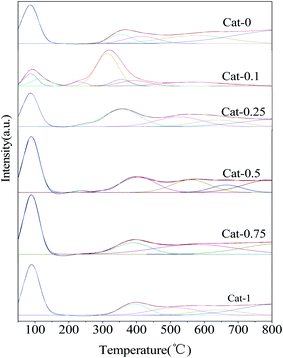
The CO2-TPD curves of Cat-n catalysts after the ion-exchanged are shown in Fig. 4. It can be seen that all the samples have three isolated desorption peaks zones: the first one in the range of 50–250 °C belongs to weak base sites, the second one in 250–500 °C can be attributed to middle base sites, and the last one located around 500–700 °C can be attributed to strong base sites. With the increase of the concentration of K3PO4 solution, the middle base sites shift toward higher temperature, which indicates that the middle base strength of the catalyst is enhanced by increasing the concentration of K3PO4 solution. The peak area of TPD curve is a function of the amount of acid/base sites.31 By integrating the peak areas of different types of base sites distributed in the three regions (weak base, middle base and strong base) in each catalyst respectively, and calculating the percentage of the amount of weak, middle or strong base sites in total base sites, the final results are summarized in Table 2. It is found that when the concentration of the K3PO4 solution were 0.1 mol L−1 and 0.25 mol L−1, the middle base sites and strong base sites account for the largest proportion in total base sites respectively. With the concentration of K3PO4 solution increasing, the percentage of the amount of the middle base sites decreased. That might because the lower concentration of K3PO4 solution could combine better with NaX to improve alkalinity and alkali content of the catalyst significantly, which is consistent with the XRD analysis.
| Catalyst | Weak/all | Middle/all (%) | Strong/all (%) |
|---|---|---|---|
| Cat-0 | 21 | 15 | 64 |
| Cat-0.1 | 22 | 62 | 16 |
| Cat-0.25 | 21 | 25 | 54 |
| Cat-0.5 | 33 | 19 | 48 |
| Cat-0.75 | 32 | 13 | 55 |
| Cat-1 | 32 | 12 | 56 |
| Catalyst | Cat-0.1 | Cat-0.25 | Cat-0.5 | Cat-0.75 | Cat-1 |
| CP (mg L−1) | 14.82 | 10.87 | 10.26 | 10.30 | 10.22 |
3.2 Catalytic reaction
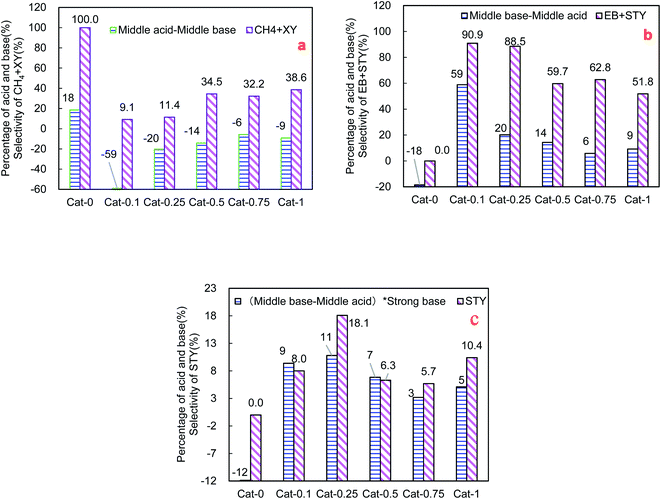
A series of catalysts Cat-n were evaluated on fix-bed reactor for the side-chain alkylation of toluene with methanol. The catalytic reaction results were shown in Table 4, from which it could be seen that ethylbenzene and styrene are the main products, and formaldehyde is an intermediate product, accompanied by some by-products such as xylene and methane. The selectivities and yields of the main products are significantly improved over the catalysts loaded with K3PO4 via ion-exchange method. When the concentration of K3PO4 solution is 0.1 mol L−1, the selectivity of ethylbenzene reaches the highest value (82.9%); in addition, when the K3PO4 solution concentration is 0.25 mol L−1, the selectivity of styrene is the highest (18.1%). But when the K3PO4 solution concentration is more than 0.5 mol L−1, the selectivity and yield of the main products (ethylbenzene and styrene) begin to decrease, the selectivity of xylene and methane start to increase at the same time.| Catalyst | MET conv% | Selectivity of products (%) | Yield of products (%) | ||||||
|---|---|---|---|---|---|---|---|---|---|
| SEB | SSTY | SCH4 | SXY | SHCHO | YEB | YSTY | Y(EB+STY) | ||
| Cat-0 | 99.9 | 0.0 | 0.0 | 16.9 | 83.1 | 0.0 | 0.0 | 0.0 | 0.0 |
| Cat-0.1 | 99.9 | 82.9 | 8.0 | 5.4 | 3.7 | 0.0 | 82.8 | 8.0 | 90.8 |
| Cat-0.25 | 99.9 | 70.4 | 18.1 | 8.2 | 3.2 | 0.0 | 70.4 | 18.1 | 88.5 |
| Cat-0.5 | 99.8 | 53.4 | 6.3 | 25.2 | 9.3 | 5.9 | 53.3 | 6.3 | 59.6 |
| Cat-0.75 | 99.7 | 57.1 | 5.7 | 20.3 | 11.9 | 5.0 | 56.9 | 5.7 | 62.6 |
| Cat-1 | 99.8 | 41.4 | 10.4 | 19.2 | 19.4 | 9.5 | 41.4 | 10.4 | 51.8 |
In order to figure out why the selectivities of ethylbenzene and styrene were much different for the same series of catalysts, the correlation analysis between the distribution of the acid and base sites and the catalytic performance was carried out as shown in Fig. 5. Herein three relative percentages of acid and base sites are introduced to depict the formation probability of phenyl cation, benzyl anion and formaldehyde. From Fig. 5a and b, the selectivity of (ethylbenzene + styrene) shows the same tendency with relative percentage of (middle base–middle acid). In contrast, the relative percentage of (middle acid–middle base) exhibits the same tendency with the selectivity of (methane + xylene). Furthermore, the percentage of [(middle base–middle acid) × strong base] has the same tendency with the selectivity of styrene as shown in Fig. 5c.
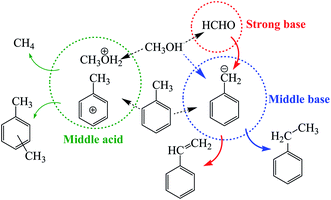
According to the above results, the mechanism for SCAT reaction was proposed as shown in Fig. 6. Toluene and methanol are sensitive to the base and acid property of catalyst. A pair of competitive activations of toluene take place on middle acid and middle base sites respectively, that is, toluene converts to phenyl cation (activation of the benzene ring of toluene) over middle acid sites while it tends to become benzyl anion (activation of the side chain of toluene) over middle base sites. The more middle base sites and the less middle acid sites present on the surface of the catalyst, the more benzyl anion will be formed. Thus the relative percentage of (middle base–middle acid) can be used to depict the formation probability of benzyl anion. Therefore it indicates that the middle base is a key requirement for the SCAT reaction. Benzyl anion will be consumed along two pathways. Part of benzyl anions will combine with methanol (raw material) to form ethylbenzene, the other part of benzyl anions will bond with formaldehyde (derived from methanol on strong base sites) to form styrene. The more strong base sites appear on the surface of catalyst, the more formaldehyde will be produced, the relative percentage of the strong base can be used to describe the formation probability of formaldehyde. In brief, the distribution of [(middle base–middle acid) × strong base] shows the same tendency with the styrene selectivity changing for the Cat-n series of catalysts as shown in Fig. 5c.
In order to verify the strong base sites that could promote the side-chain alkylation of toluene with methanol to form styrene, a series of co-catalysts m%KOH/NaX were prepared and placed in front of Cat-0.1, where there are abundant middle base sites, and separated by quartz wool. Under the same catalytic reaction condition the catalytic performance for the SCAT reaction are showed in Table 5. Compared to Cat-0.1, the selectivity of styrene is enhanced significantly after introducing co-catalysts in. When the co-catalyst is replaced by 5 wt% KOH/Cat-0.1, the selectivity of styrene reaches 42.4%, which suggests that the sufficient middle and strong base sites are the key factors for the SCAT reaction to styrene.
| Catalyst | MET conv% | Selectivity of products (%) | Yield of products (%) | ||||||
|---|---|---|---|---|---|---|---|---|---|
| SEB | SSTY | SCH4 | SXY | SHCHO | YEB | YSTY | Y(EB+STY) | ||
| Cat-0.1 | 99.9 | 82.9 | 8.0 | 5.4 | 3.7 | 0.0 | 82.8 | 8.0 | 90.8 |
| 3%KOH/Cat-0.1 | 99.7 | 60.0 | 17.8 | 3.1 | 19.0 | 0.0 | 59.9 | 17.8 | 77.6 |
| 5%KOH/Cat-0.1 | 99.9 | 45.3 | 42.4 | 0.9 | 11.5 | 0.0 | 45.2 | 42.4 | 87.6 |
4 Conclusions
From the characterization of the catalysts, NaX exchanged with potassium phosphate solution can obviously improve the catalytic activity and the selectivity of ethylbenzene and styrene for the SCAT reaction. Toluene and methanol are very sensitive to the base and acid property of the catalysts, that is different and competitive activations will take place for toluene and methanol over middle acid and middle base sites respectively. More middle base sites and less middle acid sites on the surface of the catalyst are beneficial to forming ethylbenzene and styrene. Furthermore, more strong base sites are in the favor of producing formaldehyde; if the middle base sites are enough exactly at the right moment, the selectivity of styrene will be greatly enhanced. That is, the enough middle and strong base sites are both necessary for the SCAT reaction to prepare styrene.Conflicts of interest
There are no conflicts to declare.Acknowledgements
The authors are grateful to the financial support from the National Key Technology Research & Development Program (Grant No. 2013BAC14B04), the National Natural Science Foundation of China (Grant No. 21336006), the Shanxi Province Key Research & Development Program (International Cooperation, Grant No. 201803D421099), Research Project supported by Shanxi Scholarship Council of China (Grant No. 2017-035).References
- Y. N. Sidorenko, P. N. Galich, V. S. Gutyrya, V. G. Ilin and I. E. Neimark, Dokl. Akad. Nauk SSSR, 1967, 173, 132–134 CAS.
- J. Jiang, G. Lu, C. Miao, X. Wu, W. Wu and Q. Sun, Microporous Mesoporous Mater., 2013, 167, 213–220 CrossRef CAS.
- A. E. Palomares, G. Eder-Mirth and J. A. Lercher, J. Catal., 1997, 168, 442–449 CrossRef CAS.
- H. Itoh, A. Miyamoto and Y. Murakami, J. Catal., 1980, 64, 284–294 CrossRef CAS.
- A. Philippou and M. W. Anderson, J. Am. Chem. Soc., 1994, 116, 5114–5183 CrossRef.
- H. Hattori, Appl. Catal., A, 2015, 504, 103–109 CrossRef CAS.
- J. M. Serra, A. Corma, D. Farrusseng, L. Baumes, C. Mirodatos, C. Flego and C. Perego, Catal. Today, 2003, 81, 425–436 CrossRef CAS.
- H. Han, M. Liu, X. W. Nie, F. S. Ding, Y. R. Wang, J. J. Li, X. W. Guo and C. S. Song, Microporous Mesoporous Mater., 2016, 234, 61–72 CrossRef CAS.
- P. Kovacheva, A. Predoeva, K. Arishtirova and S. Vassilev, Appl. Catal., A, 2002, 223, 121–128 CrossRef CAS.
- T. Zhang, J. Hu and S. W. Tang, Chin. J. Chem. Eng., 2018, 26, 1513–1521 CrossRef CAS.
- M. L. Unland and G. E. Baker, US Pat., 4115424, Sep 19, 1978 Search PubMed.
- C. Lacroix, A. Deluzarche, A. Kiennemann and A. Boyer, Zeolites, 1984, 4, 109–111 CrossRef CAS.
- L. L. Song, Y. Yu, Z. R. Li, S. Q. Guo, L. F. Zhao and W. Li, J. Braz. Chem. Soc., 2014, 25, 1346–1354 CAS.
- N. K. Das and K. Pramanik, J. Indian Chem. Soc., 1997, 74, 701–704 CAS.
- H. Hattori, A. A. Amusa, R. B. Jermy, A. M. Aitani and S. S. Al-Khattaf, J. Mol. Catal. A: Chem., 2016, 424, 98–105 CrossRef CAS.
- B. B. Tope, W. O. Alabi, A. M. Aitani, H. Hattori and S. S. Al-Khattaf, Appl. Catal., A, 2012, 443, 214–220 CrossRef.
- W. O. Alabi, B. B. Tope, R. B. Jermy, A. M. Aitani, H. Hattori and S. S. Al-Khattaf, Catal. Today, 2014, 226, 117–123 CrossRef CAS.
- J. Z. Yin, Z. Ma, Z. Y. Shang, D. P. Hu and Z. L. Xiu, Fuel, 2012, 93, 284–287 CrossRef CAS.
- Y. S. Choi, H. Kim, S. H. Shin, M. Cheong, Y. J. Kim, H. G. Jang, H. S. Kim and J. S. Lee, Appl. Catal., A, 2014, 144, 317–324 CrossRef CAS.
- H. H. Wang, B. Wang, Y. L. Wen and W. Huang, Catal. Lett., 2017, 147, 161–166 CrossRef CAS.
- N. Jiang, H. Jin, E. Y. Jeong and S. E. Park, J. Nanosci. Nanotechnol., 2010, 10, 227–232 CrossRef CAS PubMed.
- H. L. Chen, J. Ding and Y. M. Wang, Acta Phys.-Chim. Sin., 2013, 29, 1035–1040 CAS.
- J. M. Lee, Y. J. Min, K. B. Lee, S. G. Jeon, J. G. Na and H. J. Ryu, Langmuir, 2010, 26, 18788–18797 CrossRef CAS PubMed.
- R. Manivannan and A. Panduranggan, Catal. Lett., 2002, 81, 119–124 CrossRef CAS.
- B. Wang, W. Huang, Y. L. Wen, Z. J. Zuo, Z. H. Gao and L. H. Yin, Catal. Today, 2011, 173, 38–43 CrossRef CAS.
- B. Wang, W. Huang and Y. Wen, Energy Sources, Part A, 2011, 33, 1933–1939 CrossRef CAS.
- H. H. Chen, X. C. Li, G. Q. Zhao, H. B. Gu and Z. R. Zhu, Chin. J. Catal., 2015, 36, 1726–1732 CrossRef CAS.
- M. D. Sefcik, J. Am. Chem. Soc., 1979, 101, 2164–2170 CrossRef CAS.
- C. Flego, G. Cosentino and M. Tagliabue, Appl. Catal., A, 2004, 270, 113–120 CrossRef CAS.
- M. Yuan, M. Tan, G. Yan and J. Tao, Chin. J. Process Eng., 2009, 9, 1210–1215 CAS.
- E. Diaz, E. Munoz, A. Vega and S. Ordonez, Chemosphere, 2008, 70, 1375–1382 CrossRef CAS PubMed.
Footnote |
| † Huijun Li and Bin Wang are co-first authors who have equally contributed to this work. |
| This journal is © The Royal Society of Chemistry 2021 |

