 Open Access Article
A study on hydrogen storage performance of Ti decorated vacancies graphene structure on the first principle
Hong Cuiab,
Ying Zhang *ab,
Weizhi Tianab,
Yazhou Wangab,
Tong Liuab,
Yunjian Chenab,
Pengyue Shanab and
Hongkuan Yuanc
aSchool of Mechanical Engineering, Shaanxi University of Technology, Hanzhong, Shaanxi 723001, China. E-mail: zhangying@stu.snut.edu.cn
bShaanxi Key Laboratory of Industrial Automation, Shaanxi University of Technology, Hanzhong, Shaanxi 723001, China
cSchool of Physical Science and Technology, Southwest University, Chongqing, 400715, P. R. China
First published on 14th April 2021
Abstract
The structural properties, formation energy, adsorption energy, and electronic properties of vacancy graphene are studied by first-principles analysis. We found that the formation energy and adsorption energy of double vacancy graphene (DVG-4) are the largest. A single defect in DVG-4 can adsorb at least nine hydrogen molecules, and compared with Ti modified single vacancy graphene (SVG–Ti), the adsorption capacity is increased by 80%. When DVG-4 adsorbs the second, third, and fourth hydrogen molecules, the adsorption energy is greater than 0.7 eV, which is not conducive to the release. Density of state (DOS) and electron density difference (EDIFF) results reveal that charge transfer occurs among hydrogen molecules, Ti atoms, and DVG-4, decreasing the hydrogen adsorption capacity of DVG-4 by 33%. DVG - 4 has the potential to become an excellent hydrogen storage material.
Introduction
In recent years, multifarious studies have been carried out on the safe storage of hydrogen with the development of the new energy automobile industry.1,2 In the field of hydrogen storage materials research, two-dimensional carbonaceous materials,3–5 especially graphene,6,7 have attracted considerable attention due to their characteristics of a large specific surface area, high ductility, and high adsorption speed.8–10 Generally, two basic processes are employed for hydrogen storage: (i) the polarization of H2 molecules is induced by generating an electric field,11,12 and (ii) H2 molecules are hybridized with impurity atoms or substrates by the Kubas action.12,13 The adsorption energy between hydrogen molecules and solid materials ranges between 0.2 eV and 0.6 eV, which is conducive to the storage and release of hydrogen at room temperature.14,15The adsorption energy of hydrogen molecules on pure graphene is very low, thus they cannot be stably adsorbed on graphene.16,17 Researchers have applied different methods, such as doping and defect modification,16,18–21 to modify the surface of graphene to improve its interaction with hydrogen molecules.22–24 Metal atoms are dispersed better on vacancy graphene than on pure graphene.3 Vacancy graphene can enhance the interaction between impurity atoms and hydrogen molecules due to the presence of unsaturated C atoms, leading to enhanced hydrogen storage capacity.25
The influences of vacancy defects on the hydrogen storage performance of graphene have been studied extensively.26,27 Rangel group3 investigated the hydrogen storage performance of Li-modified graphene based on the density functional theory. It was found that a single lithium atom was adsorbed on the vacancy site of graphene, and its binding energy was greater than the cohesive energy of lithium. The system was found to be stable, and it could store up to 6.2 wt% hydrogen at atmospheric pressure. Further, the average adsorption energy of hydrogen molecules by the system was too large (0.875 eV/H2), making it difficult to release hydrogen molecules.3 Fair group28 studied the adsorption of stable double carbon vacancies (DCVs) by 12 metal atoms through first principles. It was noticed that DCVs stably adsorbed Ca, Sc, Sr, and other atoms, and the binding energies were greater than their cohesive energies. Among them, Ca and Sr had the largest binding capacity (six H2 molecules).28 However, theoretical and experimental investigations found that Ti-decorated graphene was suit practical applications in hydrogen storage.29
In previous studies, vacancy graphene was modified by doping to improve the hydrogen storage performance. The effects of the size and location of defects on the electronic and hydrogen storage properties of vacancy graphene are still not clear. In the present work, the electronic properties and stable hydrogen storage structures of single vacancy graphene (SVG) and double vacancy graphene (DVG-N (N = 1–5)) were studied by first-principles calculations. The hydrogen storage capacity and adsorption energy of SVG, DVG-4, and Ti-decorated double vacancy graphene (DVG-4–Ti) and the electronic properties of hydrogen molecules adsorbed by the constructed systems were investigated by the state density and the differential charge density.
Methodology
In this paper, the structure of Ti-decorated vacancy graphene has been optimized by first principles analysis using CASTEP software. The adsorption performance of the optimized structure was calculated to obtain the most stable hydrogen storage capacity and adsorption energy.In the geometric optimization process, the graphene structure was optimized by the PBE functional of the generalized gradient approximation (GGA)30 of the electron exchange-correlation potential.31 The adopted electron exchange potential could not accurately estimate the energy of the structures, therefore, the “Grimme” dispersion correction was employed in the optimization process and hydrogen adsorption processes. The ultra-soft pseudo-potential was used to describe the electrons–ion interactions, and the self-consistent iterative method (SCF) was employed to perform energy calculations. A 5 × 5 × 1 supercell model was selected for calculations. The Z-direction of the supercell was perpendicular to the graphene plane, and a vacuum layer of 20 Å was added to nullify the effects between different layers. In the inverted K space, the truncation energy of the plane wave expansion was set to 500 eV. The k-point value of the Brillouin region was 4 × 4 × 1. The structures are fully optimized without any symmetry constraints, and the geometry optimization structure are obtained by relaxation until the force on each atom is less than 0.02 eV Å−1 and the energy tolerances is less than 1.0 × 10⁻⁵ eV per atom. The convergence threshold of 1.0 × 10⁻⁶ eV per atom is selected in the self-consistent field (SCF) calculations.
The vacancy formation energy was calculated by the following formula:32
| Evac = (E(G+vac) − ((n − 1)/n)E(G))/j |
| Eb = (E(G+vac) + E(mTi) − E(G+vac+mTi))/m |
| Ead = (E(G+vac+iH2) − (E(G+vac) + iE(H2)))/i |
Results and discussion
In the present section, the geometric structure of vacancy graphene with different defect sizes and positions, adsorption position tests, adsorption energy size and capacity, and the state density and differential charge density of the structure after hydrogen storage are discussed.Structure of vacancy graphene
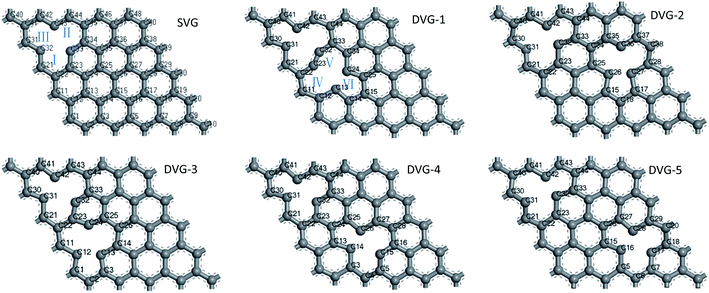
Induced defects had a great impact on the geometry of the graphene substrate. Fig. 1 displays the optimized geometries of SVG and DVG-N (N = 1–5). The structures became distorted due to the effect of unsaturated C atoms. The SVG structure withstood an external force of 2.3 MPa, and the external force on DVG-N changed between 1.2 and 9.2 MPa according to the defect position. The external force effectively dispersed the impurity atoms modifying the graphene surface, changed the electronic properties of graphene, and improved the hydrogen storage performance.24 The adsorption energy and hydrogen storage capacity of vacancy graphene were improved as compared to pure graphene. The σ and Π bonds of C atoms connected to the defects were destroyed, and free electrons appeared on the outermost layer of C atoms, increasing the surface activity of graphene.2,35Point defects had an effect on the geometry of graphene, and a pentagon-like structure was formed at point defects. The changes in the C–C bond lengths of carbocycles I, II, and III are presented in Table 1. The bond length changed greatly after the defect was introduced (original C–C bond length = 1.420 Å). The maximum and minimum values of the bond lengths were detected as 1.524 Å and 1.204 Å, respectively. The changes in the bond lengths of carbocyclic rings IV, V, and VI were similar to those of carbocyclic rings I, II, and III.
| DC–C(Å) | SVG | DVG-1 | DVG-2 | DVG-3 | DVG-4 | DVG-5 | |
|---|---|---|---|---|---|---|---|
| Carbocycle I | DC31–C21 | 1.403 | 1.474 | 1.372 | 1.513 | 1.483 | 1.377 |
| DC21–C22 | 1.415 | 1.423 | 1.436 | 1.416 | 1.423 | 1.412 | |
| DC22–C23 | 1.409 | 1.323 | 1.460 | 1.372 | 1.397 | 1.423 | |
| DC23–C32 | 1.375 | 1.204 | 1.480 | 1.338 | 1.376 | 1.489 | |
| Carbocycle II | DC32–C33 | 1.375 | 1.323 | 1.425 | 1.345 | 1.377 | 1.428 |
| DC33–C44 | 1.409 | 1.385 | 1.396 | 1.411 | 1.401 | 1.382 | |
| DC44–C43 | 1.415 | 1.478 | 1.382 | 1.428 | 1.436 | 1.396 | |
| DC43–C42 | 1.403 | 1.524 | 1.426 | 1.481 | 1.483 | 1.424 | |
| Carbocycle III | DC42–C41 | 1.390 | 1.432 | 1.489 | 1.405 | 1.440 | 1.478 |
| DC41–C40 | 1.401 | 1.400 | 1.422 | 1.391 | 1.389 | 1.461 | |
| DC40–C30 | 1.408 | 1.389 | 1.412 | 1.399 | 1.394 | 1.436 | |
| DC30–C31 | 1.390 | 1.401 | 1.357 | 1.401 | 1.431 | 1.372 |
The calculations indicate that the energy bandgap of the SVG structure increased to 0.215 eV, whereas the energy bandgap of DVG-N changed between 0.159 eV and 0.169 eV according to the defect position. The DVG-N structures has a lower bandgap lower than SVG and manifested semi-metallic properties,36 improving the adsorption capacity and energy of graphene. We recalculate the SVG and DVG-4 energy bandgaps using the HES06 hybrid density functional because standard PBE functional would underestimate the energy gaps of semiconductors. The result show that the energy bandgap of the SVG structure is 0.334 eV, whereas the energy bandgap of DVG-N changed between 0.245 eV and 0.259 eV.
Adsorption site
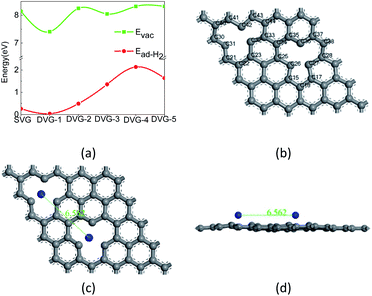
Fig. 2(a) show that the defect formation energy, and the adsorption energy and of hydrogen molecules on SVG, DVG-N (N = 1–5) structures and Fig. 2 (b) show that the adsorption sites of Ti atom at graphene.Fig. 2 (a) reveals that with the change of the position of two-point defects, the formation energy of a single defect varied between 7.41 eV and 8.35 eV, which is similar to the formation energy of single-defect graphene (7.7–7.8 eV).37 The adsorption energy of two hydrogen molecules on DVG-N first increased and then decreased with the increasing number of defects. The formation energy of DVG-4 is the highest, so the hydrogen storage capacity of DVG-4 structure will be studied in the following part. To confirm the structural stability of DVG-4 structure, we have recalculated it using molecule dynamic. The result shows that the structure of DVG-4 does not have obvious deformation at 300 K, and its energy changes in a small range.
The elastic property of crystal determines the mechanical stability of crystal structure. In order to obtain the stability of SVG and DVG-4 structures, we calculated their elastic constants. Table 2 show that the elastic stiffness constants of G, SVG and DVG-4. C11 and C22 reflect the linear compression along the directions a and b of the material elastic constants, and C44 is the indentation hardness.38 Table 2 show that the size of C11 and C22 are decreasing from G, SVG, DVG-4. It indicates that the incompressible performance gradually decreases under uniaxial stress along a and b directions of G, SVG and DVG-4 structural system, and C22 is greater than C11, which means that the incompressible performance of b axis is harder than a. From Table 2, the C44 increases gradually, which indicates that the indentation hardness increases of the systems. Table 2 shows that the plane of G, SVG and DVG-4 structure is weak in resisting shear deformation due to the value of C44 are all small.
| Systems | Elastic stiffness constants Cij (GPa) | |||
|---|---|---|---|---|
| G11 | G12 | G22 | G44 | |
| G | 514.240 | 88.289 | 517.973 | 0.605 |
| SVG | 74.130 | 17.945 | 465.488 | 1.055 |
| DVG-4 | −110.858 | −113.368 | 227.611 | 1.441 |
The most stable adsorption sites of Ti atoms and H2 molecules in SVG and DVG-4 were investigated before studying the hydrogen storage structure of SVG and DVG-4. The periodic vacancies graphene structure of 5 × 5 × 1 was constructed. Ti atoms and H2 molecules had three adsorption sites on SVG: top (T) site – the added atom was located directly above the C32 atom, hollow (H) site – the added atom was located at the center of the defect center, and bridge (B) site – the added atom was located in the middle of C23 and C32 bond (Fig. 2), Ti atoms and hydrogen molecules had six adsorption sites on DVG-4: HH, BB, TT, HB, HT, BT respectively.39,40
The binding energies of Ti atoms adsorbed on the H, B, and T sites of SVG were calculated to be 4.05 eV, 3.94 eV, and 3.93eV, respectively through Eb = (E(G+vac) + E(mTi) − E(G+vac+mTi))/m. Hence, the entire structure was more stable when Ti atoms were adsorbed on the H-sites of SLG. The adsorption energies of H2 molecules at the H, B, and T sites were 0.26 eV, 0.08 eV, and 0.08 eV, respectively, and it reveals that H2 molecules were easily adsorbed at the H-sites of SVG.
The binding energies of Ti atoms at the adsorption sites (HH, BB, TT, HB, HT, BT) were tested, and their corresponding binding energies were found as 4.07 eV, 4.05 eV, 4.03 eV, 3.69 eV, 3.95 eV, and 3.96 eV, respectively. So the binding energy of Ti atoms at the HH-site of DVG-4 was higher than other sites. Although the binding energy are smaller than the cohesive energy of bulk Ti-metal (4.85 eV), the two Ti atoms in Ti–DVG-4 did not form a cluster. Because the distance between the two Ti atoms remained about 6.562 Å before and after geometric optimization, which is far greater than the distance between the two Ti atoms when they form cluster, which is show in the Fig. 2(c) and (d). The adsorption energies of H2 molecules at the adsorption sites (HH, BB, TT, HB, HT, BT) of DVG-4 were found to be 0.26 eV, 0.08 eV, and 0.08 eV, 0.16 eV, 0.12 eV, and 0.10 eV, respectively. Hence, it can be inferred that Ti atoms and H2 molecules were stable at the H-site of DVG-4.
Adsorption energy of hydrogen molecular
Fig. 3 (a)–(c) display the structures of SVG–Ti, DVG-4, and DVG-4–Ti, and Fig. 3 (d)–(f) are the molecular models of SVG–Ti, DVG-4, DVG-4–Ti after hydrogen adsorption. Fig. 3(b) reveals that the three carbon rings connected to the defects became distorted, destroying the basic graphene structure. Fig. 3(c) shows that the distortion of DVG-4 structure is significantly reduced due to the orbital hybridization between Ti atoms and C atoms.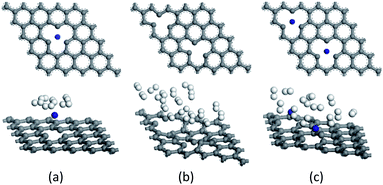 | ||
| Fig. 3 The hydrogen adsorption geometries. (a)–(c) The SVG–Ti, DVG-4, DVG-4 + Ti after hydrogen molecules are adsorbed wherein the blue sphere is Ti atom, gray is a C atom, white is H atom. | ||
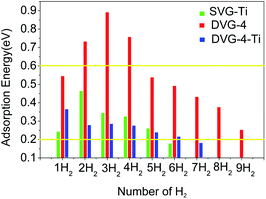
A single hydrogen molecule was added to the SVG–Ti structure, whereas two hydrogen molecules were gradually incorporated into DVG-4 and DVG-4–Ti to study the adsorption capacity and energy of hydrogen molecules, and the corresponding results are presented in Fig. 4. The hydrogen storage capacity and adsorption energy of DVG-4 were much larger than those of SVG–Ti, and the hydrogen storage capacity of DVG-4–Ti was, respectively, smaller and greater than those of DVG-4 and SVG–Ti.
Fig. 4 reveals that in the SVG–Ti structure, the adsorption energy first increased and then decreased with the increasing number of hydrogen molecules. When the SVG–Ti structure adsorbed the first to fifth hydrogen molecules, the adsorption energy was in the desirable range of 0.2–0.6 eV (according to the US Department of Energy).11,41 When the sixth hydrogen molecule was adsorbed, the adsorption energy was 0.18 eV, and it indicates that the SVG structure could stably adsorb five hydrogen molecules. In the DVG-4 structure, the adsorption energy first increased and then decreased with the increasing number of hydrogen molecules. According to Fig. 4, a single defect in DVG-4 could adsorb at least nine hydrogen molecules. When DVG-4 adsorbed the second, third, and fourth hydrogen molecules, their adsorption energies were too high (0.73 eV, 0.89 eV, and 0.76 eV, respectively), thus it was not possible to release hydrogen molecules at room temperature. Therefore, Ti atoms were adsorbed on the DVG-4 structure to solve this problem. The maximum number of single-defect hydrogen molecules adsorbed in the DVG-4–Ti structure was six, and their adsorption energies reached the conditions of reversible release and absorption at room temperature. When DVG-4–Ti adsorbed the seventh hydrogen molecule, the adsorption energy was 0.17 eV, hence, it was not stably adsorbed on the DVG-4–Ti substrate.
The hydrogen storage mass percentage of H2 molecules on DVG-4 can be defend as H2(wt%) = (MH2/(MH2+ MDVG-4)) × 100%, where, MH2 is the mass of hydrogen and MDVG-4 is the mass of DVG-4. The hydrogen storage mass percentage of H2 molecules on DVG-4–Ti can be defend as H2 (wt%) = (MH2/(MH2 + MTi+DVG-4)) × 100%, where, MTi+DVG-4 is the mass of DVG-4–Ti.
The hydrogen storage mass percentage of H2 molecules on DVG-4 was calculated as 5.92 wt% (include the second, third, and fourth hydrogen molecules, the adsorption energy is greater than 0.7 eV, which is not conducive to the release.), and the hydrogen storage mass percentage of H2 molecules on DVG-4–Ti was calculated as 4.0 wt%. The mass hydrogen storage density decreased after Ti-decorated DVG-4.
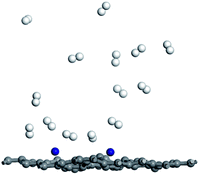
In order to investigate desorption behavior of H2 at elevated temperature, the hydrogen desorption properties of Ti–DVG-4 have been studied using molecule dynamic simulations. Fig. 5 is the hydrogen adsorption geometries of Ti–DVG-4 structure at 400 K. Fig. 5 shows that, at 400 K, only 35.71% of hydrogen molecules were adsorbed by Ti–DVG-4 structure, and 64.29% of hydrogen molecules were released.
Partial density of states
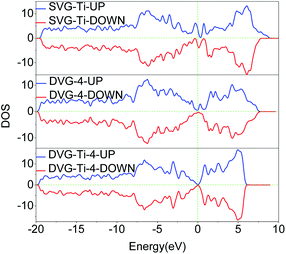
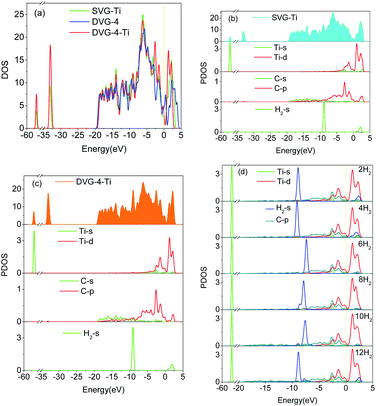
The total density of state (DOS) and the partial density of state (PDOS) were used to reveal the electronic properties of the structure and the interactions between atoms. Fig. 6 presents the spin polarization DOS of SVG–Ti, DVG-4 and DVG-4–Ti. Fig. 7 presents the DOS and PDOS values of SVG–Ti, DVG-4, and DVG-4–Ti structures. It is discernible from Fig. 6 and 7(a) that at the Fermi level, the DOS values of these three structures were different from that of pure graphene and all of them exhibited semi-metallic properties.Fig. 7(b) displays the DOS diagram of SVG–Ti after the adsorption of a single hydrogen molecule. The DOS of SVG–Ti had a large span, thus electrons were delocalized and non-localized. Moreover, the p orbital of C atoms and the d orbital of Ti atoms became hybridized, resulting in a charge transfer and the stable adsorption of Ti atoms on SVG. At the Fermi level, the s orbital of hydrogen molecules and the d orbital of Ti atoms were hybridized, and an ionic interaction occurred between these two.33,42 Orbital hybridization occurred between hydrogen molecules and C atoms between −9 and −7 eV. Fig. 6(c) presents the DOS curve of DVG-4–Ti after the adsorption of two hydrogen molecules. It is clear that an interaction between the orbits of atoms occurred around the Fermi level. A charge transfer between the s orbit of hydrogen molecules and the p orbit of C atoms occurred between −10 and 8 eV. Further, the d orbital of Ti atoms and the p orbital of C atoms became hybridized between −5 and 0 eV, causing a decrease in the adsorption energy between hydrogen molecules and the DVG structure after the introduction of Ti atoms. Between 0 and 2.5 eV, hybridization occurred between the d orbital of Ti atoms and hydrogen molecules, and the interaction was transformed from electrostatic to the Kubas type, allowing the stable adsorption of hydrogen molecules on the DVG-4 substrate.12,43 Fig. 7(d) displays the PDOS diagram of each atom after the adsorption of different numbers of hydrogen molecules. It is noticeable that the peak of hydrogen molecules changed with the change of the number of adsorbed hydrogen molecules. With the increasing number of adsorbed hydrogen molecules, the peak shifted to the right, then to the left, and finally, returned to the original position. The peak of the s orbit of H2 molecules above the Fermi level shifted downward, however, when the system adsorbed 12 hydrogen molecules, the peak again increased.
Electronic charge density difference
Electron density difference (EDIFF) can more accurately reflect the interactions among hydrogen molecules, Ti atoms, and the DVG-4 structure. Fig. 8 displays the differential charge density results of hydrogen molecules adsorbed by the DVG-4–Ti structure. It is noticeable that an ionic interaction and charge transfer occurred among some hydrogen molecules, Ti atoms, and the underlying graphene due to electron loss (yellow area) and accumulation (blue area). Ti atoms and the DVG-4 structure are electron donors, whereas hydrogen molecules are electron acceptors. Moreover, some H2 molecules became polarized by the influences of Ti atoms and the DVG-4 structure.44 In addition to Ti atoms, some H2 molecules were present in the adsorption system to cause charge transfer, and a part of these hydrogen molecules was adsorbed due to the repulsion between hydrogen molecules and the attraction between hydrogen molecules and the DVG-4 substrate. The charge transfer between hydrogen molecules and DVG-4 generated an ionic effect, and polarized hydrogen molecules enhanced the ionic interaction between these two, resulting in the stable adsorption of hydrogen molecules on the DVG-4 substrate.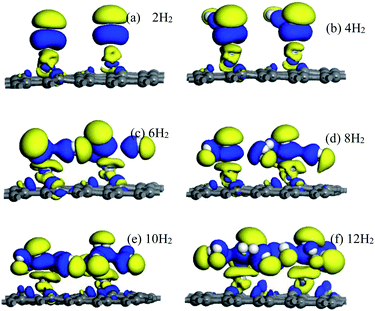 | ||
| Fig. 8 (a–f) Electron density difference of DVG-4–Ti adsorption different amount of hydrogen molecules. | ||
Conclusions
First-principles calculations were used to study the structure of vacancy graphene and the hydrogen storage properties of vacancy graphene modified with metal Ti atoms. It was found that after a defect was introduced, the bandgap of graphene became open, and the structure was distorted where the defect was formed. In the system, charge transfer occurred between hydrogen molecules, metal Ti atoms, and the DVG-4 substrate, hence, an ionic interaction between H2 molecules and the substrate was detected. According to the number of defects and their relative positions, the size of the energy band changed. After the introduction of double defects, the DVG-4 structure had the best hydrogen storage performance. After the incorporation of Ti atoms, the distortion at DVG-4–Ti structure defect sites was reduced. The study on the hydrogen storage performances of SVG–Ti, DVG-4, and DVG-4–Ti revealed that up to five hydrogen molecules were adsorbed stably on the SVG–Ti structure. After the introduction of the sixth hydrogen molecule, the adsorption energy was less than 0.2 eV. For a single vacancy of the DVG-4 structure, at least nine hydrogen molecules were adsorbed, however, the adsorption energies of the first four hydrogen molecules were too large. When DVG-4 adsorbed the second, third, and fourth hydrogen molecules, their adsorption energies were too high to dehydrogenate the structure. Induced metal Ti atoms solved the problem of excessive hydrogen molecules adsorption on the DVG-4 structure. However, the number of adsorbed hydrogen molecules was reduced. A single vacancy of the DVG-4–Ti structure could adsorb six hydrogen molecules. The hydrogen storage mass percentage of H2 molecules on DVG-4 was calculated as 5.92 wt%, and the hydrogen storage mass percentage of H2 molecules on DVG-4–Ti was calculated as 4.0 wt%. Therefore, vacancies graphene structure has great potential to become an excellent hydrogen storage material.Conflicts of interest
There are no conflicts to declare.Acknowledgements
This research was funded by the National Natural Science Foundation of China (No. 61701288, No. 51706128), Basic Research Plan of Natural Science in Shaanxi Province (No. 2018JM6084), Key Scientific Research Project of Shaanxi Provincial education department (No. 20JS019) and Postgraduate Innovation Project of Shaanxi University of Technology (No. SLGYCX2026).References
- A. Chapman, K. Itaoka and K. Hirose, et al., Int. J. Hydrogen Energy, 2019, 44(13), 6371–6382 CrossRef CAS.
- M. D. Ganji, S. N. Emami and A. Khosravi, et al., Appl. Surf. Sci., 2015, 332, 105–111 CrossRef CAS.
- E. Rangel, J. M. Ramírez-arellano and I. Carrillo, et al., Int. J. Hydrogen Energy, 2011, 36(21), 13657–13662 CrossRef CAS.
- A. Sigal, M. I. Rojas and E. P. M. Leiva, Int. J. Hydrogen Energy, 2011, 36(5), 3537–3546 CrossRef CAS.
- H.-L. Park, S.-C. Yi and Y.-C. Chung, Int. J. Hydrogen Energy, 2010, 35(8), 3583–3587 CrossRef CAS.
- H. G. Shiraz and O. Tavakoli, Renewable Sustainable Energy Rev., 2017, 74, 104–109 CrossRef CAS.
- Y. Wang, Z. Meng and Y. Liu, et al., Appl. Phys. Lett., 2015, 106(6), 063901 CrossRef.
- Z. Luo, X. Fan and R. Pan, et al., Int. J. Hydrogen Energy, 2017, 42(5), 3106–3113 CrossRef CAS.
- S. Patchkovskii, J. S. Tse and S. N. Yurchenko, et al., Proc. Natl. Acad. Sci. U. S. A., 2005, 102(30), 10439 CrossRef CAS PubMed.
- R. Ströbel, J. Garche and P. T. Moseley, et al., J. Power Sources, 2006, 159(2), 781–801 CrossRef.
- H. Lee, J. Ihm and M. L. Cohen, et al., Nano Lett., 2010, 10(3), 793–798 CrossRef CAS PubMed.
- E. Eroglu, S. Aydin and M. Şimşek, Int. J. Hydrogen Energy, 2019, 44(50), 27511–27528 CrossRef CAS.
- G. J. Kubas, J. Organomet. Chem., 2001, 635(1), 37–68 CrossRef CAS.
- C. I. Contescu, K. Van benthem and S. Li, et al., Carbon, 2011, 49(12), 4050–4058 CrossRef CAS.
- C. M. Ramos-castillo, J. U. Reveles and M. E. Cifuentes-quintal, et al., J. Phys. Chem. C, 2016, 120(9), 5001–5009 CrossRef CAS.
- H.-W. Huang, H.-J. Hsieh and I. H. Lin, et al., J. Phys. Chem. C, 2015, 119(14), 7662–7669 CrossRef CAS.
- Y. Zhang, H. Cui and W. Tian, et al., AIP Adv., 2020, 10(4), 045012 CrossRef CAS.
- W. Liu, Y. Liu and R. Wang, Appl. Surf. Sci., 2014, 296, 204–208 CrossRef CAS.
- S. Nachimuthu, P.-J. Lai and J.-C. Jiang, Carbon, 2014, 73, 132–140 CrossRef CAS.
- Z. Ao, S. Dou and Z. Xu, et al., Int. J. Hydrogen Energy, 2014, 39(28), 16244–16251 CrossRef CAS.
- A. Bhattacharya, S. Bhattacharya and C. Majumder, et al., J. Phys. Chem. C, 2010, 114(22), 10297–10301 CrossRef CAS.
- D. Kim, S. Lee and Y. Hwang, et al., Int. J. Hydrogen Energy, 2014, 39(25), 13189–13194 CrossRef CAS.
- S. Seenithurai, R. K. Pandyan and S. V. Kumar, et al., Int. J. Hydrogen Energy, 2014, 39(21), 11016–11026 CrossRef CAS.
- J.-H. Liao, Y.-J. Zhao and X.-B. Yang, Int. J. Hydrogen Energy, 2015, 40(36), 12063–12071 CrossRef CAS.
- Y. Zhou, W. Chu and F. Jing, et al., Appl. Surf. Sci., 2017, 410, 166–176 CrossRef CAS.
- C. P. Ewels, X. Rocquefelte and H. W. Kroto, et al., Proc. Natl. Acad. Sci. U. S. A., 2015, 112(51), 15609 CrossRef CAS PubMed.
- O. Cretu, A. V. Krasheninnikov and J. A. Rodríguez-manzo, et al., Phys. Rev. Lett., 2010, 105(19), 196102 CrossRef PubMed.
- K. M. Fair, X. Y. Cui and L. Li, et al., Phys. Rev. B: Condens. Matter Mater. Phys., 2013, 87(1), 014102 CrossRef.
- L. Yuana, K. Long and Y. Chena, et al., Appl. Surf. Sci., 2018, 434, 843–849 CrossRef.
- J. P. Perdew, K. Burke and M. Ernzerhof, Phys. Rev. Lett., 1996, 77(18), 3865–3868 CrossRef CAS PubMed.
- P. Giannozzi, S. Baroni and N. BoninI, et al., J. Phys.: Condens. Matter, 2009, 21(39), 395502 CrossRef PubMed.
- M. J. López, I. Cabria and J. A. Alonso, J. Phys. Chem. C, 2014, 118(10), 5081–5090 CrossRef.
- Z. Amaniseyed and Z. Tavangar, Int. J. Hydrogen Energy, 2019, 44(7), 3803–3811 CrossRef CAS.
- W. Tian, Y. Zhang and Y. Wang, et al., Int. J. Hydrogen Energy, 2020, 45(22), 12376–12383 CrossRef CAS.
- X. Chen, L. Wang and W. Zhang, et al., Int. J. Hydrogen Energy, 2017, 42(31), 20036–20045 CrossRef CAS.
- R. E. Ambrusi, V. Orazi and J. M. Marchetti, et al., J. Phys. Chem. Solids, 2020, 138, 109258 CrossRef CAS.
- J. J. Palacios and F. Ynduráin, Phys. Rev. B: Condens. Matter Mater. Phys., 2012, 85(24), 245443 CrossRef.
- C. X. Li, Y. H. Duan and W. C. Hu, J. Alloys Compd., 2015, 619, 66–77 CrossRef CAS.
- I. López-corral, E. Germán and A. Juan, et al., J. Phys. Chem. C, 2011, 115(10), 4315–4323 CrossRef.
- J. Petucci, C. Leblond and M. KarimI, et al., J. Chem. Phys., 2013, 139(4), 044706 CrossRef PubMed.
- Y.-H. Kim, Y. Zhao and A. Williamson, et al., Phys. Rev. Lett., 2006, 96(1), 016102 CrossRef PubMed.
- C. Ataca, E. Aktürk and S. Ciraci, Phys. Rev. B: Condens. Matter Mater. Phys., 2009, 79(4), 041406 CrossRef.
- G. Kim, S.-H. Jhi and S. Lim, et al., Phys. Rev. B: Condens. Matter Mater. Phys., 2009, 79(15), 155437 CrossRef.
- T. Hussain, B. Mortazavi and H. Bae, et al., Carbon, 2019, 147, 199–205 CrossRef CAS.
| This journal is © The Royal Society of Chemistry 2021 |

