 Open Access Article
Kinetic and deuterium isotope analyses of ammonia electrochemical synthesis†
Chien-I. Li a,
Hiroki Matsuo
 b and
Junichiro Otomo
 *b
*b
aDepartment of Environment Systems, Graduate School of Frontier Sciences, The University of Tokyo, 5-1-5 Kashiwanoha, Kashiwa-shi, Chiba 277-8563, Japan
bDepartment of Transdisciplinary Science and Engineering, School of Environment and Society, Tokyo Institute of Technology, 2-12-1 Ookayama, Meguro-ku, Tokyo 152-8550, Japan. E-mail: otomo.j.aa@m.titech.ac.jp
First published on 19th May 2021
Abstract
The mechanism of electrochemical promotion of ammonia formation was investigated by kinetic and deuterium isotope analyses using a cell with a Pt (anode)|BaCe0.9Y0.1O3 (BCY)|Fe (cathode) configuration on the introduction of a gaseous mixture of H2(D2)–N2 to the cathode at 550 °C. To clarify the mechanism of electrochemical ammonia synthesis, the reaction orders for hydrogen, α, and nitrogen, β, were investigated. The values of α and β did not change after applying a negative voltage, which indicates that the reaction mechanism at rest potential is the same as that with cathodic polarization. Furthermore, deuterium isotope analysis was conducted to investigate the mechanism of electrochemical promotion. The isotopic composition of ammonia (i.e., NH3−xDx) formed in the cathode was determined using Fourier-transform infrared spectroscopy (FTIR). The results show that the ammonia products with cathodic polarization correspond to the species of H2 (or D2) in the cathode, that is, NH3 (or ND3) was mainly formed when H2 (or D2) was introduced to the cathode. Isotopic analysis revealed that the ammonia formation rate via the electrochemical promotion of catalysis (EPOC) is faster than that via the charge-transfer reaction, suggesting that a significant increase in the ammonia formation rate will be caused by the EPOC.
Introduction
Ammonia is an essential chemical, and approximately 140 million tons of ammonia are synthesized each year.1 Most of the produced ammonia is used as a fertilizer in agriculture to produce foodstuffs and feed the world's population.2 In the past century, as the world population has more than tripled, the demand for nitrogen fertilizer and ammonia has also increased significantly.2 In addition, ammonia is a potential hydrogen carrier because of its advantages, such as its high hydrogen density of 17.8%, ease of storage and transport, and emission of only N2 and H2O on combustion; thus, it could form an important part of the hydrogen economy.3–5Currently, ammonia is produced industrially by the Haber–Bosch process, in which N2 and H2 are reacted together at high pressure (150–200 bar) and temperature (400 °C) on an iron-based catalyst to produce NH3.6,7 Normally, the rate-determining step on an Fe catalyst is considered to be N2 dissociation because of the high strength of the N![[triple bond, length as m-dash]](https://www.rsc.org/images/entities/char_e002.gif) N triple bond. It has been reported that the N2 dissociation reaction can be accelerated by the addition of K2O or Al2O3 to the Fe-based catalyst. This increases the ammonia synthesis activity8 because the K additive has a low work function and can promote electron back-donation reaction from Fe into the
N triple bond. It has been reported that the N2 dissociation reaction can be accelerated by the addition of K2O or Al2O3 to the Fe-based catalyst. This increases the ammonia synthesis activity8 because the K additive has a low work function and can promote electron back-donation reaction from Fe into the  orbital.9 On the other hand, Ru catalysts show better activity in ammonia synthesis than Fe catalysts.6,7 Aika et al. compared the ammonia synthesis activity of different alkali metal additives as promoters in Ru or Ni-based catalysts. They concluded that Cs had a stronger promoting effect than K or Na.9 On the other hand, Kitano et al. also observed a high ammonia formation rate (46.41 μg mg−1 h−1) using a Ru-loaded 12CaO–7Al2O3 electride.10,11 They proposed that electron back-donation from the electride to the
  orbital facilitates N2 dissociation and accelerates the ammonia formation rate.
However, the Haber–Bosch process is energy-intensive and releases large amounts of carbon dioxide because methane reforming is used to produce the required hydrogen. Therefore, to reduce carbon emissions and energy consumption during ammonia synthesis, a more environmentally friendly process, such as an electrochemical route, has been developed. This process allows more efficient NH3 formation at moderate pressures and temperatures.
Over the last two decades, the electrosynthesis of ammonia from H2O and N2 has attracted great attention because this process can achieve high energy and current efficiencies.12 In ammonia electrosynthesis using a proton conductor, H2O is decomposed to H+, e−, and O2 in the anode (eqn (1)), and the H+ ions pass through the electrolyte to react with N2 and e− in the cathode (eqn (2)). The overall reaction is presented in eqn (3); as can be seen, it is a carbon-free process. In non-aqueous systems, to improve the N2 reduction activity, H2O is replaced by H2 as the proton source in the anode.
Anode:
 | (1) |
Cathode:
| N2 + 6H+ + 6e− → 2NH3 | (2) |
Overall:
 | (3) |
At low temperatures (<100 °C), the direct dissociation of N2 over the catalyst cannot proceed because of the sluggish reaction kinetics. Using density functional theory (DFT) calculations, Skulason et al. proposed an alternative route for the protonation of N2 via a charge transfer reaction to form NH3.13 The protons supplied from the anode acted as the hydrogen source and reacted with N2 to form NH3 through N2H and N2H2 intermediates.13 Further, several studies have reported electrochemical ammonia formation rates of approximately 10−11 to 10−8 mol cm−2 s−1 and current efficiencies of 0.7–56% under a pure N2 atmosphere at temperatures below 100 °C.14–21
On the other hand, many researchers have achieved the electrochemical reduction of N2 by introducing pure N2 into the cathode at high temperatures (>500 °C) using a variety of catalysts.22–33 Low ammonia formation rates of 10−11 to 10−9 mol s−1 cm−2 have been reported under these conditions.22–25,28–33 Wang et al. proposed that the ammonia formation rate is affected by several factors, including the electrode area, the conductivity of the proton-conducting solid oxide electrolyte, and the N2 flow rate.22,29,30,32 At present, the hypothesis that the enhancement of the ammonia formation rate with cathodic polarization is caused by a faradaic reaction (i.e., charge-transfer reaction), in which N2 reacts with the H+ supplied from the anode to form ammonia, is generally accepted.
Some previous studies have also investigated the electrosynthesis of ammonia by introducing a gaseous mixture of H2–N2 into the cathode.34–37 Normally, the ammonia formation rate in an H2–N2 atmosphere is higher than that in a pure N2 atmosphere.35,37 In our previous study,37 the electrochemical synthesis of ammonia was investigated using a single cell configuration: wet H2–Ar, Pt|BaCe0.9Y0.1O3 (BCY)|Al–Fe–K–BCY, H2–N2. In the experiment, we found that the ammonia formation rate was increased by 20 times to 6 × 10⁻¹⁰ mol s−1 cm−2 with cathodic polarization compared with that at rest potential using 15% H2–85% N2 in the cathode, whereas low ammonia formation rates of 5.5 × 10⁻¹² − 2.4 × 10⁻¹¹ mol cm−2 s−1 were obtained using pure N2 in the cathode. Ouzounidou et al. also reported the similar result that an ammonia formation rate of 2.2 × 10⁻¹⁰ mol s−1 cm−2 in H2–N2 was higher than that (1.3 × 10⁻¹¹ mol s−1 cm−2) in pure N2. Notably, they found that the current efficiency of ammonia electrosynthesis was greater than 100% in the H2–N2 atmosphere. This result suggests that, in addition to the faradaic reaction, the ammonia formation rate was also increased by the surface reaction of N2 and H2 at the cathode with cathodic polarization. That is, a non-faradaic reaction is involved: the so-called electrochemical promotion of catalysis (EPOC), and this can be controlled by controlling the work function to improve reaction rates.35 However, it is still unclear whether the dominant effect of the electrochemical promotion of ammonia formation is caused by either the faradaic reaction or the EPOC.
In our recent study,38 we reported the following results: (1) a cathode structure with short triple phase boundary (TPB) length (i.e., porous pure Fe cathode) had better performance of ammonia formation rate than that with long TPB length (i.e., Fe–BCY cermet cathode), (2) the ammonia formation rate had a strong correlation with the H2 partial pressure in the cathode. The ammonia formation rate increased from 2.2 × 10⁻⁹ mol cm−2 s−1 (71 μg mg−1 h−1) in 10% H2–90% N2 to 1.4 × 10⁻⁸ mol cm−2 s−1 (450 μg mg−1 h−1) in 50% H2–50% N2 using porous pure Fe cathode at 550 °C and −1.2 V, which is equivalent to that in the Haber–Bosch process (250–976 μg mg−1 h−1 at 7–10 MPa and 400 °C).7 Furthermore, based on the results, we proposed that the promotion of electrochemical ammonia formation is governed by EPOC with porous pure Fe. Here, to examine the electrochemical promotion of ammonia formation, the information of the origin of hydrogen atoms in ammonia is very important. If the hydrogen atoms in ammonia originate from H2 in the cathode, ammonia formation will be followed by a surface reaction with EPOC (eqn (4)). If the hydrogen atoms in ammonia originate from H+ from the anode, ammonia formation will proceed via the charge-transfer reaction at the TPB among the gas, Fe catalyst, and BCY proton-conductor (eqn (5)).
| N2 + 3H2 → 2NH3 | (4) |
| N2 + 6H+ + 6e− → 2NH3 | (5) |
In this study, to investigate the mechanism of the electrochemical promotion of ammonia formation, (1) kinetic analysis and (2) isotope deuterium analysis were conducted using a porous pure Fe cathode at high temperature (550 °C). The dependence of the ammonia formation rate on the cathodic polarization was examined. In addition, the reaction mechanism of electrochemical promotion of ammonia formation was investigated in terms of the reaction orders of hydrogen and nitrogen at rest potential and applied voltage. Furthermore, to investigate the origin of the hydrogen (deuterium) atoms in the formed ammonia, deuterium isotope analysis was also performed using Fourier transform infrared (FTIR) spectroscopy measurements at high temperature (550 °C). Via the analysis of the hydrogen/deuterium composition of the ammonia (NH3−xDx) formed in the cathode, we discuss which mechanism, that is, the faradaic reaction or EPOC, is dominant for ammonia formation. In our experiments, gaseous mixtures of dry N2–D2–Ar and wet H2–Ar were introduced into the cathode and anode, respectively. If the ammonia were formed by the surface reaction of N2 with D2 via the EPOC in the cathode, the main product should be ND3. In contrast, if the ammonia were formed by the charge-transfer reaction of N2 with H+ from the anode, the product should be NH3, as shown in Fig. 1. To the best of our knowledge, this manuscript is the first study which demonstrates the deuterium isotope analysis for the electrochemical ammonia formation in a solid oxide electrolyzer cell. Furthermore, because of the serious problem of contamination for ammonia electrochemical synthesis, the relevant protocol was suggested with a series of check items.39 In this study, we also checked the experimental procedure very carefully to avoid the influence of contamination on kinetic and deuterium isotope analyses. Therefore, using our experimental method, we can reveal whether ammonia formation occurs on the surface or at the TPB, and this information will contribute to the design of cathode structures for effective electrochemical reactors.
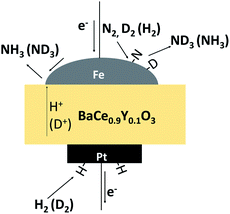 | ||
| Fig. 1 A schematic image of ammonia formation and deuterium isotope analysis through the observation of ammonia composition, NH3−xDx. | ||
Results and discussion
Characterizations
Fig. 2 shows the XRD patterns of the porous pure Fe cathodes on the BCY electrolyte. Strong peaks corresponding to the thick BCY electrolyte and peaks corresponding to Fe at 44.46° and 65.02° (cubic, Im![[3 with combining macron]](https://www.rsc.org/images/entities/char_0033_0304.gif) m, PDF #00-006-0696), respectively, were observed. Fig. 3 shows cross-sectional SEM images of the pure porous Fe cathode. The thickness of the cathode was approximately 30 μm, and the size of the Fe particles ranged from 50 to 500 nm.
m, PDF #00-006-0696), respectively, were observed. Fig. 3 shows cross-sectional SEM images of the pure porous Fe cathode. The thickness of the cathode was approximately 30 μm, and the size of the Fe particles ranged from 50 to 500 nm.
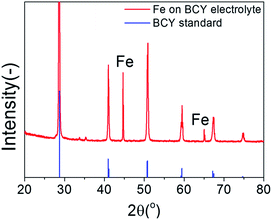 | ||
| Fig. 2 XRD spectra of porous pure Fe cathode on the BCY electrolyte. Reflections from the BCY standard card (PDF #01-070-1429) are shown in blue. | ||
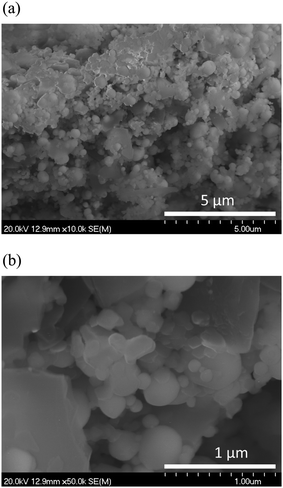 | ||
| Fig. 3 (a) Cross-sectional SEM images of the as-prepared samples of porous pure Fe cathode. (b) is the enlarged image of the as-prepared samples of porous pure Fe cathode without polishing. | ||
Electrochemical promotion of ammonia formation at different H2 partial pressures
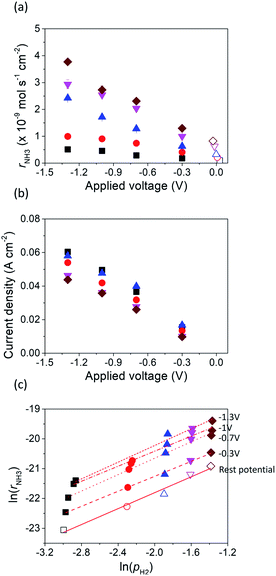
Fig. 4 shows the ammonia formation rate at different applied voltages using a cell with 20% H2–3% H2O–77% Ar (30 sccm), Pt|BCY|Fe, 50% N2–H2–Ar (40 sccm). Electrode potentials corresponding to the applied voltages at different atmospheres were listed in the ESI (Table S1†). The ammonia formation rate was evaluated by increasing the H2 partial pressure (pH2) from 0.05 to 0.25 atm at rest potential. Furthermore, at an applied voltage of −1.3 V, the ammonia formation rates increased by approximately 3.5–6.5 times compared with those at the rest potential at different H2 partial pressures. Fig. 4b reveals a slight decrease in the current densities with increasing H2 partial pressure, which is probably caused by the low overpotential at high H2 partial pressure because the rest potential is more negative at high H2 partial pressures than that at low H2 partial pressures in the cathode.Fig. 4c shows the ln(pH2) dependence of ln(rNH3). The hydrogen partial pressure used for the horizontal axis in Fig. 4c is defined as the sum of the hydrogen partial pressure in the feed gas and that as a result of the H2 evolution reaction. We assume that the current efficiency of the H2 evolution reaction is 100% (eqn (6)), which suggests that the H2 partial pressure in the cathode increases with cathodic polarization (ΔpH2 in eqn (7)).
| 2H+ + 2e− → H2(g) | (6) |
 | (7) |
 | (8) |
| Applied voltage (V) | α | β |
|---|---|---|
| Rest potential | 1.33 ± 0.11 | 0.30 ± 0.15 |
| −0.3 | 1.26 ± 0.04 | 0.59 ± 0.09 |
| −0.7 | 1.38 ± 0.06 | 0.37 ± 0.25 |
| −1 | 1.26 ± 0.09 | 0.43 ± 0.21 |
| −1.3 | 1.40 ± 0.13 | 0.56 ± 0.2 |
The reaction order of nitrogen was also investigated at a fixed H2 partial pressure of 0.1 atm and N2 partial pressures of 0.3–0.6 atm (see Fig. S1†). The influence of increasing the N2 partial pressure on the ammonia formation rate was very weak because of the low value of β, which was 0.3 at rest potential, smaller than that of 0.96 and 0.52 in previous studies.37,40 The values of β at different applied voltages are summarized in Table 1. Notably, at the rest potential, neither α nor β change after the application of different voltages, which suggests that the reaction mechanism with cathodic polarization is probably the same as that at the rest potential, that is, a surface reaction. To investigate the details of the reaction mechanism of electrochemical ammonia synthesis, deuterium isotope analysis using FTIR measurements was conducted to examine the origin of the hydrogen atoms in the ammonia product, as discussed in the next section.
FTIR spectra of NH3−xDx
In this study, the ν2 band (umbrella mode) of NH3−xDx was investigated. The IR spectra of NH3 shows two Q branches arising from the splitting of the degenerate energy level41 (see Section 4 and Fig. S2 in the ESI†). According to the selection rule, the vibrational–rotational transition only occurs from the symmetric state to the asymmetric state or vice versa. In addition, the vibrational quantum number, ν, the quantum number for the total angular momentum, J, and the quantum number for the projection of J onto the principal axis of the molecule, K, must satisfy Δν = 1, ΔJ = ±1, 0, and ΔK = 0. ΔJ = 0, 1, and −1 are represented by Q, P, and R branches, respectively, as shown in Fig. S3.† Therefore because of the special molecular shape, motion (that is, umbrella inversion), and the selection rule, NH3 shows two Q branches at approximately 965 and 930 cm−1. On the other hand, by replacing H atoms with D atoms, the energy difference between the Q branches decreases because of the heavy D atoms. The details of the wavenumbers of the Q, P, and R branches for NH3−xDx are summarized in Section 5 in the ESI, Tables S3–S8.† In Fig. 5 and 6, only Q branches, which represent the transition from the symmetric to the asymmetric state (0s→1a), and Q′ branches, which represent the transition from the asymmetric to the symmetric states (1s→0a) of NH3−xDx are marked because of their high absorbance. The absorption coefficients of NH3−xDx were discussed in Section 6 in the ESI.†Origin of the hydrogen (deuterium) atoms in ammonia products
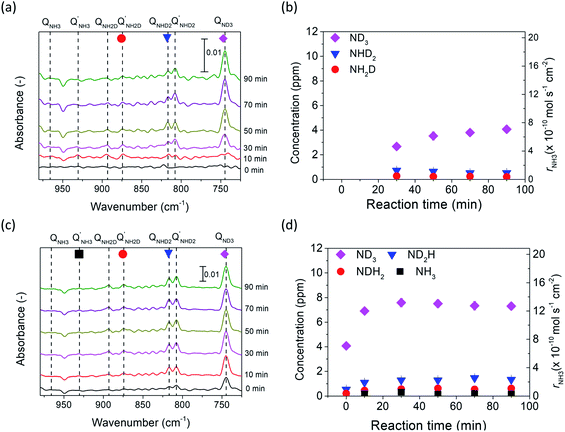
To investigate the mechanism of electrochemical ammonia formation, deuterium isotope analysis was conducted to determine the origin of hydrogen (deuterium) atoms in the ammonia products. The compositions of the ammonia products were determined using FTIR analysis. The flow rate over the cathode was increased to 100 sccm in the FTIR analysis because of the large volume of the optical cell. The deuterium isotope analysis can be divided into three stages. In the first stage, valve 1 (Fig. S6†) was switched to flow the gaseous mixture into the FTIR cell, and valves 2 and 3 were opened. The cell operation conditions were maintained at 10% H2–3% H2O–87% Ar, Pt|BCY|Fe, 5% D2–45% Ar–50% N2 at 550 °C. Fig. 5a shows the FTIR spectra at rest potential, in which the peaks of ND3, NHD2, and NH2D can be seen. Fig. 5b also shows the concentrations of ND3, NHD2, and NH2D (the absorption coefficients of NH3D3−x are discussed in Section 6 in the ESI†). The ammonia product should be ND3 at the rest potential because H+ cannot be supplied from the anode at the rest potential, whereas ND3, NHD2, and NH2D were observed at the rest potential. The products NHD2 and NH2D were probably formed via exchange reactions with ND3 and H2O in the outlet, that is, in the quartz tube, gas tube, and optical cell (eqn (9) and (10)) or via the surface reaction with nitrogen atoms and some hydrogen atoms that had diffused from the anode to the cathode because of the H2 concentration gradient (see Section 8 in the ESI†). H2O may generate via H2O release from hydroxide defects in BCY electrolyte. At the rest potential, the main composition of the ammonia was ND3 via the surface reaction without cathodic polarization.| ND3 + H2O → ND2H + HDO | (9) |
| ND2H + H2O → NDH2 + HDO | (10) |
In the second stage, a voltage of −1 V was applied to the cell to investigate the composition of the ammonia in the electrochemical reaction. All valves were set the same as those in the first stage. The intensities of the ND3, NHD2, and NH2D peaks increased at −1 V, and a weak NH3 peak was observed, as shown in Fig. 5c. The concentrations of NH3−xDx are shown in Fig. 5d. In the second stage, the ammonia products were determined by the surface reaction, electrochemical reaction, and exchange reaction. The mechanism of the electrochemical ammonia formation reaction is discussed later.
In the third stage, valves 1, 2, and 3 were closed to examine the influence of the optical cell on the concentration of ammonia product (i.e., the adsorption or decomposition of ammonia). The intensities of the ND3 peaks monotonously decreased with elapsed time, whereas the intensities of the NH3, NH2D, and NHD2 peaks did not change with elapsed time, as shown in Fig. S7.† Thus, the decrease in the ND3 concentration was caused by the decomposition rather than the exchange reaction of ND3 and H2O to form NH3−xDx in the optical cell. The decomposition rate was about 0.4% per min based on the result in the stage 3, and the space time in the optical cell was 5 min in the stage 2, considering the current condition (the total gas flow rate in the cathode:100 sccm; the volume of the optical cell: 500 cm3). Therefore, the decomposition rate in the space time was around 2% in the stage 2, which can be negligible in our experiments.
Mechanism of electrochemical ammonia synthesis reaction
In the cell with 10% H2–3% H2O–87% Ar, Pt|BCY|Fe, 5% D2–45% Ar–50% N2, the main product was ND3 at rest potential. After applying a voltage of −1 V, the ammonia formation rate increased, probably via the charge-transfer reaction or the surface reaction with EPOC. If the ammonia were formed by the charge-transfer reaction (faradaic reaction), in which N2 reacts with H+ from the anode, the product would be NH3. The ammonia formation reactions were summarized in Table 2. The charge-transfer reactions are given by eqn (11a)–(13). On the other hand, if the ammonia were formed via the surface reaction with EPOC, in which N2 reacts with D2 at the cathode, the product would be ND3 (eqn (11b) and (14)–(17)). If electrochemical ammonia formation is followed by the charge-transfer reaction, the main product should be NH3 at −1 V. However, this assumption is not consistent with the fact that the main product was ND3 at −1 V (Fig. 5d). After applying a voltage of −1 V, the concentration of ND3 increased by approximately 3.5 ppm (4 → 7.5 ppm), whereas the concentrations of NHD2, NH2D, and NH3 increased by approximately 0.8, 0.4, and 0.16 ppm, respectively. Therefore, in the second stage (i.e., at −1 V), ND3 is the main product in the electrochemical ammonia synthesis reaction, which indicates that electrochemical ammonia formation is mainly followed by the surface reaction with EPOC. In conclusion, in the electrochemical ammonia synthesis reaction, ammonia is formed via the surface reaction in the cathode rather than the charge-transfer reaction with cathodic polarization.For the products of NHD2, NH2D, and NH3, the H atoms in these three products were probably formed via three pathways: (1) the surface reaction with adsorbed N and H atoms, (2) the exchange reaction with H2O, and (3) the charge-transfer reaction. If we assume that all H atoms are formed from the charge-transfer reaction, the current efficiency, η, can be obtained using eqn (18).
 | (18) |
Deuterium isotope analysis on introducing H2 into the cathode and D2 into the anode
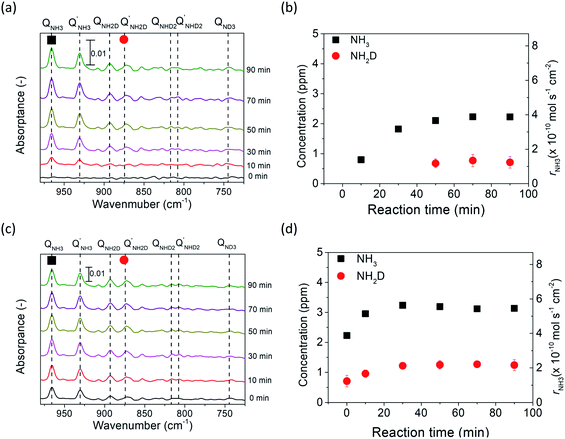
The deuterium isotope analysis was also conducted using 5% H2–95% N2 in the cathode and wet 10% D2–90% Ar in the anode, and the results are shown in Fig. 6. The area of the NH2D Q branch was determined by deconvoluting the overlapped spectra between the NH2D Q′ branch and the NH3 P branch. Fig. S8† shows an example of the deconvoluted spectrum. In the first stage (i.e., valves 1, 2, and 3 open), strong NH3 peaks and small NH2D peaks were observed at rest potential, and the concentrations of NH3 and NH2D were calculated, as shown in Fig. 6a and b. NH3 was the main product formed by the surface reaction without cathodic polarization. The D atoms in NH2D originated from the diffusion of D+ from the anode (see Section 8 in the ESI†).Then, in the second stage (valves 1, 2, and 3 open), the concentrations of NH3 and NH2D increased at an applied voltage of −1 V, as shown in Fig. 6c and d. Again, if electrochemical ammonia formation is followed by the charge-transfer reaction, the product will be ND3. If the electrochemical ammonia formation is followed by the surface reaction, the product will be NH3. The concentrations of NH3 and NH2D increased by approximately 0.9 and 0.5 ppm, respectively, which indicates that the main product was NH3 formed via the surface reaction at −1 V. This result agrees with the former result of ND3 formation at −1 V via the surface reaction. In the third stage (valves 2 and 3 closed), the intensities of NH3 and NH2D peaks did not change with time, as shown in Fig. S9.†
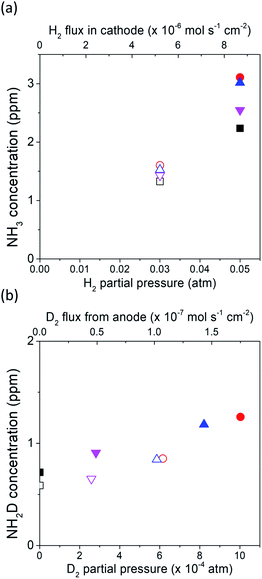
The dependence of the charge-transfer reaction on the applied voltage was also investigated using a cell of wet 10% D2–90% Ar, Pt|BCY|Fe, H2–N2 at −0.3, −0.7, and −1 V, as shown in Fig. 7. This figure shows that the concentrations of NH3 and NH2D correspond to the H2 and D+ flow rates in the cathode, respectively. The H2 flow rate used in Fig. 7a is defined as the H2 partial pressure in the cathode. Hydrogen partial pressures of 3% and 5% correspond to H2 flow rates of 5.1 × 10⁻⁶ and 8.7 × 10⁻⁶ mol cm−2 s−1, respectively. When a voltage was applied, because only D+ was pumped into the cathode, the H2 partial pressure did not change with increasing current density. As shown in Fig. 7b, the D2 partial pressure is defined as the sum of the D2 partial pressure caused by the D2 evolution reaction and D2 diffusion from the anode. Therefore, the D2 partial pressure increased with increasing current density.
As shown in Fig. 7a, 2.2 ppm NH3 was detected in 5% H2 at rest potential. When a voltage was applied, the concentration of NH3 increased to 2.5–3.1 ppm at different applied voltages, although the H2 partial pressure remained the same at 5%. When the H2 partial pressure in the cathode decreased to 3%, NH3 concentration also decreased to 1.3 ppm at the rest potential and increased to 1.4–1.6 ppm at different applied voltages. Because the H2 partial pressure does not change, this result suggests that the increase in NH3 concentration is caused by the EPOC, and that the effect of the EPOC on the ammonia formation rate depends on the applied voltage and the H2 partial pressure in the cathode.
As shown in Fig. 7b, some D2 diffused from the anode to the cathode at the rest potential. Based on the calculation of D2 diffusion through the electrolyte, the D2 partial pressure was 7.6 × 10⁻⁷ atm at the rest potential (see Section 8 in the ESI†). NH2D was formed via the surface reaction with H2, D2, and N2 at the rest potential. When a voltage was applied (−0.3 to −1.0 V), the D2 partial pressure increased with increasing current density because of the increase in the pumping of D+ cations (i.e. increase in current density), and the NH2D concentration increased with increasing applied voltage as well. However, the D+ flux at the applied voltage was hundreds of times larger than that at the rest potential, whereas the NH2D concentration only increased by approximately 29%–68%, which suggests that an increase in the D+ flux (i.e., current density) cannot promote the charge-transfer reaction.
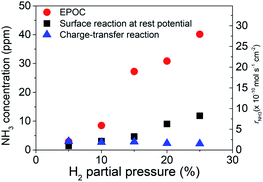
In general, increasing the ammonia concentration in the electrochemical reaction involves three reactions: (1) the EPOC effect, (2) promotion of the surface reaction because of increase in D+ diffused from the anode to the Fe surface (i.e., thermal reaction of D atoms with N*), and (3) charge-transfer reaction of N* + D+ + e− → ND*. To understand the contribution of the charge-transfer reaction, we made two assumptions: (1) the exchange reaction (e.g., NH3 + D2 → NH2D + HD) is negligible in this system and (2) all D atoms in NH2D originate from the charge-transfer reaction. Therefore, the current efficiency, which can be obtained by eqn (19) with n = 1 for NH2D, was approximately 0.01% to 0.06%, suggesting low ammonia formation from the charge-transfer reaction. Based on deuterium isotope analysis, the main product of ammonia originates from H2 (or D2) in the cathode. The low current efficiency suggests a low contribution of the charge-transfer reaction. Under practical conditions, H2–Ar and H2–N2 are introduced into the cathode and anode, respectively. If we assume that the current efficiency is approximately 0.1% and that the current efficiency does not change with H2 partial pressure in the cathode, the ammonia formation rate at −1.3 V in Fig. 4a can be divided into the ammonia formation rate from (a) the EPOC: rNH3,EPOC, (b) charge-transfer reaction: rNH3,CT, (obtained by eqn (19)), and (c) surface reaction at rest potential: rNH3,0, as shown in Fig. 8. The values of total ammonia formation rate, rNH3,total, and rNH3,0, were obtained in Fig. 8. Therefore, rNH3,EPOC can be obtained by eqn (19):
| rNH3,EPOC = rNH3,total − rNH3,0 − rNH3,CT | (19) |
Notably, the ammonia concentration from the charge-transfer reaction was around 2.5 ppm at different H2 partial pressures, whereas the ammonia concentration originating from the EPOC increased from 3.0 ppm in 5% H2–50% N2–45% Ar to 40.2 ppm in 25% H2–50% N2–25% Ar at −1.3 V. This result indicates that the EPOC contribution can be significantly improved by increasing the H2 partial pressure in the cathode.
The results are summarized as follows: (1) the ammonia formation rate has a positive correlation with H2 partial pressure in the cathode, which agrees with the previous study.38 (2) α and β do not change after applying different voltages, which indicates that the reaction mechanism is probably the same as that at the rest potential (surface reaction). (3) The contribution of surface reaction with EPOC to ammonia formation rate is larger than that of charge-transfer reaction with porous pure Fe, and the ammonia formation rate promoted by EPOC can be improved by increasing H2 partial pressure in the cathode. The results reveal an alternative route, i.e., surface reaction with EPOC, for electrochemical ammonia formation. Based on our previous study,38 we believe that the effect of the EPOC is probably induced by the formation of an effective double layer via the spillover of proton originating from charge carriers in the electrolyte to promote the reaction of ammonia formation. Our findings will aid in the design of new catalyst structures for the electrochemical synthesis of ammonia.
Conclusions
In this study, the mechanism of electrochemical ammonia formation with a porous pure Fe cathode catalyst at 550 °C was investigated by kinetic and deuterium isotope analyses. The ammonia formation rate increased with increasing the applied negative voltage and with increasing the H2 partial pressure in the cathode. The reaction orders for hydrogen, α, and nitrogen, β, did not change at different applied negative voltages, which indicates that the mechanism of ammonia formation at rest potential was the same as that at an applied negative voltage. Further, the origin of electrochemical ammonia formation, EPOC or faradaic reaction, was investigated by deuterium isotope analysis. The main ammonia product (NH3 or ND3) corresponded to the hydrogen/deuterium species in the cathode, suggesting that the surface reaction with EPOC is dominant in the electrochemical ammonia formation reaction. In addition, the effect of the EPOC on ammonia formation depends on the applied voltage and hydrogen partial pressure. However, the contribution of the charge-transfer reaction to ammonia formation was relatively small. The results of this study will contribute to the design of cathode structures for electrochemical ammonia formation.Experimental
Powder fabrication
The coprecipitation method was used to prepare BaCe0.9Y0.1O3 (BCY) powder from the precursors Ba(NO3)2 (purity: 99.99%, Kanto Chemical Co., Inc., Japan), Ce(NO3)3·6H2O (purity: 99.99%, Kanto Chemical Co., Inc., Japan), and Y(NO3)3·6H2O (purity: 99.99%, Kanto Chemical Co., Inc., Japan). These precursors were stoichiometrically dissolved in 300 mL ultrapure water (Autopure WT 100, Yamato, Scientific Co., Ltd, Japan), and (NH4)2(COO)2 (purity: 99.5%, Kanto Chemical Co. Inc., Japan), whose concentration was 1.5 times higher than the total cation concentration, was dissolved in 600 mL ultrapure water. The precursor solution was slowly added to the (NH4)2(COO)2 solution to form a white precipitate. The mixture was then filtered using suction filtration and dried at 80 °C for one day. The dried powder was precalcined at 800 °C and then calcined at 1200 °C in air to yield the BCY powder.Cell fabrication
BCY pellets were prepared by uniaxial pressing and subsequent cold isostatic pressing. BCY powder (1.5 g) was first uniaxially pressed at a pressure of 1 t cm−2 and then, isostatically pressed at 180 MPa. The BCY pellet was then calcined at 1600 °C for 5 h in air with sacrificial BCY powder to prevent intermixing with the crucible and the vaporization of barium.A porous Fe electrode was prepared on a BCY electrolyte using the doctor-blade method. The Fe2O3 powder was mixed with a gel composed of α-terpineol (solvent) (purity: 98%, Fujifilm Wako Pure Chemical, Co., Inc., Japan), ethyl cellulose (binder) (ethoxy content: 48.0. −49.5%, Kanto Chemical, Co., Inc., Japan), NONION OP-83 RAT sorbitan sesquioleate (dispersant) (NOF, Co., Japan), dibutyl phthalate (plasticizer) (purity: 99.5%, Kanto Chemical, Co., Inc., Japan), and poly(methylmethacrylate) resin (pore formation) (purity: 99.9%, Tokyo Chemical Industry, Co., Ltd., Japan) to form a slurry. The slurry was then pasted onto the BCY electrolyte and calcined at 900 °C in air to obtain the porous pure Fe2O3 electrode on the BCY electrolyte. Then, Pt counter electrode and Pt reference electrode were pasted on the backside of BCY electrolyte by the doctor blade method. The obtained sample was then reduced at 900 °C for 1 h in 3% H2 to obtain a porous pure Fe cathode, as shown in Fig. S10.†
Characterizations
The samples were characterized using scanning electron microscopy (SEM, S4700 Hitachi and JSM-7900F JEOL, Japan) and X-ray diffractometry (XRD, SmartLab, RIGAKU, Japan).Electrochemical synthesis of ammonia
An electrolyte-supported cell was set in between two quartz tubes in a furnace, as shown in Fig. S6.† Pyrex glass rings were used to seal the quartz tubes at 900 °C. After sealing, Fe cathode was reduced in 3% H2–97% Ar at 900 °C. Then, the temperature was lowered to 550 °C. The electrosynthesis of ammonia was carried out at 550 °C using cells containing 20% H2–3% H2O–77% Ar (30 standard cubic centimeters (sccm)), Pt|BCY|Fe, N2–H2–Ar. The reaction conditions are summarized in Table S11.† Potentiostatic and alternating current (AC) impedance measurements were performed from 1 to 106 Hz using an Autolab PGSTAT128N (Metrohm Autolab B.V., Netherlands). The ammonia formation rate was measured by flowing the outlet gas into a 0.01 mM H2SO4 capture solution, which was prepared by using ultrapure water (100 mL) (Autopure WT 100 compatible with Milli-Q, Yamato Scientific Co., Ltd., Japan) and 0.005 M H2SO4 solution (0.1 mL) (Kanto Chemical, Co., Inc., Japan), for 5 min. Then, the capture solution was subsequently analysed using high-performance ion chromatography (HPLC) (EXTREMA, Jasco, Japan). The ammonia formation rate (rNH3) was calculated using eqn (20).
 | (20) |
Author contributions
Chien-I Li: writing-original draft preparation, investigation, formal analysis. Hiroki Matsuo: methodology, data curation, validation. Junichiro Otomo: conceptualization, methodology, writing – reviewing and editing, data curation, supervision.Conflicts of interest
The authors declare no conflict of interest.Acknowledgements
The authors thank CREST, Japan Science and Technology Agency (JPMJCR1441) for financial support; the Materials Design and Characterization Laboratory, Institute for Solid State Physics, The University of Tokyo for use of the SEM and XRD facilities.References
- D. Bernhardt and J. F. Reilly II, U. S. Geological Survey, U.S. Government Publishing Office, Washington DC, 2019, p. 118 Search PubMed.
- J. W. Erisman, M. A. Sutton, J. Galloway, Z. Klimont and W. Winiwarter, Nat. Geosci., 2008, 1, 636–639 CrossRef CAS.
- S. Giddey, S. P. S. Badwal, C. Munnings and M. Dolan, ACS Sustainable Chem. Eng., 2017, 5, 10231–10239 CrossRef CAS.
- W. Wang, J. M. Herreros, A. Tsolakis and A. P. E. York, Int. J. Hydrogen Energy, 2013, 38, 9907–9917 CrossRef CAS.
- F. Hayashi, Y. Toda, Y. Kanie, M. Kitano, Y. Inoue, T. Yokoyama, M. Hara and H. Hosono, Chem. Sci., 2013, 4, 3124 RSC.
- M. Appl, Ammonia principles and industrial practice, Wiley-VCH, Germany, 1999 Search PubMed.
- H. Liu, Ammonia Synthesis Catalysts Innovation and Practice, World Scientific, 2013 Search PubMed.
- A. Ozaki and H. Taylor, Proc. R. Soc. London, Ser. A, 1960, 258(1292), 47–62 CAS.
- K.-I. Aika, H. Hori and A. Ozaki, J. Catal., 1972, 27, 424–431 CrossRef CAS.
- M. Kitano, Y. Inoue, Y. Yamazaki, F. Hayashi, S. Kanbara, S. Matsuishi, T. Yokoyama, S. W. Kim, M. Hara and H. Hosono, Nat. Chem., 2012, 4(11), 934–940 CrossRef CAS PubMed.
- M. Kitano, S. Kanbara, Y. Inoue, N. Kuganathan, P. V. Sushko, T. Yokoyama, M. Hara and H. Hosono, Nat. Commun., 2015, 6, 6731 CrossRef CAS PubMed.
- J. N. Renner, L. F. Greenlee, A. M. Herring and K. E. Ayers, Electrochem. Soc. Interface, 2015, 24(2), 51–57 CrossRef CAS.
- E. Skulason, T. Bligaard, S. Gudmundsdottir, F. Studt, J. Rossmeisl, F. Abild-Pedersen, T. Vegge, H. Jonsson and J. K. Norskov, Phys. Chem. Chem. Phys., 2012, 14, 1235–1245 RSC.
- S. Zhang, G. Duan, L. Qiao, Y. Tang, Y. Chen, Y. Sun, P. Wan and S. Zhang, Industrial & Engineering Chemistry Research, 2019 Search PubMed.
- S. Luo, X. Li, B. Zhang, Z. Luo and M. Luo, ACS Appl. Mater. Interfaces, 2019, 11, 26891–26897 CrossRef CAS PubMed.
- R. Liu and G. Xu, Chin. J. Chem., 2010, 28, 139–142 CrossRef CAS.
- G. Xu, R. Liu and J. Wang, Sci. China, Ser. B: Chem., 2009, 52(8), 1171–1175 CrossRef CAS.
- V. Kordali, G. Kyriacou and C. Lambrou, Chem. Commun., 2000, 1673–1674 RSC.
- R. Lan, J. T. Irvine and S. Tao, Sci. Rep., 2013, 3, 1145 CrossRef PubMed.
- Z. Zhang, Z. Zhong and R. Liu, J. Rare Earths, 2010, 28(4), 556–559 CrossRef CAS.
- M. Wang, S. Liu, T. Qian, J. Liu, J. Zhou, H. Ji, J. Xiong, J. Zhong and C. Yan, Nat. Commun., 2019, 10, 341 CrossRef CAS PubMed.
- Z. Li, R. Liu, Y. Xie, S. Feng and J. Wang, Solid State Ionics, 2005, 176(11–12), 1063–1066 CrossRef CAS.
- A. Skodra and M. Stoukides, Solid State Ionics, 2009, 180(23–25), 1332–1336 CrossRef CAS.
- D. S. Yun, J. H. Joo, J. H. Yu, H. C. Yoon, J.-N. Kim and C.-Y. Yoo, J. Power Sources, 2015, 284, 245–251 CrossRef CAS.
- F. Kosaka, T. Nakamura and J. Otomo, J. Electrochem. Soc., 2017, 164(13), F1323–F1330 CrossRef CAS.
- N. Shimoda, Y. Kobayashi, Y. Kimura, G. Nakagawa and S. Satokawa, J. Ceram. Soc. Jpn., 2017, 125, 252–256 CrossRef CAS.
- J. Otomo, N. Noda and F. Kosaka, ECS Trans., 2015, 68, 2663–2670 CrossRef CAS.
- F. Kosaka, N. Noda, T. Nakamura and J. Otomo, J. Mater. Sci., 2016, 52, 2825–2835 CrossRef.
- Z.-J. Li, R.-Q. Liu, J.-D. Wang, Y.-H. Xie and F. Yue, J. Solid State Electrochem., 2004, 9(4), 201–204 CrossRef.
- Y.-H. Xie, J.-D. Wang, R.-Q. Liu, X.-T. Su, Z.-P. Sun and Z.-J. Li, Solid State Ionics, 2004, 168(1–2), 117–121 CrossRef CAS.
- F. Zhang, Q. Yang, B. Pan, R. Xu, H. Wang and G. Ma, Mater. Lett., 2007, 61(19–20), 4144–4148 CrossRef CAS.
- J.-D. Wang, Y.-H. Xie, Z.-F. Zhang, R.-Q. Liu and Z.-J. Li, Mater. Res. Bull., 2005, 40(8), 1294–1302 CrossRef CAS.
- H. Kim, Y. S. Chung, T. Kim, H. Yoon, J. G. Sung, H. K. Jung, W. B. Kim, L. B. Sammes and J. S. Chung, Solid State Ionics, 2019, 339, 115010 CrossRef CAS.
- E. Vasileiou, V. Kyriakou, I. Garagounis, A. Vourros, A. Manerbino, W. G. Coors and M. Stoukides, Solid State Ionics, 2016, 288, 357–362 CrossRef CAS.
- M. Ouzounidou, A. Skodra, C. Kokkofitis and M. Stoukides, Solid State Ionics, 2007, 178(1–2), 153–159 CrossRef CAS.
- E. Vasileiou, V. Kyriakou, I. Garagounis, A. Vourros and M. Stoukides, Solid State Ionics, 2015, 275, 110–116 CrossRef CAS.
- F. Kosaka, T. Nakamura, A. Oikawa and J. Otomo, ACS Sustainable Chem. Eng., 2017, 5, 10439–10446 CrossRef CAS.
- C.-I. Li, H. Matsuo and J. Otomo, Sustainable Energy Fuels, 2021, 5, 188–198 RSC.
- S. Z. Andersen, V. Colic, S. Yang, J. A. Schwalbe, A. C. Nielander, J. M. McEnaney, K. Enemark-Rasmussen, J. G. Baker, A. R. Singh, B. A. Rohr, M. J. Statt, S. J. Blair, S. Mezzavilla, J. Kibsgaard, P. C. K. Vesborg, M. Cargnello, S. F. Bent, T. F. Jaramillo, I. E. L. Stephens, J. K. Norskov and I. Chorkendorff, Nature, 2019, 570, 504–508 CrossRef CAS PubMed.
- R. Kojima and K.-i. Aika, Appl. Catal., A, 2001, 218, 121–128 CrossRef CAS.
- C. W. David, J. Chem. Educ., 1996, 73(1), 46–50 CrossRef CAS.
Footnote |
| † Electronic supplementary information (ESI) available. See DOI: 10.1039/d1ra00190f |
| This journal is © The Royal Society of Chemistry 2021 |

