
 Open Access Article
 This Open Access Article is licensed under a Creative Commons Attribution-Non Commercial 3.0 Unported Licence
Effects of A-site composition of perovskite (Sr1−xBaxZrO3) oxides on H atom adsorption, migration, and reaction†
Yuta Tanakaa,
Kota Murakamia,
Sae Doia,
Kazuharu Itoa,
Koki Saegusaa,
Yuta Mizutania,
Sasuga Hayashia,
Takuma Higo a,
Hideaki Tsunekia,
Hiromi Nakaib and
Yasushi Sekine*a
a,
Hideaki Tsunekia,
Hiromi Nakaib and
Yasushi Sekine*a
aDepartment of Applied Chemistry, Waseda University, 3-4-1, Okubo, Shinjuku, Tokyo, 169-8555, Japan. E-mail: ysekine@waseda.jp
bDepartment of Chemistry and Biochemistry, Waseda University, 3-4-1, Okubo, Shinjuku, Tokyo 169-8555, Japan
First published on 17th February 2021
Abstract
Hydrogen (H) atomic migration over a metal oxide is an important surface process in various catalytic reactions. Control of the interaction between H atoms and the oxide surfaces is therefore important for better catalytic performance. For this investigation, we evaluated the adsorption energies of the H atoms over perovskite-type oxides (Sr1−xBaxZrO3; 0.00 ≤ x ≤ 0.50) using DFT (Density Functional Theory) calculations, then clarified the effects of cation-substitution in the A-site of perovskite oxides on H atom adsorption, migration, and reaction. Results indicated local distortion at the oxide surface as a key factor governing H atom adsorption. Subtle Ba2+ substitution for Sr2+ sites provoked local distortion at the Sr1−xBaxZrO3 oxide surface, which led to a decrement in the H atom adsorption energy. Furthermore, the effect of Sr2+/Ba2+ ratio on the H atoms' reactivities was examined experimentally using a catalytic reaction, which was promoted by activated surface H atoms. Results show that the surface H atoms activated by the substitution of Sr2+ sites with a small amount of Ba2+ (x = 0.125) contributed to enhancement of ammonia synthesis rate in an electric field, which showed good agreement with predictions made using DFT calculations.
1 Introduction
Migration of hydrogen (H) atoms over a metal oxide surface is a particularly important process in various heterogeneous catalytic reactions including hydrogenation, hydrogenolysis, and ammonia (NH3) synthesis. In general, H atom diffusion from metal particles to an oxide surface is known as “hydrogen spillover,” which is driven by a concentration gradient of H atoms adsorbed onto an oxide surface. The diffusion brings two benefits for active metal supported catalysts: one is the supply of H atoms from an active site, which can dissociate H2 to an inactive site; the other is the removal of excess strongly adsorbed H atoms over the active metal surface. These effects, which are broadly studied, are applied to various catalytic reactions.1–4 In addition, the active migration of H atoms promotes heterogeneous catalytic reactions.5–7 In such cases, the migration of H atoms on metal oxide surfaces (proton, H+) induced by an electric field contributes to cleavage of the rigid bonding in the stable molecules such as N![[triple bond, length as m-dash]](https://www.rsc.org/images/entities/char_e002.gif) N bonding (for NH3 synthesis8–12), and C–H bonding (for steam reforming of CH4,13–15 dehydrogenation of methylcyclohexane16,17). H atoms mobility and reactivity play important roles in the catalytic reactions described above. Consequently, controlling the interaction between H atoms and oxide surfaces is necessary to pave the way to a deductive optimization of catalysts.
N bonding (for NH3 synthesis8–12), and C–H bonding (for steam reforming of CH4,13–15 dehydrogenation of methylcyclohexane16,17). H atoms mobility and reactivity play important roles in the catalytic reactions described above. Consequently, controlling the interaction between H atoms and oxide surfaces is necessary to pave the way to a deductive optimization of catalysts.
Perovskite-type oxides (ABO3) are well known as proton conductors.18–24 They are investigated extensively because their properties can be tailored readily25–29 using a subtle substitution of A-site cation, which alters the H atom adsorption energy.11 Herein, we investigated the influences of the A-site cation composition on the H atom adsorbed onto Sr1−xBaxZrO3 (0.00 ≤ x ≤ 0.50) oxides using density functional theory (DFT) calculations. Moreover, we examined the effects of the H atoms adsorption on catalytic NH3 synthesis performances in the electric field using Ru/Sr1−xBaxZrO3 (0.00 ≤ x ≤ 0.50) catalysts. The obtained results indicated that the H atom adsorption was dominated by local distortion at the oxide surface. Furthermore, results show that the trend of the H atom adsorption energies obtained using the theoretical calculations was in close agreement with that of experimentally obtained results on a model reaction of NH3 synthesis in the electric field.
2 Experimental
2.1. Computational details
We conducted DFT calculations to evaluate the H atom adsorption energies over Sr1−xBaxZrO3 (x = 0.00, 0.25, 0.50, 0.75, 1.00) surfaces. All calculations were conducted using the Vienna ab initio simulation package (VASP 5.4.4).30–33 A plane-wave basis set with energy cutoff of 400 eV was used; the core–valence interactions were described using the projector augmented wave (PAW) method.34 The generalized gradient approximation (GGA) of the Perdew–Burke–Ernzerhof (PBE) was applied to express the exchange correlation.35 The spin was polarized in all calculations. Electronic occupancies were determined with Gaussian smearing of 0.05 eV. We optimized the slab models with 1 × 1 × 1 k-point meshes using the Monkhorst–Pack scheme.36 The convergence threshold of the slab energy was 10−5 eV criteria during geometry optimizations. The van der Waals dispersion forces were described using the DFT-D3 method proposed by Grimme.37We constructed the surfaces of Sr1−xBaxZrO3 (x = 0.00, 0.25, 0.50, 0.75, 1.00) oxides by the following scheme. First, the bulk models of Sr1−xBaxZrO3, which had the reported symmetry previously (x = 0.00, Pnma; x = 0.25, Pnma; x = 0.50, Imma; x = 0.75, I4/mcm; x = 1.00, Pm![[3 with combining macron]](https://www.rsc.org/images/entities/char_0033_0304.gif) m)38 were prepared. The obtained equilibrium lattice constants were fixed in subsequent calculations of the slab models. Next, each slab model of Sr1−xBaxZrO3 was constructed so that the most stable AO (Sr1−xBaxO)-terminated surface was exposed. Here, it is noted that the AO-terminated surface is rather more stable than the BO-terminated one,39 and that the exposed surface was the same as the plane from which a maximum diffraction intensity in the X-ray diffraction (XRD) was observed. The slab models consisted of four A–O and B–O layers with a 20 Å vacuum gap separating the adjacent slabs in the z-direction. The bottom two layers of the slab were fixed during the optimization of the slab geometry. Finally, a H atom was adsorbed onto the 16 exposed surface oxygen sites. The adsorption energies of the H atom (E(H adsorption)) were calculated using eqn (1).
m)38 were prepared. The obtained equilibrium lattice constants were fixed in subsequent calculations of the slab models. Next, each slab model of Sr1−xBaxZrO3 was constructed so that the most stable AO (Sr1−xBaxO)-terminated surface was exposed. Here, it is noted that the AO-terminated surface is rather more stable than the BO-terminated one,39 and that the exposed surface was the same as the plane from which a maximum diffraction intensity in the X-ray diffraction (XRD) was observed. The slab models consisted of four A–O and B–O layers with a 20 Å vacuum gap separating the adjacent slabs in the z-direction. The bottom two layers of the slab were fixed during the optimization of the slab geometry. Finally, a H atom was adsorbed onto the 16 exposed surface oxygen sites. The adsorption energies of the H atom (E(H adsorption)) were calculated using eqn (1).
| E(H adsorption) = E(surf-H) − E(surf) − 0.5E(H2) | (1) |
Furthermore, to discuss the effects of the surface oxygen electronic state and the lattice distortion on the H atom adsorption, we performed Bader charge analyses41–44 and density of state (DOS) calculations.
2.2. Catalyst preparation
For an experimental confirmation, we prepared catalysts by loading 5 wt% ruthenium (Ru) on Sr1−xBaxZrO3 (x = 0.000, 0.0625, 0.125, 0.250, 0.375, 0.500) supports. Each Sr1−xBaxZrO3 powder was prepared with a complex polymerization method using excessive ethylene glycol, citric acid monohydrate (Kanto Chemical Co. Inc.), and stoichiometric metal precursors Sr(NO3)2, Ba(NO3)2, and ZrO(NO3)2·2H2O (Kanto Chemical Co. Inc.). The obtained polyester resins were calcined twice, at 873 K for 5 h to pyrolyze the rigid polyester network, and at 1373 K for 10 h to decompose the residual carbons completely and to obtain pure oxides in an air atmosphere. Next, Ru was loaded using an impregnation method. As a metal precursor, tris(acetylacetonato)ruthenium(III) (Ru(acac)3, Tanaka Holdings Co., Ltd.) was used. After Ru(acac)3 and Sr1−xBaxZrO3 powders were added to acetone solvents, the slurries were stirred for 2 h. Subsequently, the organic solvents were evaporated at 373 K and dried at 393 K. The obtained powders were reduced at 723 K for 2 h in the stream of H2/Ar = 1/1 (total 100 SCCM) to remove ligands of the Ru(acac)3. For catalytic activity tests, after the prepared samples were pressed into pellets, they were crushed and sieved to obtain grains of 355–500 μm diameter.2.3. Activity tests
Catalytic activities were evaluated using a fixed-bed, flow-type reactor made of a quartz tube (6.0 mm i.d., 8.0 mm o.d.), as shown in Fig. S1.† Two stainless steel rods (2 mm o.d.) were inserted into the reactor as electrodes. They were attached to the top and bottom of the catalyst bed. To apply the electric field, a direct current (0.0 or 6.0 mA) was imposed using a power supply device. Catalyst bed temperatures and response voltages were monitored respectively by a thermocouple and a digital phosphor oscilloscope (TDS 2001C; Tektronix Inc.). The response voltages were stable during all tests; no plasma formation was observed. Before the activity tests, each 100 mg Ru/Sr1−xBaxZrO3 catalyst was pre-reduced at 723 K for 2 h under a reaction atmosphere. Activity tests were performed in the stream of N2/H2 = 1/3 (0.1 MPa, total 240 SCCM). Under this condition, we confirmed that NH3 synthesis reaction proceeded in the kinetic region. The produced NH3 was dissolved in distilled water. Then it was analyzed using an ion chromatograph (IC-2001; Tosoh Co. Inc.).2.4. Characterization of the catalysts
The crystalline structures of Sr1−xBaxZrO3 supports, fresh and spent 5 wt% Ru/Sr1−xBaxZrO3 catalysts were characterized using powder XRD (SmartLab 3; Rigaku Corp.). These measurements were conducted with filtered Cu-Kα radiation operating at 40 mA and 40 kV. Data were recorded from 10° to 90° at a scanning speed of 2° min−1. X-ray fluorescence spectra (XRF, ZSX-Primus II; Rigaku Corp.) were analyzed to verify the Ru loading weight accurately. The particle size distributions of loaded Ru were observed using a field emission transmission electron microscope equipped with an energy dispersive X-ray spectrometer (FE-TEM/EDX, JEM-2100F; JEOL Ltd.). The particle sizes of Ru were found using mean values of about 200 particles treated as spherical objects. Using the obtained Ru particle sizes, the catalytic performances were also evaluated as turn-over frequencies (TOF). The TOF values were calculated following the eqn (2). As previously reported,7,11–13 it was elucidated that N2 reacted with activated protons at the three-phase boundary (TPB) between gas phase, Ru metal, and the oxide support in the electric field. Thus, TOF was calculated by dividing the NH3 synthesis rates by the number of Ru atoms at TPB; active sites for this reaction.
 | (2) |
Specific surface areas of Sr1−xBaxZrO3 supports, fresh and spent 5 wt% Ru/Sr1−xBaxZrO3 catalysts were measured using a nitrogen adsorption isotherm at 77 K (Gemini VII; Micromeritics Instrument Corp.). They were ascertained using the Brunauer–Emmett–Teller (BET) method. Before measurements, all samples were pretreated at 473 K for 1 h under He flow to remove adsorbates on the catalyst surfaces. We applied X-ray photoelectron spectroscopy (XPS, Versa Probe II; Ulvac-Phi Inc.) to analyze the amounts of the hydroxy (OH) groups on the Sr1−xBaxZrO3 (x = 0.00, 0.25, 0.50) surfaces. These measurements were conducted using Al Kα X-ray source. The binding energies were calibrated with the C 1s peak at 284.8 eV.24,45–47 Before measurements, the Sr1−xBaxZrO3 samples were reduced under H2 atmosphere (N2/H2 = 1/3, total 240 SCCM) at 723 K for 2 h, which was the same procedure as the activity tests. These samples were transferred to the XPS apparatus without an air exposure using a transfer vessel. The obtained C 1s and O 1s peaks were fitted using the Proctor–Sherwood–Shirley method.48,49
3 Results and discussion
3.1. Optimization of computational models
The constructed bulk and slab models of Sr1−xBaxZrO3 (0.00 ≤ x ≤ 1.00) are presented in Table S1† and are depicted in Fig. S2.† We confirmed that the calculated lattice constants of the optimized bulk models were within 1% error of the measured values obtained by XRD patterns (shown in Fig. S3 and S4†). Regarding the slab models, a discontinuous change between x ≤ 0.50 and x ≥ 0.75 was confirmed. Calculations revealed the most stable exposed surface as the (112)-terminated surface for x = 0.00, 0.25, 0.50, the (200)-terminated surface for x = 0.75, and (101)-terminated surface for x = 1.00. The Ba2+-exposed surface tended to be more energetically favourable than the Sr2+-exposed surface for x > 0.50. Presumably, this change in the most stable exposed surface was attributable to the difference in the ionic radius between Sr2+ and Ba2+. Furthermore, this discontinuous trend was detected in the electronic state of loaded Ru and the basicity of Sr1−xBaxZrO3 supports (see Fig. S5 and S6†). For these reasons, we conducted subsequent investigations using only the samples for 0.00 ≤ x ≤ 0.50.3.2. Effects of perovskite A-site composition on H atom adsorption
The H atom adsorption energies over Sr1−xBaxZrO3 surfaces (x = 0.00, 0.25, 0.50) were evaluated using DFT calculations. Fig. 1 exhibits box plots for the calculated H atom adsorption energies on these surfaces. Consequently, the H atom over the surface for x = 0.25 exhibited the lowest H atom adsorption energy, signifying a high H+-donation ability. Then, we calculated the Bader charges of the surface oxygens and the density of states (DOS) of the slab models to elucidate the effects of Sr2+/Ba2+ composition ratio on the electronic state of the surface oxygens. The calculated adsorption energies and Bader charges are presented in Table S2† and Fig. 2. In Fig. 2, only the uppermost lattice oxygens are depicted as spheres. Red spheres and blue ones respectively show electron-rich and electron-deficient oxygens. Additionally, the figures in the spheres stand for the H atom adsorption energies. Results show that the Sr0.75Ba0.25ZrO3 possessed evidently electron-rich surface oxygens around Ba2+, and that the H atoms were weakly bound over such electron-rich sites. Reportedly, H atoms tend to join electron-deficient surface oxygen sites because the electron of the H atom can transfer easily to oxygen sites (known as Lewis acid sites).47,50–52 Therefore, we concluded that the formation of the electron-rich surface oxygens by the subtle Ba2+ substitution provoked the decrease in the H atom adsorption energy. Furthermore, the obtained DOS shapes (depicted in Fig. 3) show that the position of the valence band (derived from O 2p) and the conduction band (derived from Zr 4d) changed to the higher energy level only for x = 0.25, indicating decreased electrophilicity. This change presumably arose from local lattice distortion at the oxide surface induced by the subtle Ba2+ addition. Reportedly, lattice distortion in a perovskite-type oxide such as the cation displacements (off-centering), the tilting of BO6 octahedra, and the elongation and the shortening of some B–O bonds provoke the change in perovskite electronic band structures, especially in d-orbital bands because of its anisotropy (Jahn–Teller effect53,54). Moreover, it has been reported for some perovskite materials that the position of the conduction band level decreases along with the altered hybridization of the electron orbitals when the lattice symmetry is reduced.55–57 Therefore, we concluded that the H atom adsorption over Sr1−xBaxZrO3 (0.00 ≤ x ≤ 0.50) was governed by local lattice distortion, which can be tuned by the A-site Sr2+/Ba2+ ratio.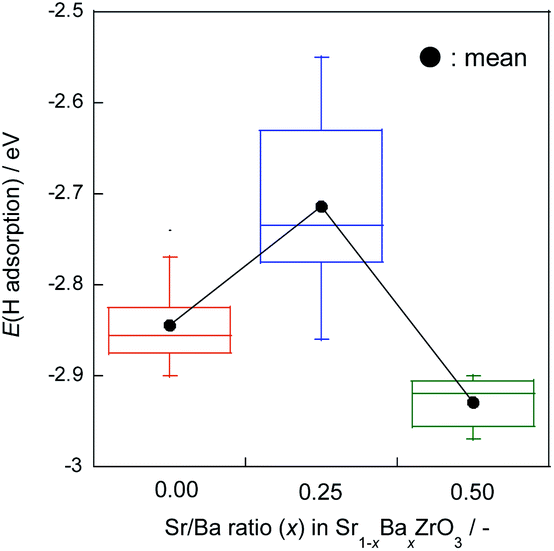 | ||
| Fig. 1 Box plots for H atom adsorption energies over Sr1−xBaxZrO3 (x = 0.00, 0.25, and 0.50) oxides. Whisker length is set as 1.5 times of interquartile range. Black plots show mean values. | ||
 | ||
| Fig. 2 H atom adsorption energies on each oxygen site at Sr1−xBaxZrO3 surfaces for (a) x = 0.00, (b) x = 0.25, and (c) x = 0.50. Only the uppermost lattice oxygens are displayed and color-coded following the results of the Bader charge analysis. Red spheres and blue ones show the electron-rich and the electron-deficient oxygen sites, respectively. The figures in the spheres stand for the calculated H atom adsorption energies. | ||
 | ||
| Fig. 3 Total and partial density of state (DOS) shapes of Sr1−xBaxZrO3 slab models for (a) x = 0.00, (b) x = 0.25, and (c) x = 0.50. The total DOS is drawn with a black line, whereas the partial DOS of Sr is drawn with an orange line, Ba with blue, Zr with green, and O with red. In each figure, the two values indicate the energies of the top of the valence band and the bottom of the conduction band. | ||
3.3. Quantitative analysis for the hydroxy groups (OH)
To evaluate the hydroxy groups (OH) over Sr1−xBaxZrO3 surfaces quantitatively, XPS measurements were conducted. Fig. S7 and S8† represent the obtained C 1s and O 1s XPS spectra of Sr1−xBaxZrO3 (x = 0.00, 0.25, 0.50) samples. The C 1s peak can be decomposed into three components. The peaks at around 285 eV, 286 eV, and 289 eV were assigned respectively to C–C or C–H, C–O, and O–C![[double bond, length as m-dash]](https://www.rsc.org/images/entities/char_e001.gif) O.58,59 The O 1s peak was also decomposed into three components. The peaks at 528 eV, 530 eV, and 532 eV were assigned respectively to lattice oxygens (Olat), O–H or C–O or O–CO, and physisorbed H2O.46,59–61 Based on these assignments, the amounts of OH species are calculable following eqn (3) below, as
O.58,59 The O 1s peak was also decomposed into three components. The peaks at 528 eV, 530 eV, and 532 eV were assigned respectively to lattice oxygens (Olat), O–H or C–O or O–CO, and physisorbed H2O.46,59–61 Based on these assignments, the amounts of OH species are calculable following eqn (3) below, as|
OH ratio = ((area of “OH” + “C–O” + “O–CO” in O 1s spectra)-RSFO1s/RSFC1s(area of “C–O” + “O–CO” in C 1s spectra))/(area of “Olat” in O 1s spectra)
| (3) |
The results of quantitative analysis for the OH groups ratio over Sr1−xBaxZrO3 (x = 0.00, 0.25, 0.50) oxides are shown in Fig. S9.† This analysis revealed that the ratio of OH groups over the oxide surface decreased at x = 0.25. In other words, the H atoms bonded weakly to the surface oxygen sites for x = 0.25. This trend experimentally ensured the results of the H atom adsorption energies predicted by the DFT suggestions.
3.4. Experimental confirmation of the obtained theoretical (DFT) results with activity tests
Based on the DFT suggestions, we presumed that the H atoms over Sr1−xBaxZrO3 at around x = 0.25 exhibited the highest mobility and reactivity. To verify this assumption experimentally, we examined the NH3 synthesis rate in the electric field as a model reaction because the reaction is controlled by surface H atoms migration. XRD patterns for the synthesized Sr1−xBaxZrO3 (x = 0.000, 0.063, 0.125, 0.250, 0.375, 0.500) are shown in Fig. S3.† We confirmed that the peak shifted toward the lower angle region with the increase in Ba2+ content, meaning the increase in the lattice constants. The calculated lattice parameters changed linearly in accordance with Vegard's law.38,62,63 This result demonstrated that Ba2+ cation was ideally incorporated into SrZrO3 at any ratio as in an earlier report, obtained by a synchrotron X-ray diffraction.38 Furthermore, no impure phases were detected under these synthetic conditions.Previous results verified that activated H atoms over the oxide surface can facilitate N2 cleavage via unstable species (N2H intermediate in the case of NH3 synthesis) in the electric field.47 In this mechanism, the formation rate of N2H intermediate determines the overall reaction rate. Therefore, the ability of donating H atoms to N2 is an important factor for NH3 synthesis in the electric field. Results of activity tests using Ru/Sr1−xBaxZrO3 (0.000 ≤ x ≤ 0.500) catalysts are presented in Table 1 and Fig. 4. The NH3 synthesis rates were evaluated under a low temperature region (about 473–493 K), where N2 can only dissociate via unstable N2H intermediate. Therefore, the obtained results strongly reflect the H atoms mobility and reactivity. Results demonstrate that the NH3 synthesis rate achieved the highest value at x = 0.125. Here, we confirmed that the catalyst structures were almost unaltered during these catalytic activity tests. In addition, there were no marked differences in the particle size distribution of Ru and the specific surface area among these catalysts, and the TOF values exhibited the same trend as the NH3 synthesis rates. Moreover, the results detected by an optical measurement and an oxide surface characterization revealed that the influences of Sr2+/Ba2+ ratio on the Ru electronic state were slight for 0.00 ≤ x ≤ 0.50 (see Fig. S5 and S6†). Therefore, the increase in NH3 synthesis rate at x = 0.125 was attributed not to a change in the Ru electronic state, the Ru size, and the specific surface areas but a change in the H+ donating ability derived from the subtle substitution of Sr2+ sites by Ba2+. In conclusion, it became readily apparent that the evaluations and the predictions of H atoms adsorption by theoretical methods provide clear guidelines for manipulating catalytic reactions involving H atoms over oxide surfaces.
| Sr/Ba ratio (x) in 5 wt% Ru/Sr1−xBaxZrO3 | Catalyst-bed temperature (K) | Response voltage (kV) | NH3 synthesis rate (μmol g−1 h−1) | TOF (h−1) | Ru particle size (FE-TEM) (nm) | Specific surface area (BET method) (m2 g−1) |
|---|---|---|---|---|---|---|
| 0.000 | 482.4 | 0.37 | 723.3 | 187 | 8.79 | 4.78 |
| 0.063 | 484.0 | 0.40 | 1108.9 | 248 | 8.17 | 5.20 |
| 0.125 | 490.0 | 0.39 | 1167.3 | 331 | 9.20 | 5.28 |
| 0.250 | 495.2 | 0.43 | 1021.5 | 267 | 8.83 | 5.85 |
| 0.375 | 485.1 | 0.39 | 799.9 | 260 | 9.23 | 5.62 |
| 0.500 | 479.5 | 0.39 | 865.7 | 219 | 8.68 | 6.58 |
 | ||
| Fig. 4 NH3 synthesis rates over 5 wt% Ru/Sr1−xBaxZrO3 (0.000 ≤ x ≤ 0.500) in the electric field (about 473 K, 0.1 MPa, 6.0 mA). The error bar indicates the range in the measured values of the multiple measurements. | ||
4 Conclusion
We investigated and clarified the effects of the perovskite A-site composition on H atoms adsorption using Sr1−xBaxZrO3 (0.00 ≤ x ≤ 0.50) oxides with DFT calculations. Results revealed that the H atoms adsorbed weakly onto the surface for x = 0.25 because of the presence of electron-rich surface oxygen sites. Local lattice distortion at the oxide surface induced by a subtle Ba2+ substitution contributed to this change in the electronic state of surface oxygens.We verified the roles of H atoms reactivities tuned by Ba2+ addition using a model reaction of NH3 synthesis in the electric field because the reaction is controlled by surface H atoms migration. Consequently, NH3 synthesis rate reached the maximum value when Sr2+ sites were replaced by a small amount of Ba2+ (x = 0.125), which agreed well with results obtained using the DFT suggestions. In summary, this investigation demonstrated that theoretical evaluations can predict catalytic performance related to surface H atoms migration over metal oxide surfaces.
Conflicts of interest
There are no conflicts to declare.Acknowledgements
This research was supported as a JST MIRAI.Notes and references
- S. Khoobiar, J. Phys. Chem., 1964, 68, 411–412 CrossRef CAS.
- W. C. Conner and J. L. Falconer, Chem. Rev., 1995, 95, 759–788 CrossRef CAS.
- R. Prins, Chem. Rev., 2012, 112, 2714–2738 CrossRef CAS.
- K. Murakami and Y. Sekine, Phys. Chem. Chem. Phys., 2020, 22, 22852–22863 RSC.
- S. Ogo and Y. Sekine, Chem. Rec., 2017, 17(8), 726–738 CrossRef CAS.
- M. Torimoto, K. Murakami and Y. Sekine, Bull. Chem. Soc. Jpn., 2019, 92(10), 1785–1792 CrossRef CAS.
- Y. Sekine and R. Manabe, Faraday Discuss. 10.1039/c9fd00129h , in press.
- R. Manabe, H. Nakatsubo, A. Gondo, K. Murakami, S. Ogo, H. Tsuneki, M. Ikeda, A. Ishikawa, H. Nakai and Y. Sekine, Chem. Sci., 2017, 8, 5434–5439 RSC.
- K. Murakami, R. Manabe, H. Nakatsubo, T. Yabe, S. Ogo and Y. Sekine, Catal. Today, 2018, 303, 271–275 CrossRef CAS.
- K. Murakami, Y. Tanaka, R. Sakai, K. Toko, K. Ito, A. Ishikawa, T. Higo, T. Yabe, S. Ogo, M. Ikeda, H. Tsuneki, H. Nakai and Y. Sekine, Catal. Today, 2020, 351, 119–124 CrossRef CAS.
- K. Murakami, Y. Tanaka, S. Hayashi, R. Sakai, Y. Hisai, Y. Mizutani, A. Ishikawa, T. Higo, S. Ogo, J. G. Seo, H. Tsuneki, H. Nakai and Y. Sekine, J. Chem. Phys., 2019, 151, 064708 CrossRef.
- K. Murakami, Y. Tanaka, R. Sakai, Y. Hisai, S. Hayashi, Y. Mizutani, T. Higo, S. Ogo, J. G. Seo, H. Tsuneki and Y. Sekine, Chem. Commun., 2020, 56, 3365–3368 RSC.
- R. Manabe, S. Okada, R. Inagaki, K. Oshima, S. Ogo and Y. Sekine, Sci. Rep., 2016, 6, 38007 CrossRef CAS.
- S. Okada, R. Manabe, R. Inagaki, S. Ogo and Y. Sekine, Catal. Today, 2018, 307, 272–276 CrossRef CAS.
- A. Takahashi, R. Inagaki, M. Torimoto, Y. Hisai, T. Matsuda, Q. Ma, J. G. Seo, T. Higo, H. Tsuneki, S. Ogo, T. Norby and Y. Sekine, RSC Adv., 2020, 10, 14487–14492 RSC.
- K. Takise, A. Sato, S. Ogo, J. G. Seo, K. Imagawa, S. Kado and Y. Sekine, RSC Adv., 2019, 9, 27743–27748 RSC.
- M. Kosaka, T. Higo, S. Ogo, J. G. Seo, K. Imagawa, S. Kado and Y. Sekine, Int. J. Hydrogen Energy, 2020, 45(1), 738–743 CrossRef CAS.
- H. Iwahara, H. Uchida, K. Ono and K. Ogaki, J. Electrochem. Soc., 1988, 135(2), 529–533 CrossRef CAS.
- K. D. Kreuer, Chem. Mater., 1996, 8(3), 610–641 CrossRef CAS.
- T. Norby, Solid State Ionics, 1999, 125(1), 1–11 CrossRef CAS.
- K. D. Kreuer, Annu. Rev. Mater. Sci., 2003, 33, 333–359 CrossRef CAS.
- S. Fop, K. S. McCombie, E. J. Wildman, J. M. S. Skakle, J. T. S. Irvine, P. A. Connor, C. Savaniu, C. Ritter and A. C. Mclaughlin, Nat. Mater., 2020, 19(7), 752–757 CrossRef CAS.
- R. Manabe, S. Stub, T. Norby and Y. Sekine, Solid State Commun., 2018, 270, 45–49 CrossRef CAS.
- Y. Hisai, K. Murakami, Y. Kamite, Q. Ma, E. Vøllestad, R. Manabe, T. Matsuda, S. Ogo, T. Norby and Y. Sekine, Chem. Commun., 2020, 56, 2699–2702 RSC.
- J. L. G. Fierro, Catal. Today, 1990, 8, 153–174 CrossRef CAS.
- H. Tanaka and M. Misono, Curr. Opin. Solid State Mater. Sci., 2001, 5(5), 381–387 CrossRef CAS.
- M. A. Peña and J. L. G. Fierro, Chem. Rev., 2001, 101(7), 1981–2018 CrossRef.
- N. Labhasetwar, G. Saravanan, S. K. Megarajan, N. Manwar, R. Khobragade, P. Doggali and F. Grasset, Sci. Technol. Adv. Mater., 2015, 16(3), 036002 CrossRef.
- J. Hwang, R. R. Rao, L. Giordano, Y. Katayama, Y. Yu and Y. Shao–Horn, Science, 2017, 358, 751–756 CrossRef CAS.
- G. Kresse and J. Hafner, Phys. Rev. B: Condens. Matter Mater. Phys., 1993, 47, 558 CrossRef CAS.
- G. Kresse and J. Hafner, Phys. Rev. B: Condens. Matter Mater. Phys., 1994, 49, 14251 CrossRef CAS.
- G. Kresse and J. Furthmüller, Comput. Mater. Sci., 1996, 6(1), 15–50 CrossRef CAS.
- G. Kresse and J. Furthmüller, Phys. Rev. B: Condens. Matter Mater. Phys., 1996, 54, 11169 CrossRef CAS.
- G. Kresse and D. Joubert, Phys. Rev. B: Condens. Matter Mater. Phys., 1999, 59, 1758 CrossRef CAS.
- J. P. Perdew, K. Burke and M. Ernzerhof, Phys. Rev. Lett., 1996, 77, 3865–3868 CrossRef CAS.
- H. J. Monkhorst and J. D. Pack, Phys. Rev. B: Solid State, 1976, 13, 5188–5192 CrossRef.
- S. Grimme, J. Antony, S. Ehrlich and S. Krieg, J. Chem. Phys., 2010, 132, 154104 CrossRef.
- B. J. Kennedy, C. J. Howard, G. J. Thorogood and J. R. Hester, J. Solid State Chem., 2001, 161, 106–112 CrossRef CAS.
- R. A. Evarestov, A. V. Bandura and V. E. Alexandrov, Surf. Sci., 2007, 601, 1844–1856 CrossRef CAS.
- K. Momma and F. Izumi, J. Appl. Crystallogr., 2011, 44, 1272–1276 CrossRef CAS.
- W. Tang, E. Sanville and G. Henkelman, J. Phys.: Condens. Matter, 2009, 21, 084204 CrossRef CAS.
- E. Sanville, S. D. Kenny, R. Smith and G. Henkelman, J. Comput. Chem., 2007, 28, 899–908 CrossRef CAS.
- G. Henkelman, A. Arnaldsson and H. Jónsson, Comput. Mater. Sci., 2006, 36, 354–360 CrossRef.
- M. Yu and D. R. Trinkle, J. Chem. Phys., 2011, 134, 064111 CrossRef.
- A. Sato, S. Ogo, Y. Takeno, K. Takise, J. G. Seo and Y. Sekine, ACS Omega, 2019, 4, 10438 CrossRef CAS.
- T. Higo, K. Ueno, Y. Omori, H. Tsuchiya, S. Ogo, S. Hirose, H. Mikami and Y. Sekine, RSC Adv., 2019, 9, 22721 RSC.
- K. Murakami, Y. Mizutani, H. Sampei, A. Ishikawa, Y. Tanaka, S. Hayashi, S. Doi, T. Higo, H. Tsuneki, H. Nakai and Y. Sekine, Phys. Chem. Chem. Phys. 10.1039/d0cp05752e , in press.
- D. A. Shirley, Phys. Rev. B: Solid State, 1972, 5(12), 4709 CrossRef.
- A. Proctor and P. M. A. Sherwood, Anal. Chem., 1982, 54(1), 13–19 CrossRef CAS.
- Z. Hu, B. Li, X. Y. Sun and H. Metiu, J. Phys. Chem. C, 2011, 115, 3065–3074 CrossRef CAS.
- E. W. McFarland and H. Metiu, Chem. Rev., 2013, 113, 4391–4427 CrossRef CAS.
- K. Toko, K. Ito, H. Saito, Y. Hosono, K. Murakami, S. Misaki, T. Higo, S. Ogo, H. Tsuneki, S. Maeda, K. Hashimoto, H. Nakai and Y. Sekine, J. Phys. Chem. C, 2020, 124(19), 10462–10469 CrossRef CAS.
- J. A. Alonso, M. J. Martínez–Lope, M. T. Casais and M. T. Fernández–Díaz, Inorg. Chem., 2000, 39(5), 917–923 CrossRef CAS.
- J. M. Rondinelli and N. A. Spaldin, Adv. Mater., 2011, 23(30), 3363–3381 CrossRef CAS.
- Q. J. Liu, Z. T. Liu, Y. F. Liu, L. P. Feng, H. Tian and J. G. Ding, Solid State Commun., 2010, 150, 2032–2035 CrossRef CAS.
- R. Prasanna, A. Gold-Parker, T. Leijtens, B. Conings, A. Babayigit, H. G. Boyen, M. F. Toney and M. D. McGehee, J. Am. Chem. Soc., 2017, 139(32), 11117–11124 CrossRef CAS.
- C. A. J. Fisher, A. Taguchi, T. Ogawa and A. Kuwabara, J. Fuel Cell Technol., 2020, 19(3), 95–201 Search PubMed.
- M. Mantel and J. P. Wightman, Surf. Interface Anal., 1994, 21, 595–605 CrossRef CAS.
- E. McCafferty and J. P. Wightman, Surf. Interface Anal., 1998, 26, 549–564 CrossRef CAS.
- J. T. Newberg, D. E. Starr, S. Yamamoto, S. Kaya, T. Kendelewicz, E. R. Mysak, S. Porsgaard, M. B. Salmeron, G. E. Brown Jr, A. Nilsson and H. Bluhm, Surf. Sci., 2011, 605, 89–94 CrossRef CAS.
- G. P. López, D. G. Castner and B. D. Ratner, Surf. Interface Anal., 1991, 17, 267–272 CrossRef.
- L. Vegard and H. Schjelderup, Phys. Z., 1917, 18, 93 CAS.
- A. Yoko, M. Akizuki, N. Umezawa, T. Ohno and Y. Oshima, RSC Adv., 2016, 6, 67525–67533 RSC.
Footnote |
| † Electronic supplementary information (ESI) available. See DOI: 10.1039/d1ra00180a |
| This journal is © The Royal Society of Chemistry 2021 |