
 Open Access Article
 This Open Access Article is licensed under a Creative Commons Attribution-Non Commercial 3.0 Unported Licence
Symbiotic composite composed of MoS2 and pelagic clay with enhanced disinfection efficiency†
Qiwei Sun,
Yuhua Liu,
Zhipeng Liu,
Guoqing Huang,
Shisheng Yuan,
Guohua Yang,
Kaiwen Wang,
Peiping Zhang* and
Nan Li *
*
Key Laboratory of Automobile Materials, Ministry of Education, College of Materials Science and Engineering, Jilin University, 2699, Qianjin Street, Changchun 130012, P. R. China. E-mail: lin@jlu.edu.cn; zhangpp@jlu.edu.cn
First published on 4th March 2021
Abstract
Molybdenum disulfide (MoS2) has attracted increasing attention as a promising photocatalyst. In addition to its application in photocatalytic hydrogen production and pollutant degradation, MoS2 is also used in water disinfection. However, its poor disinfection performance limits its practical utility. Herein, we prepared a symbiotic composite composed of MoS2 and pelagic clay (MoS2/PC) as a photocatalyst for water disinfection. The composite achieved a high disinfection rate of 99.95% to Escherichia coli (E. coli) under visible light illumination, which is significantly higher than that of bulk MoS2 (61.87%). Characterization shows that abundant hydroxyl groups in illite/montmorillonite (I/M) formed during hydrothermal synthesis of MoS2, which contributed to the enhanced disinfection activity. Those hydroxyl groups can attract photogenerated holes through electrostatic attraction, and facilitate the separation of photogenerated charge carriers, thereby enhancing the disinfection activity. Moreover, the good hydrophilicity of pelagic clay improves the dispersity of MoS2 in water, which is beneficial for its utility in aqueous solutions. In addition, the symbiotic structure restricts the growth and aggregation of MoS2 nanosheets and shortens the diffusion distance of charge carriers to the material surface, further reducing the recombination of electrons and holes. This study provides a way to improve the disinfection activity of MoS2 and also sheds light on high value-added utilization of pelagic clay.
Introduction
At present, water pollution remains common around the world. In particular, bacteria in water has an adverse effect on ecosystems and human health.1,2 Photocatalysts have received extensive attention in disinfection applications due to their environmentally friendly characteristics.3–6 Photocatalysts can harvest light energy to generate electron–hole pairs, which can further react with the oxygen and hydroxyl groups adsorbed on the material surface to form reactive oxygen species (ROS) and further inactivate bacteria.7,8 As a new type of photocatalyst, MoS2 has received increasing attention in virtue of its narrow bandgap and layered structure.2,9–11 As compared to the bandgap of titanium dioxide (3.0–3.2 eV), the bandgap of MoS2 is only 1.3–1.9 eV, thus allowing it to take full advantage of visible light.3,4However, previous reports have indicated that bulk MoS2 is of relatively low disinfection efficiency.12,13 High recombination rate of the photogenerated electrons and holes makes it difficult to generate ROS and further limits antibacterial activity. The large size of bulk MoS2 nanosheets with long diffusion distance also inhibits the separation of photogenerated electron–hole pairs. Additionally, MoS2 is hydrophobic and cannot be uniformly dispersed in water, which greatly limits its photocatalytic application in aqueous solutions. The strategies used to enhance the antibacterial performance of MoS2 mainly include promoting the separation of photogenerated carriers and improving the hydrophilicity. Preparation of single-layer or few-layer MoS2 nanosheets,12,14,15 doping metals,16–19 and constructing heterostructures13 have been demonstrated to be efficient in promoting the separation of photogenerated electron–hole pairs. Some of these methods can also decrease the lateral size and thickness of MoS2 nanosheets and thus shorten the distance for electrons and holes to diffuse to the material surface. In terms of hydrophilicity improvement, previous studies have succeeded by combining MoS2 with hydrophilic materials.20,21 Although great progress has been made, the existing disinfection performance of MoS2 is still insufficient for practical application. Therefore, it is highly desirable to prepare MoS2 with high antibacterial activity for aqueous solutions.
Herein, we prepared a composite photocatalyst with a symbiotic structure by combining MoS2 and pelagic clay through hydrothermal reaction. Pelagic clay is a rich natural marine resource with a volume of about 107 km3.22–25 Therefore, it is meaningful to apply pelagic clay for high value-added utilization. Moreover, pristine pelagic clay is of low crystallization, high structural activity, and high hydrophilicity.26 The combination of pelagic clay with MoS2 is beneficial for the improvement in disinfection efficiency. First of all, hydrothermal reaction can promote the crystallization of pelagic clay and further increase the number of hydroxyl groups in the structure. More hydroxyl groups can attract more photogenerated holes by electrostatic interaction, thereby reducing the recombination rate of the photogenerated carriers. Additionally, the symbiotic feature can inhibit the growth of MoS2 nanosheets, and thus decrease the distance for photogenerated carriers to diffuse to materials surface. Furthermore, the good hydrophilicity of pelagic clay is beneficial for the application of the composite in aqueous systems. As expected, the MoS2/pelagic clay composite achieved significantly enhanced disinfection efficiency under visible light illumination.
Experimental
Catalyst preparation
Pelagic clay was obtained from the Indian Ocean. In a typical preparation process, 3 g pelagic clay and 0.35 g hexadecyl trimethyl ammonium bromide (CTAB) were mixed into deionized water and stirred for 24 h at 60 °C. 1.21 g sodium molybdate (Na2MoO4·2H2O) and 1.5 g thioacetamide (CH3CSNH2) were then added into the solution to get a mass ratio of MoS2/pelagic clay of 20% with content of MoS2 20%. The mixture was sonicated for 30 min and stirred for 24 h at 50 °C. Finally, the mixture was transferred into a 100 mL Teflon-lined stainless autoclave and heated at 220 °C for 24 h. After cooling to room temperature, the precipitate was centrifuged, thoroughly washed with deionized water and absolute ethanol and then dried in air. The product was marked as 20% MoS2/PC. Similarly, 5% MoS2/PC, 10% MoS2/PC, 30% MoS2/PC, and 40% MoS2/PC were prepared through the same method by adjusting the ratio of Na2MoO4·2H2O and CH3CSNH2 to pelagic clay, respectively. Bulk MoS2 was prepared in the same way but omitting the addition of pelagic clay. A mechanically mixed sample was prepared by mixing bulk MoS2 and pelagic clay with a mass ratio of MoS2/pelagic clay 1![[thin space (1/6-em)]](https://www.rsc.org/images/entities/char_2009.gif) :19 through grinding, which was marked as m-5% MoS2/PC.
:19 through grinding, which was marked as m-5% MoS2/PC.
Characterization
X-ray diffraction (XRD) analysis was performed using a DX2700 diffractometer with a Cu Kα radiation source (λ = 1.5406 nm) in a 2θ range of 5–80°. Fourier transform infrared spectroscopy (FT-IR) was tested using a NICOLET380 spectrometer in the range of 4000–400 cm−1 with 128 scans per spectrum. Specific surface area data were obtained from a JW-BK222 automated sorption system using the Brunauer–Emmett–Teller (BET) method. Scanning electron microscopy (SEM) tests were performed on a JEOL JSM-6700F microscope. Transmission electron microscopy (TEM) and energy dispersive spectroscopy (EDS) characterizations were performed with a JEOL JEM-2100F microscope at an acceleration voltage of 200 kV. X-ray photoelectron spectroscopy (XPS) analysis was tested on an ESCAlabMK-II electronic spectrometer. Raman spectra were measured using a micro-Raman spectrometer (Renishaw) with a laser wavelength of 532 nm at 0.2 mW. Surface wettability of samples was measured on a C20001C contact angle meter.Bacteria inactivation test
First, bacteria (E. coli 8739) were activated at 37 °C for 24 h and cultured to the log phase. Then the concentrations were measured by aerobic count plates. The bacterial solution was then diluted to approximately 106 cfu mL−1 (c0). To keep the mass of MoS2 in all samples consistent, 1.2 mg bulk MoS2, 24 mg 5% MoS2/PC, 12 mg 10% MoS2/PC, 6 mg 20% MoS2/PC, 4 mg 30% MoS2/PC, 3 mg 40% MoS2/PC, and 4.8 mg pelagic clay were added to 100 mL of the E. coli solution, respectively. The solutions were then illuminated under visible light (400–800 nm, 100 W cm−2) for 18 h. Then, the bacterial solutions were diluted by gradient, and the concentrations of these diluted solutions were measured by aerobic count plates. Finally, the concentrations of the bacteria in the original solutions (c1) were calculated. Each group of samples was performed twice in parallel, and the final antibacterial rate were calculated according to the average of parallel experiment results. The formula for the antibacterial rate (a) is a = ((c0 − c1)/c0) × 100%.Fluorescence test
1.2 mg bulk MoS2, 24 mg 5% MoS2/PC, 12 mg 10% MoS2/PC, 6 mg 20% MoS2/PC, 4 mg 30% MoS2/PC, 3 mg 40% MoS2/PC, and 4.8 mg pelagic clay were respectively dispersed in a solution containing NaOH (0.01 mol L−1) and terephthalic acid (TA, 3 mmol L−1) and darkened for 30 min. These solutions were then illuminated with visible light (400–800 nm, 100 W cm−2) for 1 h. Finally, the fluorescence intensities of the solutions were measured by fluorescence spectrophotometer. Photoluminescence was performed on a F-380 fluorescence spectrophotometer under 150 W xenon light of 315 nm.Results and discussion
Structure characterization
X-ray diffraction (XRD) patterns of pristine pelagic clay, MoS2 and MoS2/PC are shown in Fig. 1a. It reveals poor crystallization of pelagic clay. Only diffractions from impurities such as quartz, feldspar, kaolinite, and calcite are observed, while the pelagic clay is amorphous. In the MoS2/PC composites, two diffraction peaks at 8° and 20° are observed, which are attributed to the diffraction from (002) and (020) planes of illite/montmorillonite (I/M) mineral, respectively, suggesting that the amorphous substance in pelagic clay crystallized to form I/M mineral. Moreover, as the mass content of MoS2 in the composites increases, the intensity of (002) peak gradually increases and reaches a maximum when MoS2 achieves 20%. It suggests the hydrothermal formation process of MoS2 promotes the crystallization of I/M. As compared to the XRD pattern of bulk MoS2, the composite samples do not show characteristic peak of (002) plane of MoS2 at 14°, which is attributed to the small number of stacked layers and poor long-range order of MoS2 nanosheets as a result of the restriction of symbiotic structure.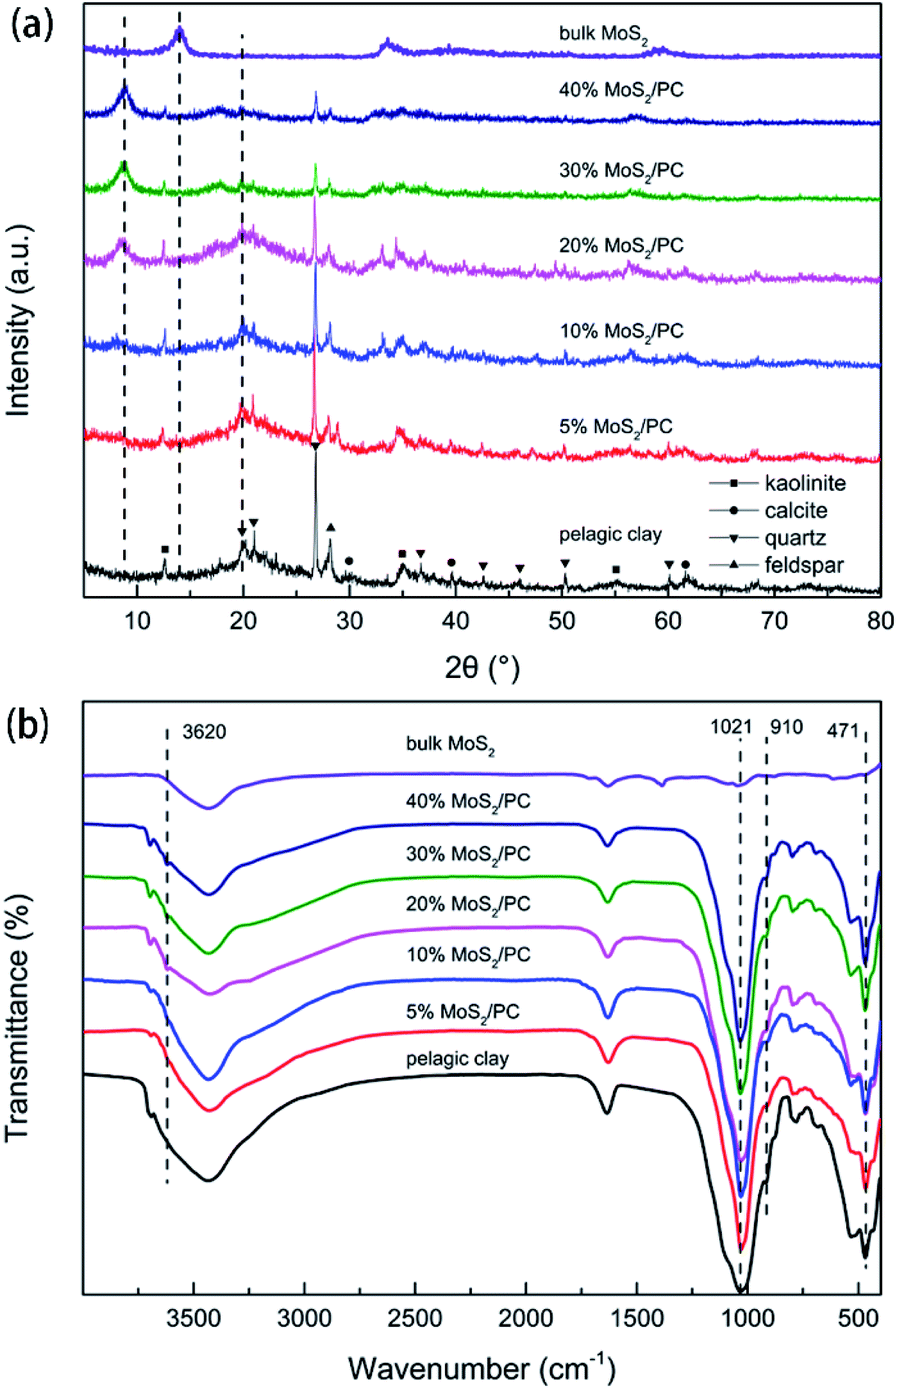 | ||
| Fig. 1 (a) XRD patterns and (b) FTIR spectra of pelagic clay, 5% MoS2/PC, 10% MoS2/PC, 20% MoS2/PC, 30% MoS2/PC, 40% MoS2/PC, and bulk MoS2. | ||
Fourier transform infrared spectroscopy (FTIR) results are shown in Fig. 1b. For pelagic clay, the absorption peak at 471 cm−1 represents the bending vibration of Al–O, and the absorption peak at 1021 cm−1 suggests the antisymmetric stretching vibration of Si–O–Si, which originate from AlO6 octahedron and SiO4 tetrahedron, respectively. After hybridized with MoS2, 20% MoS2/PC, 30% MoS2/PC, and 40% MoS2/PC show vibration absorption from hydroxyl group at 3620 cm−1, representing the stretching vibration of hydroxyl group in the interlayer of I/M mineral. However, because the changes in bending vibration of hydroxyl group is less obvious than that in stretching vibration, the peaks at 910 cm−1 did not change significantly. The appearance of hydroxyl group signals indicates the increased number of hydroxyl group in I/M mineral and the presence of layered structure of I/M mineral. The structural unit layer of I/M mineral is schematically shown in Fig. 2. As discussed above, pelagic clay is of low crystallinity, and the hydroxyl groups in AlO6 octahedron are exposed and easily be replaced by other groups, leading to a decrease in hydroxyl group number. After hydrothermal reaction, the long-range order of I/M mineral is significantly increased. Thus, SiO4 tetrahedron layers can protect hydroxyl groups, and hence the number of hydroxyl groups increase. The good crystallinity also results in the appearance of 8° diffraction peak in the XRD pattern.
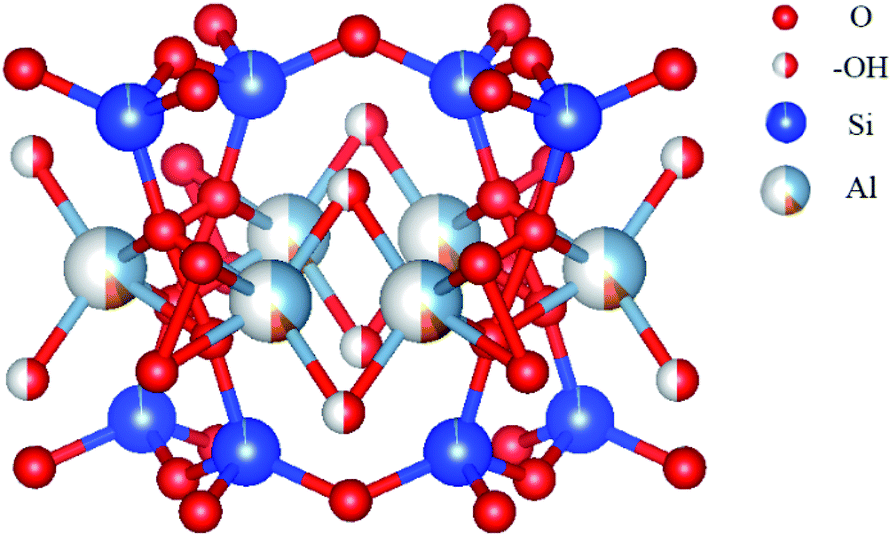 | ||
| Fig. 2 Schematic for the structural unit layer of illite–montmorillonite. | ||
N2 adsorption test shows the Brunauer–Emmett–Teller (BET) specific surface area of pelagic clay, 5% MoS2/PC, 10% MoS2/PC, 20% MoS2/PC, 30% MoS2/PC, 40% MoS2/PC, bulk MoS2 and m-5% MoS2/PC are 100.4, 28.8, 22.6, 13.9, 10.8, 13.0, 4.5, and 82 m2 g−1, respectively. m-5% MoS2/PC was prepared by mixing bulk MoS2 and pelagic clay with a mass ratio of MoS2/pelagic clay 1:19 through grinding. Obviously, the specific surface area of pelagic clay is relatively high while those of all the MoS2/PC composites are small. Moreover, as the content of MoS2 in the composites increases, the specific surface areas of the samples gradually decrease. It is worth mentioning that the composite samples exhibit a sharp decrease in specific surface area as compared to pelagic clay. Additionally, the specific area of m-5% MoS2/PC is much higher than that of the 5% MoS2/PC sample. This phenomenon indicates that during the crystallization of pelagic clay, MoS2 filled in the voids between layers of I/M mineral, resulting in a decrease in its internal surface area. But, in the mechanically mixed sample, MoS2 occurs on the surface of pelagic clay. Moreover, the similar specific surface area indicates that the interlayer space of I/M mineral is almost filled when the content of MoS2 reaches 20%. The corresponding N2 adsorption/desorption isotherm curves (Fig. S1†) confirm this deduction. The isotherm curves of pelagic clay, 5% MoS2/PC, 10% MoS2/PC and m-5% MoS2/PC exhibit typical H3 hysteresis loop, which suggests that part of the interlayer space of I/M mineral is unoccupied. However, 20% MoS2/PC, 30% MoS2/PC and 40% MoS2/PC did not show hysteresis loop, indicating that the interlayer space is almost filled.
Scanning electron microscopy (SEM) images of the samples are shown in Fig. 3. Pristine pelagic clay (lateral size of ∼300 nm) does not show obvious stacking and laminar structure (Fig. 3a). In 5% MoS2/PC and 10% MoS2/PC samples (Fig. 3b and c), stacked mineral crystal flakes with large size of ∼1 μm are observed. Such crystal flakes are absent in pristine pelagic clay sample, indicating that pelagic clay crystallized after being combined with MoS2. Fig. 3d indicates that MoS2 nanosheets grow vertically on the smooth surface of I/M mineral sheets and form a symbiotic structure. The lateral dimension of the MoS2 nanosheets is 50–200 nm, and the thickness is approximately 18 nm. When the content of MoS2 increases, as shown in Fig. 3e, more MoS2 nanosheets with gradually increased size are observed. When the proportion of MoS2 reaches 40% (Fig. 3f), MoS2 nanosheets aggregate on the outer surface of I/M mineral, forming a flower-like structure with a lateral size of approximately 500 nm and a thickness of 30 nm, which are similar to bulk MoS2 (Fig. S2†).
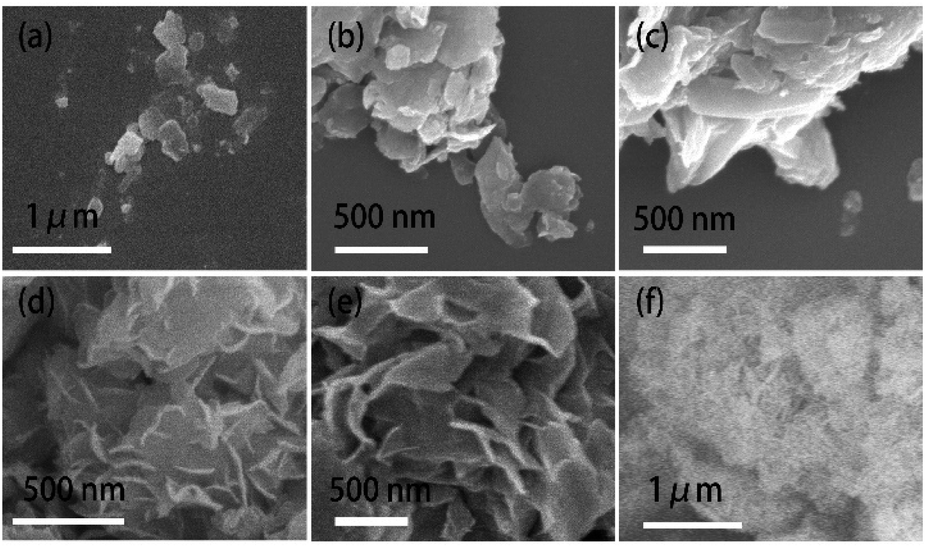 | ||
| Fig. 3 SEM images of (a) pelagic clay, (b) 5% MoS2/PC, (c) 10% MoS2/PC, (d) 20% MoS2/PC, (e) 30% MoS2/PC and (f) 40% MoS2/PC. | ||
Transmission electron microscopy (TEM) and high-resolution transmission electron microscopy (HRTEM) images of pelagic clay and 20% MoS2/PC are shown in Fig. 4. Unobvious crystal structure and no lattice are observed in TEM and HRTEM images of pelagic clay (Fig. 4a and b), which further validates its amorphous structure. After hybridizing pelagic clay with MoS2, the I/M mineral flake and MoS2 nanosheets grow together (Fig. 4c). In the HRTEM image (Fig. 4d), two types of lattice a and b are observed. The lattice labelled (a) shows a spacing of 0.45 nm, which can be indexed as the (020) plane of I/M mineral and further proves that I/M mineral is crystallized. The lattice labelled (b) exhibits a spacing of 0.62 nm, corresponding to the layer spacing in the c-axis direction of MoS2. It further proves that I/M mineral and MoS2 nanosheets form a symbiotic structure. Energy dispersive spectroscopy (EDS) test was carried out on 20% MoS2/PC. As shown in Fig. 4e–i, the sample is mainly composed of Si, Al, Mo, and S. Moreover, Mo and S are observed in most areas where there are I/M minerals, thus validating their symbiosis.
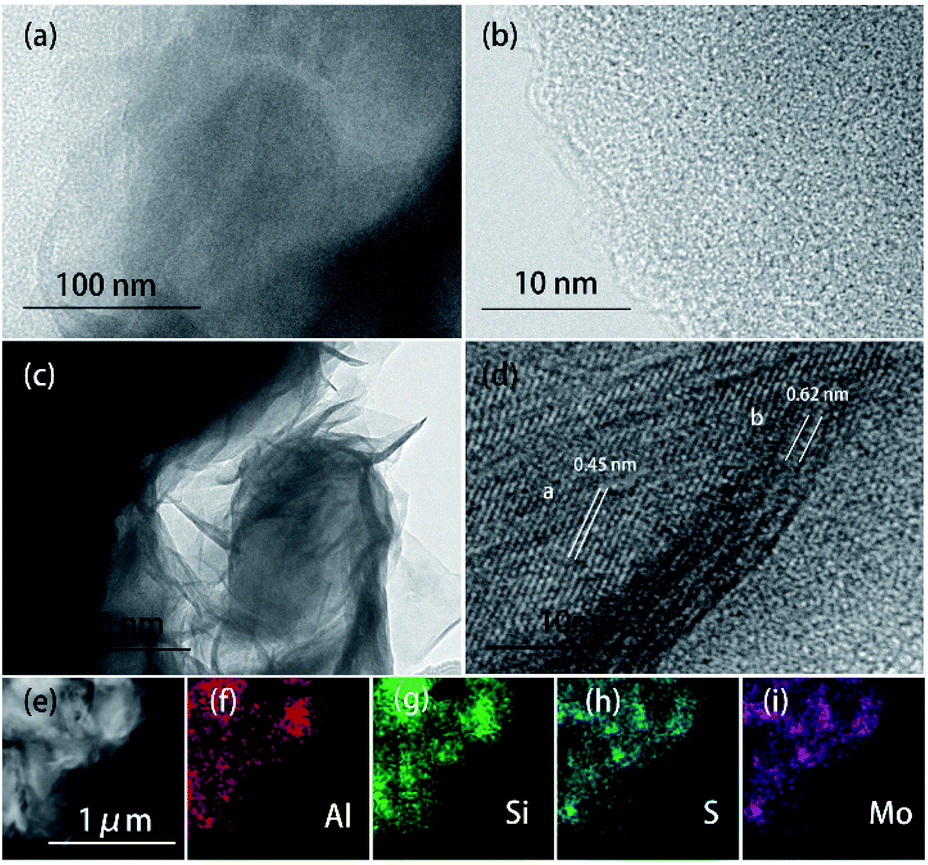 | ||
| Fig. 4 (a) TEM image and (b) HRTEM image of pelagic clay, (c) TEM image and (d) HRTEM image of 20% MoS2/PC, (e) HAADF-STEM dark field image of 20% MoS2/PC, and (f–i) element distribution of Al, Si, S, and Mo in 20% MoS2/PC. | ||
X-ray photoelectron spectroscopy (XPS) measurements were performed on pristine pelagic clay, bulk MoS2 and 20% MoS2/PC, and the results are shown in Fig. 5. The above samples were scanned for full-spectrum (Fig. 5a). It reveals the presence of Al, Si, and O elements in pelagic clay and S and Mo elements in bulk MoS2. 20% MoS2/PC exhibits the peaks ascribed to Al, Si, O, S, and Mo elements. High resolution Mo 3d spectra of 20% MoS2/PC and bulk MoS2 are shown in Fig. 5b. The Mo 3d3/2 and Mo 3d5/2 peaks of 20% MoS2/PC, corresponding to Mo4+ species in MoS2, are located at 231.6 eV and 228.4 eV, respectively. The two peaks shift to lower binding energy relative to that of bulk MoS2. Additionally, the peaks at 232.6 eV and 235.6 eV are indexed as Mo6+ species in MoO3. However, these peaks are not found in bulk MoS2. It is attributed to the high crystallinity of bulk MoS2 with few defects. However, there are many defects in composites caused by the restricted growth of MoS2 nanosheets. Therefore, 20% MoS2/PC is easy to be oxidized to MoO3. Additionally, some oxides in pelagic clay may also promote the oxidation process during hydrothermal reaction process. High resolution S 2p spectra of 20% MoS2/PC and bulk MoS2 are shown in Fig. 5c. For 20% MoS2/PC, two peaks located at 161.5 eV and 162.7 eV are assigned to S 2p1/2 and S 2p3/2, corresponding to the S2− in MoS2. Compared to that of bulk MoS2 at 161.8 eV and 162.9 eV, S 2p of 20% MoS2/PC shifts towards lower binding energy. The decrease in the binding energy of Mo and S reveals electron transfer from I/M mineral to MoS2, resulting in an increase of electron density on MoS2. It is reported that this increase in electron density may result in the formation of electron transfer channel,27–29 which is beneficial to promote the separation of photogenerated carriers. The high separation rate will further enhance photocatalytic activity.
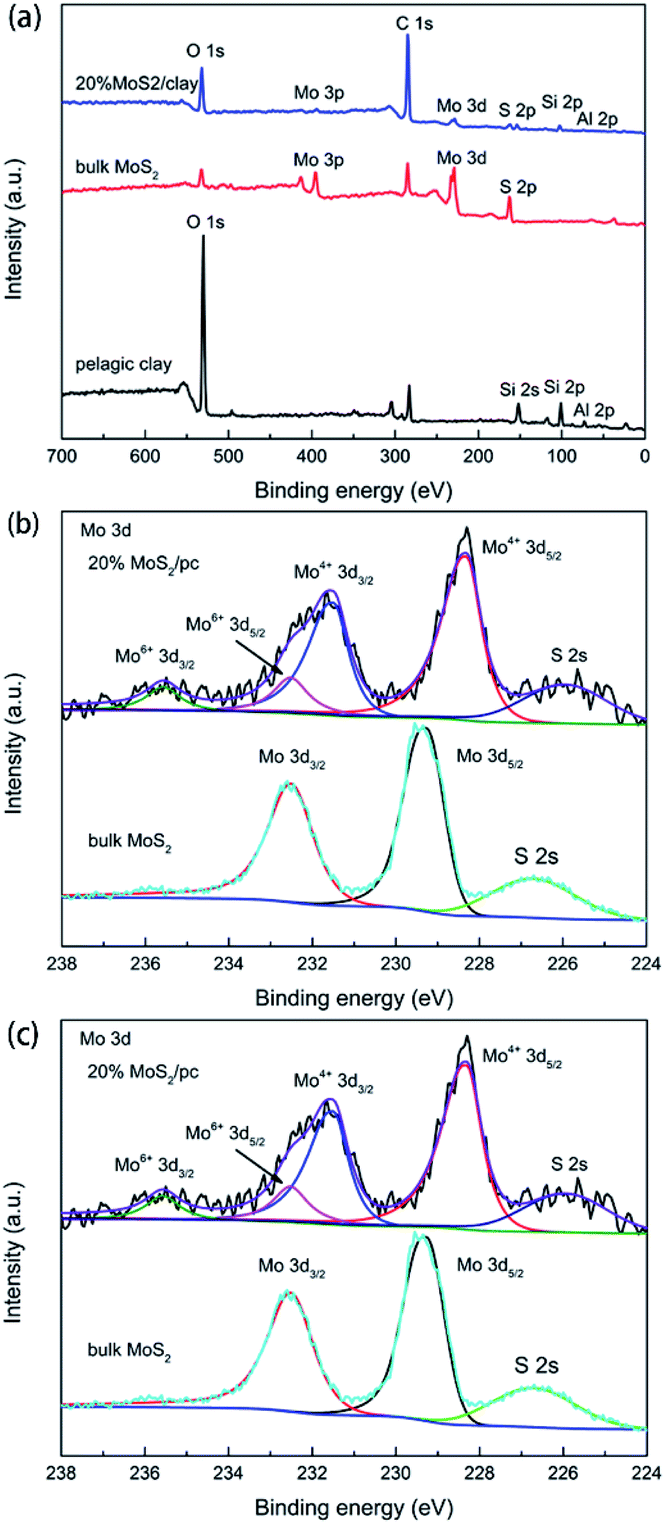 | ||
| Fig. 5 (a) XP survey spectra of 20% MoS2/PC, bulk MoS2 and pelagic clay. High-resolution scans for (b) Mo 3d and (c) S 2p regions of 20% MoS2/PC and bulk MoS2. | ||
Fig. 6 shows surface wettability test results. Bulk MoS2 exhibits hydrophobicity with a water contact angle of 113.41°. After being hybridized with pelagic clay, the contact angle decreases to 32.81°, indicating that pelagic clay significantly improved the hydrophilicity of MoS2. This improves dispersion of MoS2 in aqueous solutions and then is beneficial for its application in water disinfection.
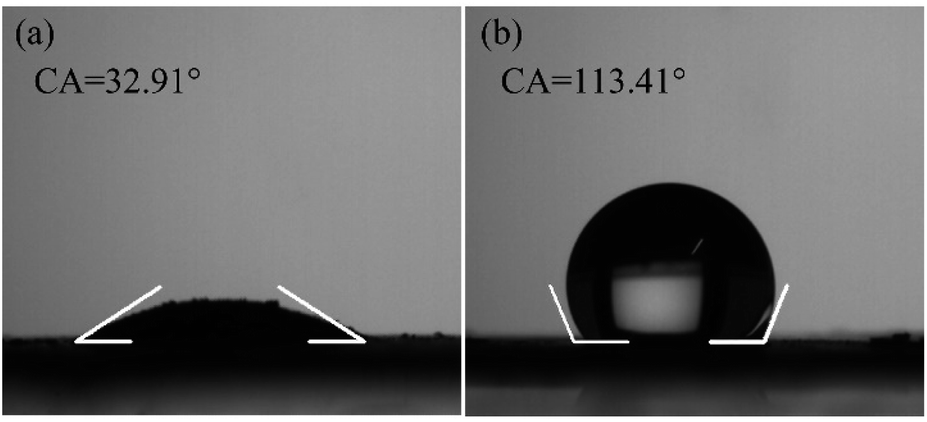 | ||
| Fig. 6 Surface wettability of (a) 20% MoS2/PC and (b) bulk MoS2. | ||
Disinfection performance
The antibacterial test results of pristine clay, MoS2 and MoS2/PC are shown in Fig. 7. The antibacterial rates were calculated according to the number of colonies on aerobic count plates (see details in Experiment section). Pelagic clay shows no antibacterial activity, and the antibacterial rates of 5% MoS2/PC, 10% MoS2/PC, 20% MoS2/PC, 30% MoS2/PC, and 40% MoS2/PC are 76.25%, 78.47%, 99.95%, 79.65%, and 72.27%, respectively. Bulk MoS2 exhibits a low antibacterial rate of 61.87%. A comparison shown in Fig. 8a indicates that disinfection rates increase firstly and then decrease as the content of MoS2 in MoS2/PC composites increases, and 20% MoS2/PC exhibits the highest disinfection rate.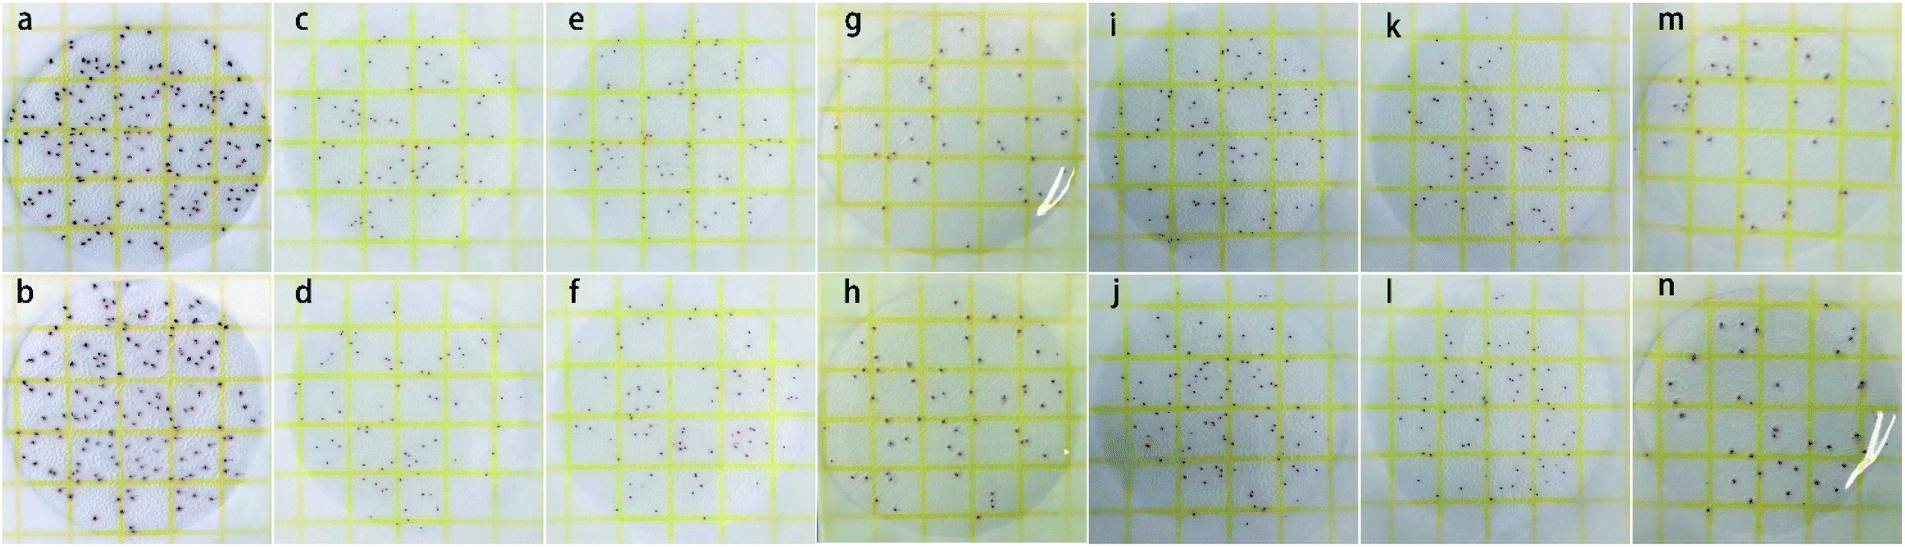 | ||
| Fig. 7 Antibacterial experiment images of (a and b) pelagic clay (diluted 104 times), (c and d) 5% MoS2/PC (diluted 107 times), (e and f) 10% MoS2/PC (diluted 107 times), (g and h) 20% MoS2/PC (diluted 10 times), (i and j) 30% MoS2/PC (diluted 107 times), (k and l) 40% MoS2/PC (diluted 107 times), and (m and n) bulk MoS2 (diluted 104 times). | ||
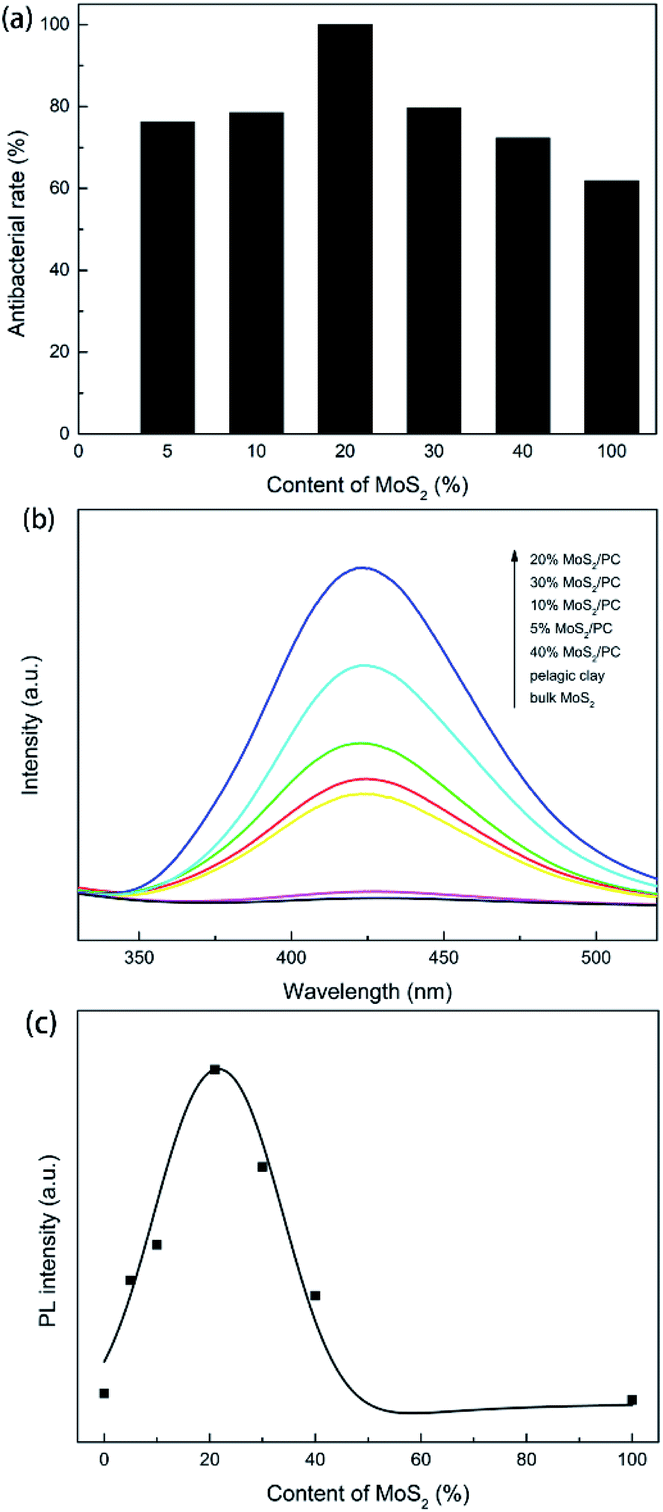 | ||
| Fig. 8 (a) A comparison of antibacterial rate on MoS2/PC composites. (b) PL spectra of suspensions of pelagic clay, bulk MoS2 and MoS2/PC composites, and (c) the dependence of fluorescence intensity at 425 nm on MoS2 content in MoS2/PC composites. | ||
Disinfection mechanism
Hydroxyl radical content in an aqueous solution can be detected via photoluminescence. The hydroxyl radicals in solution can react with terephthalic acid (TA) to form stable hydroxyterephthalic acid with fluorescent properties. Higher hydroxyterephthalic acid concentrations generally lead to stronger fluorescence intensities. Herein, we test the ability of catalysts to generate hydroxyl radicals by measuring fluorescence intensity of solutions. The solutions were prepared through suspending pelagic clay, MoS2 and MoS2/PC in deionized water, respectively. The results are shown in Fig. 8b. It suggests that the suspensions containing MoS2 and pelagic clay do not exhibit discernible fluorescence intensity. But fluorescence intensity of composite samples suspensions is higher. According to Fig. 8c, as the MoS2 content increases, the hydroxyl radical concentration in solution increases first and then decreases, and reaches maximum at an MoS2 content of 20%. This result matches well with the antibacterial test result. Although pristine MoS2 is active for photocatalytic disinfection, it shows a relatively low antibacterial activity due to the low concentration of hydroxyl radicals caused by high recombination rate of photogenerated carriers.Bulk MoS2 generates photogenerated electron–hole pairs under illumination. The holes can combine with hydroxyl groups in the solution to form hydroxyl radicals, while the electrons can combine with oxygen in the solution to form superoxide radicals, and then superoxide radicals can react with H+ to generate hydroxyl radicals, thus completing sterilization under the lead role of hydroxyl radicals. As discussed above, in the hydrothermal process, MoS2 and I/M mineral grew together to form a symbiotic structure. In addition, the formation process of MoS2 promotes the crystallization of I/M mineral. I/M mineral with better crystallinity has more hydroxyl groups. Hydroxyl groups can attract photogenerated holes via electrostatic interaction to promote separation of photogenerated carriers. As a result, the electrons are easier to diffuse to materials surface and combine with oxygen to form hydroxyl radicals, which in turn increases the concentration of hydroxyl radical in the solution. Therefore, the antibacterial activity of MoS2 is improved. Moreover, the symbiotic growth of pelagic clay and MoS2 can effectively limit the growth of MoS2 nanosheets. The small MoS2 nanosheets are beneficial for photogenerated electrons and holes to diffuse to the edges of nanosheets and then separate, resulting in an enhancement in photocatalytic activity. In addition, the good hydrophilicity of pelagic clay improves dispersity of MoS2 in water, which is helpful to its application in aqueous systems. Among all the composite samples, 5% MoS2/PC and 10% MoS2/PC are of low crystallinity, and the MoS2 nanosheets in 30% MoS2/PC and 40% MoS2/PC samples exhibit increased size and aggregation compared to 20% MoS2/PC, which are not conducive to the separation of the photogenerated electron–hole pairs, thus result in relatively low antibacterial rates. By contrast, the 20% MoS2/PC is of high I/M mineral crystallinity and small MoS2 nanosheet, both of which contribute to the superior antibacterial performance.
Conclusions
We successfully prepared symbiotic composite of MoS2 and pelagic clay. The amorphous substance in the pelagic clay crystallized to form I/M mineral with more hydroxyl groups via hydrothermal reaction. Hydroxyl groups attract photogenerated holes and inhibit electron–hole recombination, thus increasing the hydroxyl radical concentration in the solution. Moreover, pelagic clay promotes the dispersion of MoS2 in aqueous solution. In addition, the symbiotic growth reduces the size of MoS2 nanosheets, and shortens the distance for photogenerated carriers to diffuse to surface. As a result, MoS2/PC exhibits superior antibacterial activity with a disinfection rate of 99.95% to E. coli 8739. The composite shows potential as a photocatalyst in water disinfection field.Author contributions
All authors have given approval to the final version of the manuscript.Conflicts of interest
The authors declare that they have no known competing financial interests or personal relationships.Acknowledgements
We acknowledge the financial supports from China Ocean Mineral Resources R&D Association (COMRA) Special Foundation (DY135-R2-1-01, DY135-46), National Natural Science Foundation of China (NSFC) (No. 22072056), Scientific and Technological Project of Jilin Province (No. 20190201015JC).References
- J. Liu, C. Dong, Y. Deng, J. Ji, S. Bao, C. Chen, B. Shen, J. Zhang and M. Xing, Water Res., 2018, 145, 312–320 CrossRef CAS PubMed.
- Y. Gao, C. Chen, X. Tan, H. Xu and K. Zhu, J. Colloid Interface Sci., 2016, 476, 62–70 CrossRef CAS PubMed.
- B. Chen, Y. Meng, J. Sha, C. Zhong, W. Hu and N. Zhao, Nanoscale, 2017, 10, 34–68 RSC.
- W. Zhang, X. Xiao, L. Zheng and C. Wan, Can. J. Chem. Eng., 2015, 93, 1594–1602 CrossRef CAS.
- Y. Qu and X. Duan, Chem. Soc. Rev., 2013, 42, 2568–2580 RSC.
- A. Ibhadon and P. Fitzpatrick, Catalysts, 2013, 3, 189–218 CrossRef CAS.
- X. Tian, Y. Sun, S. Fan, M. D. Boudreau, C. Chen, C. Ge and J. J. Yin, ACS Appl. Mater. Interfaces, 2019, 11, 4858–4866 CrossRef CAS PubMed.
- H. Park, Y. Park, W. Kim and W. Choi, J. Photochem. Photobiol., C, 2013, 15, 1–20 CrossRef CAS.
- Z. Wang and B. Mi, Environ. Sci. Technol., 2017, 51, 8229–8244 CrossRef CAS PubMed.
- A. Midya, A. Ghorai, S. Mukherjee, R. Maiti and S. K. Ray, J. Mater. Chem. A, 2016, 4, 4534–4543 RSC.
- V. Hasija, P. Raizada, V. K. Thakur, A. A. Parwaz Khan, A. M. Asiri and P. Singh, J. Environ. Chem. Eng., 2020, 8, 104307 CrossRef CAS.
- C. Liu, D. Kong, P. C. Hsu, H. Yuan, H. W. Lee, Y. Liu, H. Wang, S. Wang, K. Yan, D. Lin, P. A. Maraccini, K. M. Parker, A. B. Boehm and Y. Cui, Nat. Nanotechnol., 2016, 11, 1098–1104 CrossRef CAS PubMed.
- J. Qiu, W. Zheng, R. Yuan, C. Yue, D. Li, F. Liu and J. Zhu, Appl. Catal., B, 2020, 264, 118514 CrossRef.
- C. Zhang, D. F. Hu, J. W. Xu, M. Q. Ma, H. Xing, K. Yao, J. Ji and Z. K. Xu, ACS Nano, 2018, 12, 12347–12356 CrossRef CAS PubMed.
- F. Alimohammadi, M. Sharifian Gh, N. H. Attanayake, A. C. Thenuwara, Y. Gogotsi, B. Anasori and D. R. Strongin, Langmuir, 2018, 34, 7192–7200 CrossRef CAS PubMed.
- M. Ikram, R. Tabassum, U. Qumar, S. Ali, A. Ul-Hamid, A. Haider, A. Raza, M. Imran and S. Ali, RSC Adv., 2020, 10, 20559–20571 RSC.
- T.-M. Chou, S.-W. Chan, Y.-J. Lin, P.-K. Yang, C.-C. Liu, Y.-J. Lin, J.-M. Wu, J.-T. Lee and Z.-H. Lin, Nano Energy, 2019, 57, 14–21 CrossRef CAS.
- Y. Li, Y. Liu, D. Yang, Q. Jin, C. Wu and J. Cui, J. Hazard. Mater., 2020, 394, 122551 CrossRef CAS PubMed.
- W. P. C. Lee, T. L. Perix, K. A. R. Packiam, M.-M. Gui, C. W. Ooi and S.-P. Chai, Catal. Commun., 2020, 140, 106003 CrossRef CAS.
- K. Peng, L. Fu, J. Ouyang and H. Yang, Adv. Funct. Mater., 2016, 26, 2666–2675 CrossRef CAS.
- K. Xiao, T. Wang, M. Sun, A. Hanif, Q. Gu, B. Tian, Z. Jiang, B. Wang, H. Sun, J. Shang and P. K. Wong, Environ. Sci. Technol., 2020, 54, 537–549 CAS.
- J. Dutilleul, S. Bourlange, M. Conin and Y. Géraud, Mar. Pet. Geol., 2020, 111, 156–165 CrossRef CAS.
- F. Inagaki, M. Suzuki, K. Takai, H. Oida, T. Sakamoto, K. Aoki, K. H. Nealson and K. Horikoshi, Appl. Environ. Microbiol., 2003, 69, 7224–7235 CrossRef CAS PubMed.
- P. Sipos, T. Nemeth and I. Mohai, Environ. Geochem. Hlth., 2005, 27, 1–10 CAS.
- P. M. V. Jolanda, M. H. Verspagen and J. Huisman, Aquat. Microb. Ecol., 2006, 44, 165–174 CrossRef.
- D. Zawadzki, Ł. Maciąg, T. Abramowski and K. McCartney, Minerals, 2020, 10, 320–357 CrossRef CAS.
- W. Zhou, Z. Yin, Y. Du, X. Huang, Z. Zeng, Z. Fan, H. Liu, J. Wang and H. Zhang, Small, 2013, 9, 140–147 CrossRef CAS PubMed.
- J. Xu and X. Cao, Chem. Eng. J., 2015, 260, 642–648 CrossRef CAS.
- B. Jiang, C. Tian, Q. Pan, Z. Jiang, J.-Q. Wang, W. Yan and H. Fu, J. Phys. Chem. C, 2011, 115, 23718–23725 CrossRef CAS.
Footnote |
| † Electronic supplementary information (ESI) available. See DOI: 10.1039/d1ra00008j |
| This journal is © The Royal Society of Chemistry 2021 |