 Open Access Article
Versatile one-pot synthesis of gold nanoclusters and nanoparticles using 3,6-(dipyridin-2-yl)-(1,2,4,5)-tetrazine†
Yahdi Bin Rusa,
Margarita Bosmia,
Stéphane Maisonneuvea,
Vincent Guérineaub,
Vincent Noëlc,
Alexa Courtyd and
Fabien Miomandre *a
*a
aUniversité Paris-Saclay, ENS Paris-Saclay, CNRS, PPSM, 4 Avenue des Sciences, 91190 Gif-sur-Yvette, France. E-mail: mioman@ens-paris-saclay.fr
bUniversité Paris-Saclay, CNRS, Institut de Chimie des Substances Naturelles, UPR2301, 91198 Gif-sur-Yvette, France
cUniversité de Paris, CNRS, ITODYS, 15 rue Jean de Baïf, 75013 Paris, France
dSorbonne Université, CNRS, MONARIS, 4 place Jussieu, 75005 Paris, France
First published on 10th February 2021
Abstract
A one-pot synthesis of gold nano-objects is described by simply mixing a gold salt (HAuCl4), dodecanethiol and 3,6-di-2-pyridyl-1,2,4,5-tetrazine. When a large excess of thiol is used, gold nanoclusters of 2 nm are obtained in a large amount and with a narrow size distribution. The reaction mechanism was investigated by absorption and emission spectroscopies and shows the in situ formation of dihydrotetrazine acting as the reductant of Au(III) to make Au(0). Au nanoclusters were isolated from the molecular precursors by HPLC. The nature of the ligands stabilizing Au nanoclusters was investigated by various techniques such as mass spectrometry, SEM-EDS, XPS and NMR. Thiol and tetrazine are shown to play both the role of ligand stabilizing the clusters. Finally, when a much smaller amount of thiol is used, a mixture of Au nanoclusters and Au nanoparticles of 10–15 nm, sometimes aggregated into clusters of 50 nm is obtained. The formation of larger nanoobjects is explained by the lower amount of thiol available to block the growth at the early stage as shown by UV-vis absorption monitoring.
Introduction
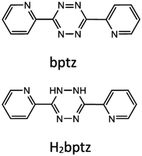
Gold nanoparticles (NP) have attracted the interest of the scientific community for a long time now due to their peculiar optical properties1 which offer a large panel of applications in biotechnology,2 medicine,3 sensing,4 catalysis5 among others. Their synthesis is known since the pioneering work of Faraday in the 19th century and made possible at large scale using mainly either Turkevich6 (in water) or Brust-Schiffrin7 (in organic solvent) protocols. Based on the work of Brust, it appears that slight adjustments in the protocols, in particular increasing the ligand vs. gold ratio, led to the synthesis of ultra-small nanoparticles called metal protected clusters (MPC),8 usually coated with thiolates. This further step allowed researchers to play at the boundary between nano-objects behaving like large molecules with defined size and mass and those with quantum size properties like plasmon resonance. It is now acknowledged that this boundary lies in terms of particle size near 2 nm diameter: below is the field of nanoclusters with molecular-type properties whereas above is the domain of nanoparticles.9 One of the difficulties to overcome in the synthesis of nanoclusters is polydispersity,10 which sometimes requires additional steps of fractionation to get well defined sizes. Murray et al. demonstrated two decades ago the possibility to get directly well-defined sizes down to 1.8 nm using dodecanethiol.11 One-pot syntheses of gold nanoclusters (NC) of various sizes have been the subject of many publications since then, due to the easiness of their use. Two kinds of processes have emerged, a bottom-up starting from gold salts or gold complexes and a top-down consisting in etching nanoparticles by addition of an excess of ligands or by phase transfer.12 Most of these syntheses rely on the use of mild reductants like citrate, ascorbate,13 hydrazine hydrate,14 borohydride15,16 among others, added to the solution of gold salt with a surfactant (alkanethiols,17–19 phosphines,20 BSA,21 DNA,22 …) to stabilize the nano-objects formed. In some cases, the same moiety can act both as the surfactant and the reducing agent.Another strategy of interest consists in generating the reductant in situ. This has the advantage of starting with very stable products, totally non-sensitive to the presence of residual oxygen in the solution and thus limits side-reactions leading to a narrower size distribution of the final nano-objects. The method presented in this paper uses an in situ prepared reductant, namely a dihydrotetrazine derivative, obtained from the reduction of the parent tetrazine by dodecanethiol (DDT). This method is inspired from the work of Biswas et al. who demonstrated for the first time the possibility of using a dihydrotetrazine as the reductant of a metallic salt to make metallic nanoparticles, but with a large size distribution around an average diameter of 12 nm.23 In addition, the same author showed that 3,6-dipyridin-2-yl-1,2,4,5-tetrazine (bptz, see Scheme 1) was able to oxidize alkanethiols into disulfide.24 Based on these results, we propose a new one-pot synthesis of gold nanoparticles by mixing a gold salt (chloroauric acid), an alkanethiol (DDT) and 3,6-di(pyridyn-2-yl)-1,2,4,5-tetrazine (bptz) in ethanol, leading to Au nanoclusters(NCs) or nanoparticles(NPs) according to the proportions. Besides, bptz is a well-known reagent for cycloaddition through inverse demand Diels–Alder reaction25,26 and a couple of examples highlight this role to functionalize nanoparticles.27,28 Thus its use in synthesizing and possibly capping gold nanoparticles opens the way to post-grafting on carbonaceous materials like carbon nanotubes29 or graphene. Prior to that, we need to elucidate precisely the mechanism of the nano-object formation and the role played by each component, which is the topic of the present investigation.
Results and discussion
Our investigation is divided in two sections, since two kinds of nano-objects are obtained according to the experimental conditions.A. Gold nanoclusters
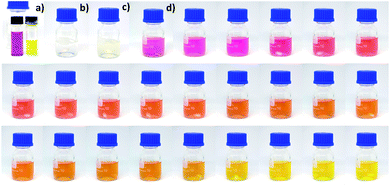
The reaction can be followed directly from the color changes. The initial solution was pink due to the tetrazine color and gradually changed to orange and finally yellow (Fig. 1). In absence of gold salt, no color change was visible during the first two hours. However, when the reaction mixture was kept for a longer time (typically overnight), a pale yellow color can be observed at the end (Fig. S1†). These results are consistent with the possible reduction of the tetrazine by the thiol, responsible for the color changes.
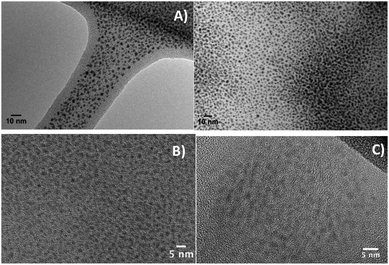
Gold NCs can be seen on TEM images taken on the final solution (Fig. 2A) without any purification. Many nano-objects with average diameter close to 2 nm can be seen in this sample. Other snapshots showing other areas can also be seen in Fig. S2† and confirm that a polydispersity in sizes and shapes does exist in this crude sample. The presence of Au NCs is strongly dependent on the proportions of reactants in the initial mixture, as shown in Fig. S3† where NCs are visible but mixed with large nanoparticles resulting from the aggregation of smaller ones. This point will be discussed in more details later on (Section B).
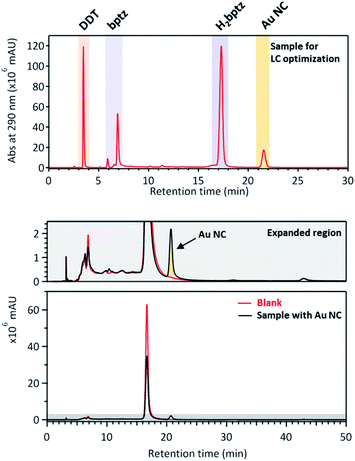
Centrifugation was performed to get rid of the large aggregated particles. After centrifugation, HRTEM pictures were taken confirming that NCs are still present in the supernatant with a rather narrow diameter range centered around 2 nm (Fig. 2B). Further purification was achieved by HPLC (see Section A.6 for details) and the purified clusters can be seen in Fig. 2C albeit in smaller amount than previously.
TEM images show that Au NCs are directly obtained in a one pot synthesis by simply mixing the gold salt, thiol and tetrazine in adequate proportions. In absence of bptz, the mixture DDT + HAuCl4 does not lead to nanoclusters but to spherical nanoparticles with a diameter close to 20 nm (Fig. 3).
 | ||
| Fig. 3 TEM pictures at different magnifications of Au NPs obtained from the mixture of DDT and HAuCl4 in ethanol, in absence of bptz. | ||
SEM-EDS (Energy Dispersive Spectroscopy) was also performed on silicon substrates coated with nanoclusters after an additional washing of the precipitate in acetone to remove most of the unreacted thiols (see ESI for experimental details†). The results are shown in Fig. S4† for two different zones and demonstrate the simultaneous presence of Au, S and N elements, with atomic percentages of respectively 3.1, 26.4 and 27.6% for area 1 and 8.1, 23.4 and 14.4% for area 2. This suggests that both the thiol and the tetrazine may take part to the gold nanocluster stabilization but does not constitute a clear evidence as a direct characterization of the gold clusters would be.
To investigate further the reaction mechanism and in particular the precise role of bptz in the formation of nanoclusters, a monitoring by spectrophotometry was then undertaken.
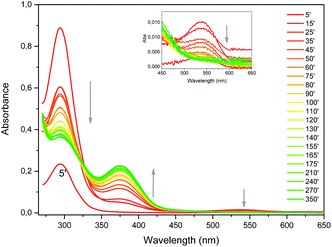 | ||
| Fig. 4 UV-vis absorption spectra evolution upon synthesis of Au NCs (reaction time in minutes). Inset shows the magnification of the high wavelength region. | ||
The reaction kinetics can be investigated by UV-vis absorption as well (Fig. S6†). Beyond 15 minutes, the absorbance variation is very similar at 294 and 540 nm. These absorbance values decrease until approximately 120 minutes. This shows that bptz is gradually consumed upon time by the remaining DDT. The absorbance at 375 nm increases symmetrically on this time interval. We can thus conclude that the formation of Au NCs occurs mainly in the first ten minutes, because during this period the amount of bptz is supposed to remain nearly constant.
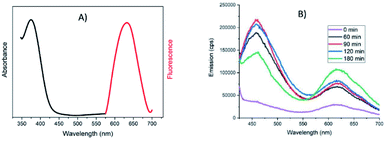
Contrarily to Au NPs, which can be easily characterized using UV-Vis absorption through their plasmon resonance bands, Au NCs do not exhibit any absorption in the visible and in UV the absorption of thiols and H2bptz are likely to overlap the one of Au NCs. Therefore, we moved to emission spectroscopy measurements to characterize them. Fig. 5 displays the emission and excitation spectra of the final NC solution as well as the evolution of emission spectra with time during the synthesis.
Indeed, it has been already reported that Au NCs can be characterized by their emission properties upon irradiation in the UV interband.31 An emission centered at 630 nm can be seen in our case (Fig. 5A) that appears since the initial mixture and increases slightly upon time (Fig. 5B). This red emission was already observed for various Au nanoclusters especially when stabilized by thiolates.32,33 The excitation spectrum associated with this red emission actually comes from the band centered at 375 nm (see Fig. 5A), confirming the contribution of gold in this emission band. Moreover, in absence of gold, no emission was observed in that range (Fig. S7A†). Another band centered at 460 nm is also visible in the emission spectra of Au NCs (and absent as well without gold salt addition) but this one does not grow linearly with time. It is likely that aggregation processes may occur between individual NCs that might be at the origin of this significantly shorter wavelength emission, as it is reported that increasing the gold core size shifts the emission to higher energy values.34
The emission spectra of NCs can also be used to check the ability of various solvents to extract the Au NCs from the precipitate after centrifugation, to avoid too much loss in the purification process. Among the solvents tested (chloroform, propanol, THF, toluene), chloroform seems to be the best for the extraction of Au NCs based on the intensity of the emission band at 630 nm (Fig. S7B†). As the stabilization of Au NCs by DDT ligands should decrease the polarity of these nano-objects, a less polar medium than the initial one is better suited for extraction, but the results show that the more apolar solvent (toluene) is not the best choice.
Based on these spectroscopic data, the following mechanism for Au NCs synthesis can be proposed (Scheme 2).
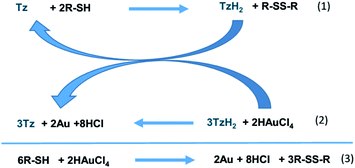 | ||
| Scheme 2 Mechanism of Au NC formation starting from tetrazine (Tz) and alkanethiol (R-SH) and global outcome. | ||
It was already reported that thiols can reduce bptz into H2bptz and disulfide.24 Therefore, it seems reasonable that the first step of the mechanism involves the reduction of bptz by DDT producing H2bptz according to eqn (1). Then bptzH2 can reduce Au(III) into Au(0) restoring bptz (eqn (2)). When DDT is in large excess, once Au(III) is totally consumed, the remaining thiol slowly reduces bptz into H2bptz and disulfide, so that at the end all the tetrazine has been consumed by the first step. In that case, the outcome can be written according to eqn (3). Furthermore, part of the thiol in excess is used to stop the Au(0) growth at early stage leading to Au NCs.
Based on the postulated mechanism in Scheme 2, it should be possible to obtain Au(0) by the direct reduction of Au(III) by thiols in ethanol in absence of Tz. This is actually the case and evidenced by emission spectroscopy (see Fig. S8†). Indeed, a similar trend in the emission intensity recorded at 630 nm under UV excitation is observed for the binary Au(III)–DDT mixture compared to the ternary Au(III)–DDT–bptz mixture, while all other compositions do not give any significant emission and in all cases this residual emission remains constant. However, the final state is different, since mainly nanoparticles of 20 nm diameter can be seen when the reaction is conducted in absence of bptz (Fig. 3). Thus it can be deduced that bptz plays a critical role in the formation of NCs.
| Element | Peak bond energy/eV | Atomic% |
|---|---|---|
| Au 4f | 83.98 | 5.05 |
| C 1s | 284.43 | 85.32 |
| N 1s | 399.27 | 0.46 |
| O 1s | 532.03 | 3.78 |
| S 2p | 162.51 | 5.39 |
| Si 2p | 98.96 | 0 |
The Au(4f) signal shows two characteristic peaks as expected for Au NCs,35 corresponding to (4f5/2) for the high energy one and (4f7/2) for the low energy one. The Au(4f7/2) signal peaking at 83.98 eV corresponds to an energy very close to that of metallic gold (83.9 eV) as it is usually the case in Au NCs.35 The sulphur signal at 162.5 eV and the carbon signal at 284.4 eV are perfectly in the range expected for alkyl thiolates.36 All these data confirm the presence of Au NCs stabilized by dodecanethiolates.
The main unexpected result is the very low amount of nitrogen in the composition of clusters derived from XPS. This seems in contradiction with the results of SEM-EDS (see Fig. S4† and discussion above) showing the simultaneous presence of Au, S and N in the same area. This can be nevertheless rationalized by the fact that tetrazines can be easily sublimated30,37 and are thus likely to be removed under the high vacuum conditions required for XPS analysis.
A first HPLC analytical isolation was conducted by using a Phenomenex Luna C-12 column with an isocratic flow of methanol and water (80![[thin space (1/6-em)]](https://www.rsc.org/images/entities/char_2009.gif) :
:![[thin space (1/6-em)]](https://www.rsc.org/images/entities/char_2009.gif) 20, 1 mL min−1). The filtered mother solution was concentrated at room temperature under vacuum before injection; only ethanol was removed. In this case, the analytical HPLC was used as preparative HPLC using an injection loop of 5 μL to collect the different fractions in order to limit the influence of the co-elution of DDT and obtain the maximum of peak intensity at 290 nm. Each sample was analyzed under a pressure of 100 to 110 bar (more detailed conditions in ESI†).
20, 1 mL min−1). The filtered mother solution was concentrated at room temperature under vacuum before injection; only ethanol was removed. In this case, the analytical HPLC was used as preparative HPLC using an injection loop of 5 μL to collect the different fractions in order to limit the influence of the co-elution of DDT and obtain the maximum of peak intensity at 290 nm. Each sample was analyzed under a pressure of 100 to 110 bar (more detailed conditions in ESI†).
The results are displayed in Fig. 7 and S10.† First it can be seen that bptz and DDT actually react together from the disappearance of the peak at a retention time (tR) ≈3.5 minutes in the mixture and the appearance of a new peak at tR = 4.4 min (Fig. S10†). This latter is also visible for the ternary mixture, along with another small one just behind. A small peak at 3.2 minutes can also be seen in the ternary mixture that corresponds to the one observed in the sample containing DDT only. This result is consistent with the fact that the thiol is in large excess and is supposed to remain in the final mixture once the reaction is over.
In order to optimize the peak separation, a second optimization was performed using a Phenomenex Luna C-18 column with analytical HPLC equipped with an injection loop of 20 μL and an isocratic flow of MeOH![[thin space (1/6-em)]](https://www.rsc.org/images/entities/char_2009.gif) :
:![[thin space (1/6-em)]](https://www.rsc.org/images/entities/char_2009.gif) H2O mixture with a ratio of 50
H2O mixture with a ratio of 50![[thin space (1/6-em)]](https://www.rsc.org/images/entities/char_2009.gif) :
:![[thin space (1/6-em)]](https://www.rsc.org/images/entities/char_2009.gif) 50 to get a pressure of 100–110 bar during the separation process. The comparison of the chromatogram in Fig. 7 with the one of Fig. S10† shows that the peak order is similar as with the previous conditions, and that the AuNCs peak appears after the one of H2bpTz, at tR ≈ 21 min. Due to the low concentration of obtained clusters in this solvent, the fraction corresponding to isolated AuNCs obtained at tR ≈ 21 min is colorless. As shown in Fig. 7, the comparison of the Au NC sample with another one without gold unambiguously confirms the assignment of the 21st minute peak to the Au NCs.
50 to get a pressure of 100–110 bar during the separation process. The comparison of the chromatogram in Fig. 7 with the one of Fig. S10† shows that the peak order is similar as with the previous conditions, and that the AuNCs peak appears after the one of H2bpTz, at tR ≈ 21 min. Due to the low concentration of obtained clusters in this solvent, the fraction corresponding to isolated AuNCs obtained at tR ≈ 21 min is colorless. As shown in Fig. 7, the comparison of the Au NC sample with another one without gold unambiguously confirms the assignment of the 21st minute peak to the Au NCs.
To collect enough amounts for further characterizations such as for HRTEM, the method was then transposed on a semi-preparative HPLC. The collection was realized at 20 °C, with a 200 μL injection loop, a Phenomenex Luna C-18 (250 × 10 mm, 5 μm, 100 Å), with an isocratic flow of EtOH![[thin space (1/6-em)]](https://www.rsc.org/images/entities/char_2009.gif) :
:![[thin space (1/6-em)]](https://www.rsc.org/images/entities/char_2009.gif) H2O (40
H2O (40![[thin space (1/6-em)]](https://www.rsc.org/images/entities/char_2009.gif) :
:![[thin space (1/6-em)]](https://www.rsc.org/images/entities/char_2009.gif) 60, 3 mL min−1). In such conditions (Fig. S11†), the final isolated clusters were collected for a tR ≈ 20 to 22 minutes at 190 nm. Au NCs are actually present in this fraction as they can be directly seen in the HRTEM snapshots of Fig. 2C.
60, 3 mL min−1). In such conditions (Fig. S11†), the final isolated clusters were collected for a tR ≈ 20 to 22 minutes at 190 nm. Au NCs are actually present in this fraction as they can be directly seen in the HRTEM snapshots of Fig. 2C.
Fig. 8 shows the high chemical field region of 1H and 13C NMR spectra recorded for bptz, the bptz + DDT mixture (thus involving H2bptz) and the Au NC fraction isolated from HPLC. All these spectra clearly display the signals assigned to the 4 pyridine hydrogen atoms (colored dots), but at different chemical shifts. Hydrogen resonances are shifted upfield from bptz to the binary mixture H2bptz, in agreement with the presence of the hydrogen on the dihydrotetrazine ring, which should attract the electron density of the pyridine nitrogen.
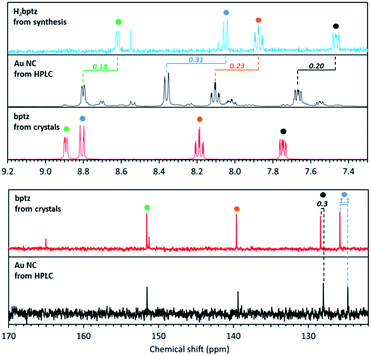 | ||
| Fig. 8 1H (top) and 13C (bottom) NMR spectra in MeOD of Au NCs isolated from HPLC (black line), bptz + DDT mixture leading to H2bptz (blue line) and bptz from crystal (red line). | ||
Interestingly, these four characteristic signals are also clearly identified in the NC 1H spectra (Fig. S12†), while ungrafted tetrazine is supposed to have been removed upon HPLC separation. Fig. S12† shows the entire spectrum as well, with the characteristic resonance peaks assigned to the hydrogen atoms of the DDT alkyl chain in the 0.5–3 ppm range. A shift of the chemical shift values of the methylene protons can be observed between the Au NC sample and the one without Au, due to the participation of the DDT ligand in the stabilization of Au, while the terminal methyl remains unaffected.
Fig. S13† shows the 13C resonance peaks due to tetrazine and thiol, which demonstrates that Au NCs are stabilized by both ligands although tetrazine signals were not observed in MS or in XPS. When comparing the chemical shifts of 1H and 13C spectra, an upfield effect is also observed between bptz and NCs. A possible explanation is the interaction between N and Au in the NCs leading to the same trend in the resonance positions of the hydrogens of the pyridine ring, but with a weaker effect (−0.10 vs. −0.30 ppm on average, see Table S1†), Au being less electropositive than H.
We can thus conclude definitively that DDT and bptz play both the role of ligand of Au nanoclusters.
B. Au nanoparticles
| Sample | bptz![[thin space (1/6-em)]](https://www.rsc.org/images/entities/char_2009.gif) : :![[thin space (1/6-em)]](https://www.rsc.org/images/entities/char_2009.gif) Au Au![[thin space (1/6-em)]](https://www.rsc.org/images/entities/char_2009.gif) : :![[thin space (1/6-em)]](https://www.rsc.org/images/entities/char_2009.gif) DDT DDT |
|---|---|
a For comparison, the bptz![[thin space (1/6-em)]](https://www.rsc.org/images/entities/char_2009.gif) : :![[thin space (1/6-em)]](https://www.rsc.org/images/entities/char_2009.gif) Au Au![[thin space (1/6-em)]](https://www.rsc.org/images/entities/char_2009.gif) : :![[thin space (1/6-em)]](https://www.rsc.org/images/entities/char_2009.gif) DDT ratio is 1 DDT ratio is 1![[thin space (1/6-em)]](https://www.rsc.org/images/entities/char_2009.gif) : :![[thin space (1/6-em)]](https://www.rsc.org/images/entities/char_2009.gif) 0.2 0.2![[thin space (1/6-em)]](https://www.rsc.org/images/entities/char_2009.gif) : :![[thin space (1/6-em)]](https://www.rsc.org/images/entities/char_2009.gif) 500 for the NCs synthesized in Section A. 500 for the NCs synthesized in Section A. |
|
| 1 | 1![[thin space (1/6-em)]](https://www.rsc.org/images/entities/char_2009.gif) : :![[thin space (1/6-em)]](https://www.rsc.org/images/entities/char_2009.gif) 0.5 0.5![[thin space (1/6-em)]](https://www.rsc.org/images/entities/char_2009.gif) : :![[thin space (1/6-em)]](https://www.rsc.org/images/entities/char_2009.gif) 25 25 |
| 2 | 1![[thin space (1/6-em)]](https://www.rsc.org/images/entities/char_2009.gif) : :![[thin space (1/6-em)]](https://www.rsc.org/images/entities/char_2009.gif) 2 2![[thin space (1/6-em)]](https://www.rsc.org/images/entities/char_2009.gif) : :![[thin space (1/6-em)]](https://www.rsc.org/images/entities/char_2009.gif) 2 2 |
| 3 | 1![[thin space (1/6-em)]](https://www.rsc.org/images/entities/char_2009.gif) : :![[thin space (1/6-em)]](https://www.rsc.org/images/entities/char_2009.gif) 1 1![[thin space (1/6-em)]](https://www.rsc.org/images/entities/char_2009.gif) : :![[thin space (1/6-em)]](https://www.rsc.org/images/entities/char_2009.gif) 2 2 |
| 4 | 1![[thin space (1/6-em)]](https://www.rsc.org/images/entities/char_2009.gif) : :![[thin space (1/6-em)]](https://www.rsc.org/images/entities/char_2009.gif) 0.25 0.25![[thin space (1/6-em)]](https://www.rsc.org/images/entities/char_2009.gif) : :![[thin space (1/6-em)]](https://www.rsc.org/images/entities/char_2009.gif) 2 2 |
| 5 | 1![[thin space (1/6-em)]](https://www.rsc.org/images/entities/char_2009.gif) : :![[thin space (1/6-em)]](https://www.rsc.org/images/entities/char_2009.gif) 0.25 0.25![[thin space (1/6-em)]](https://www.rsc.org/images/entities/char_2009.gif) : :![[thin space (1/6-em)]](https://www.rsc.org/images/entities/char_2009.gif) 25 25 |
![[thin space (1/6-em)]](https://www.rsc.org/images/entities/char_2009.gif) :
:![[thin space (1/6-em)]](https://www.rsc.org/images/entities/char_2009.gif) S ratio making the amount of unreacted thiol not enough to stabilize clusters just after the nucleation step and the growth step is not blocked anymore. These nanodendritic assemblies of nanoparticles might be of interest for applications requiring high developed areas like catalysis.
S ratio making the amount of unreacted thiol not enough to stabilize clusters just after the nucleation step and the growth step is not blocked anymore. These nanodendritic assemblies of nanoparticles might be of interest for applications requiring high developed areas like catalysis.
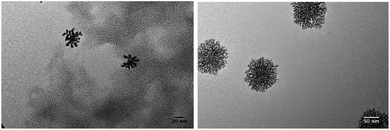 | ||
| Fig. 9 TEM pictures of Au NPs synthesized for sample 2 (see Table 1). | ||
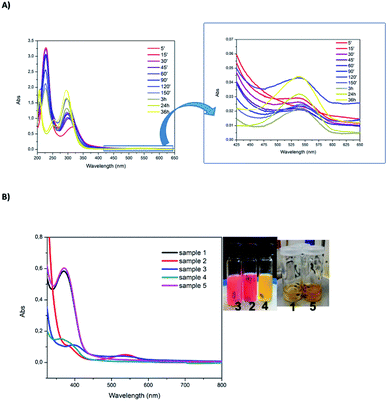 | ||
Fig. 10 (A) UV-vis absorption monitoring of the reaction with the following proportions of reactants: Au![[thin space (1/6-em)]](https://www.rsc.org/images/entities/char_2009.gif) : :![[thin space (1/6-em)]](https://www.rsc.org/images/entities/char_2009.gif) bptz bptz![[thin space (1/6-em)]](https://www.rsc.org/images/entities/char_2009.gif) : :![[thin space (1/6-em)]](https://www.rsc.org/images/entities/char_2009.gif) DDT 1 DDT 1![[thin space (1/6-em)]](https://www.rsc.org/images/entities/char_2009.gif) : :![[thin space (1/6-em)]](https://www.rsc.org/images/entities/char_2009.gif) 1 1![[thin space (1/6-em)]](https://www.rsc.org/images/entities/char_2009.gif) : :![[thin space (1/6-em)]](https://www.rsc.org/images/entities/char_2009.gif) 2 (sample 2 in Table 1). Times in minutes. (B) UV-vis absorption spectra after 5 minutes of reaction and pictures at end of the reaction for the five samples (see Table 1 for the proportions corresponding to each sample). 2 (sample 2 in Table 1). Times in minutes. (B) UV-vis absorption spectra after 5 minutes of reaction and pictures at end of the reaction for the five samples (see Table 1 for the proportions corresponding to each sample). | ||
Changing the proportions of Au vs. DDT allows moving from Au NCs to Au NPs and this can be directly seen in UV-vis absorption spectra (Fig. 10B). The main difference is the presence of a plasmon resonance band at 540 nm when Au NPs are produced (samples 2 and 3) while no absorption band in the visible range can be seen for Au NCs (samples 1, 4 and 5). Therefore, the solution color moves from light yellow for Au NCs to reddish for Au NP. Moreover, the band located at 380 nm is also indicative of Au NCs as noticed previously (although mixed with the absorption of H2bptz). Samples 1 and 5 display the largest intensity at that wavelength, while for sample 2 the intensity is the lowest. In sample 4, as the amount of Au is low, the concentration of Au NPs might remain low and the reoxidation of H2bptz by HAuCl4 remains limited, explaining the high absorption in the near UV range. Thus we can conclude that a direct relation exists between the Au![[thin space (1/6-em)]](https://www.rsc.org/images/entities/char_2009.gif) :
:![[thin space (1/6-em)]](https://www.rsc.org/images/entities/char_2009.gif) DDT ratio and the formation of Au NCs vs. Au NP on one hand, and the intensity of the nearest UV band on the other hand which also depends on the bptz:Au ratio.
DDT ratio and the formation of Au NCs vs. Au NP on one hand, and the intensity of the nearest UV band on the other hand which also depends on the bptz:Au ratio.
Conclusions
Gold nanoclusters have been synthesized in a one-pot reaction in ethanol using a reductant generated in situ by the reduction of a tetrazine derivative by a thiol. Well-calibrated clusters with diameters slightly below 2 nm were obtained after centrifugation when a large excess of thiols was used. The tetrazine is necessary to get nanoclusters only since the direct reaction of gold salt with dodecanethiol leads mainly to nanoparticles. Changing the proportions of gold vs. thiol allows one to move from Au nanoclusters to Au nanoparticles that assemble into aggregates of 50 nm diameter. UV-vis spectrophotometry can be used to monitor the reaction and have insight in the mechanism. While the tetrazine is fully consumed when the reaction is over in the case of clusters, the limiting reactant is the thiol in the case of particles. Fluorescence spectroscopy can be used to characterize the nanoclusters by their emission at 630 nm when excited in UV. HPLC allows one to purify the clusters by removing all the unreacted molecular species. Finally, NMR analysis shows that the tetrazine is still present in the fraction containing only the clusters with chemical shifts different from the isolated compound, demonstrating that some tetrazines serve as ligands on the cluster surface. Ongoing investigations now focus on supporting these gold nanoclusters on carbonaceous materials like reduced graphene oxide to design new nanomaterials active in heterogeneous catalysis.Conflicts of interest
There are no conflicts to declare.Acknowledgements
Y. B. Rus acknowledges the Indonesia Endowment Fund for Education (LPDP) scholarship for funding his thesis. P. Decorse (ITODYS, Université de Paris) is acknowledged for XPS spectra.Notes and references
- V. A. Ogarev, V. M. Rudoi and O. V. Dement'eva, Inorg. Mater. Appl. Res., 2018, 9, 134–140 CrossRef.
- Y.-C. Yeh, B. Creran and V. M. Rotello, Nanoscale, 2012, 4, 1871–1880 RSC.
- E. Boisselier and D. Astruc, Chem. Soc. Rev., 2009, 38, 1759–1782 RSC.
- K. Saha, S. S. Agasti, C. Kim, X. Li and V. M. Rotello, Chem. Rev., 2012, 112, 2739–2779 CrossRef CAS PubMed.
- A. Corma and H. Garcia, Chem. Soc. Rev., 2008, 37, 2096–2126 RSC.
- J. Turkevich, Discuss. Faraday Soc., 1951, 11, 55 RSC.
- M. Brust, M. Walker, D. Bethell, D. J. Schiffrin and R. Whyman, J. Chem. Soc., Chem. Commun., 1994, 801–802 RSC.
- R. H. Terrill, T. A. Postlethwaite, C. H. Chen, C. D. Poon, A. Terzis, A. D. Chen, J. E. Hutchison, M. R. Clark, G. Wignall, J. D. Londono, R. Superfine, M. Falvo, C. S. Johnson, E. T. Samulski and R. W. Murray, J. Am. Chem. Soc., 1995, 117, 12537–12548 CrossRef CAS.
- R. C. Jin, Nanoscale, 2010, 2, 343–362 RSC.
- Y. Lu and W. Chen, in Gold Clusters, Colloids and Nanoparticles I, ed. D. M. P. Mingos, Springer International Publishing, Cham, 2014, pp. 117–153, DOI:10.1007/430_2013_126.
- M. J. Hostetler, J. E. Wingate, C. J. Zhong, J. E. Harris, R. W. Vachet, M. R. Clark, J. D. Londono, S. J. Green, J. J. Stokes, G. D. Wignall, G. L. Glish, M. D. Porter, N. D. Evans and R. W. Murray, Langmuir, 1998, 14, 17–30 CrossRef CAS.
- X. C. Qu, Y. C. Li, L. Li, Y. R. Wang, J. N. Liang and J. M. Liang, J. Nanomater., 2015, 784097 Search PubMed.
- Y. Bao, C. Zhong, D. M. Vu, J. P. Temirov, R. B. Dyer and J. S. Martinez, J. Phys. Chem. C, 2007, 111, 12194–12198 CrossRef CAS.
- J. Lin, Z. Zhou, Z. Li, C. Zhang, X. Wang, K. Wang, G. Gao, P. Huang and D. Cui, Nanoscale Res. Lett., 2013, 8, 170 CrossRef PubMed.
- Z. Wu, J. Suhan and R. C. Jin, J. Mater. Chem., 2009, 19, 622–626 RSC.
- T. Huang, L. Huang, Y. Jiang, F. C. Hu, Z. H. Sun, G. Q. Pan and S. Q. Wei, Dalton Trans., 2017, 46, 12239–12244 RSC.
- N. K. Pal and C. Kryschi, J. Nanopart. Res., 2015, 17, 226 CrossRef.
- N. K. Pal and C. Kryschi, Phys. Chem. Chem. Phys., 2015, 17, 21423–21431 RSC.
- N. K. Chaki, P. Singh, C. V. Dharmadhikari and K. P. Vijayamohanan, Langmuir, 2004, 20, 10208–10217 CrossRef CAS PubMed.
- W. W. Weare, S. M. Reed, M. G. Warner and J. E. Hutchison, J. Am. Chem. Soc., 2000, 122, 12890–12891 CrossRef CAS.
- J. Lin, Z. J. Zhou, Z. M. Li, C. L. Zhang, X. S. Wang, K. Wang, G. Gao, P. Huang and D. X. Cui, Nanoscale Res. Lett., 2013, 8, 170 CrossRef.
- R. Zhou, M. Shi, X. Chen, M. Wang and H. Chen, Chem.–Eur. J., 2009, 15, 4944–4951 CrossRef CAS.
- S. Samanta, S. Das and P. Biswas, Sens. Actuators, B, 2014, 202, 23–30 CrossRef CAS.
- S. Samanta, S. Ray, A. B. Ghosh and P. Biswas, RSC Adv., 2016, 6, 39356–39363 RSC.
- M. L. Blackman, M. Royzen and J. M. Fox, J. Am. Chem. Soc., 2008, 130, 13518–13519 CrossRef CAS.
- Y. Li, F. Miomandre, G. Clavier, L. Galmiche, V. Alain-Rizzo and P. Audebert, ChemElectroChem, 2017, 4, 430–435 CrossRef CAS.
- K. Neumann, S. Jain, J. Geng and M. Bradley, Chem. Commun., 2016, 52, 11223–11226 RSC.
- R. Aufaure, J. Hardouin, N. Millot, L. Motte, Y. Lalatonne and E. Guenin, Chem.–Eur. J., 2016, 22, 16022–16027 CrossRef CAS.
- J. Zhu, J. Hiltz, R. B. Lennox and R. Schirrmacher, Chem. Commun., 2013, 49, 10275–10277 RSC.
- G. Clavier and P. Audebert, Chem. Rev., 2010, 110, 3299–3314 CrossRef CAS PubMed.
- L.-Y. Chen, C.-W. Wang, Z. Yuan and H.-T. Chang, Anal. Chem., 2015, 87, 216–229 CrossRef CAS PubMed.
- J. Xie, Y. Zheng and J. Y. Ying, J. Am. Chem. Soc., 2009, 131, 888 CrossRef CAS PubMed.
- L. Jin, Y. Fang, L. Shang, Y. Liu, J. Li, L. Wang, P. Hu and S. Dong, Chem. Commun., 2013, 49, 243–245 RSC.
- T.-Q. Yang, B. Peng, B.-Q. Shan, Y.-X. Zong, J.-G. Jiang, P. Wu and K. Zhang, Nanomaterials, 2020, 10, 261 CrossRef CAS PubMed.
- P. Zhang, J. Phys. Chem. C, 2014, 118, 25291–25299 CrossRef CAS.
- S. Ge, J. Zhao and G. Ma, Inorg. Chem. Commun., 2019, 109, 107556 CrossRef CAS.
- D. Wang, W. Chen, Y. Zheng, C. Dai, L. Wang and B. Wang, Heterocycl. Commun., 2013, 19, 171–177 CAS.
Footnote |
| † Electronic supplementary information (ESI) available. See DOI: 10.1039/d0ra10961d |
| This journal is © The Royal Society of Chemistry 2021 |

