 Open Access Article
Creative Commons Attribution 3.0 Unported Licence
Blue organic light-emitting diodes with hybridized local and charge-transfer excited state realizing high external quantum efficiency†
Jayaraman Jayabharathi *,
Shanmugam Thilagavathy and
Venugopal Thanikachalam
Department of Chemistry, Annamalai University, Annamalai nagar, Tamilnadu 608 002, India. E-mail: jtchalam2005@yahoo.co.in
First published on 24th February 2021
Abstract
Donor–spacer–acceptor (D–π–A) materials CAPI and CCAPI, with hybridized local and charge transfer (HLCT) emissive states, have been synthesized. The twisting D–π–A architecture promotes the partial separation of HOMO and LUMO, leading to an enhanced % CT component, and the anthracene moiety in CAPI and CCAPI increases the conjugation length, leading to an enhanced % LE component. The non-doped device with CCAPIb shows the blue emission (450 nm) with maximum current efficiency (ηc), power efficiency (ηp), and external quantum efficiency (ηex) of 16.83 cd A−1, 15.32 lm W−1, and 12.0%, respectively, as well as exciton utilization efficiency (EUE) of 95% with a luminance of 32![[thin space (1/6-em)]](https://www.rsc.org/images/entities/char_2009.gif) 546 cd m−2 and a roll-off efficiency of 0.53%. The new design strategy has great potential for developing high-performance blue electroluminescent materials.
546 cd m−2 and a roll-off efficiency of 0.53%. The new design strategy has great potential for developing high-performance blue electroluminescent materials.
1 Introduction
Organic light-emitting diodes (OLEDs) have attracted immense attention in flat-panel displays due to their high efficiency, brightness, wide viewing angle, flexibility and low cost.1–4 Efficient pure blue OLEDs have gained both academic and industrial attention due to their short lifetimes, wide bandgaps and low efficiency as compared to their counterparts.5 Blue emitters generate high charge injection barriers, leading to unbalanced charge injection and transportation due to a wide bandgap.6 Blue PhOLEDs with Ir, Pt and Os complexes exhibit 100% internal quantum efficiency (IQE), however, phosphorescent materials require dispersion in suitable host materials with large bandgaps to reduce the quenching of long-lived triplet excitons.7 The phase-separation in host–guest systems diminish device efficiency, and efficient hosts for blue PhOLEDs with high triplet energy also cause complications. Though efficient blue TADF (thermally activated delayed fluorescence) materials have been reported with 100% IQE,6–8 only a few of them fulfill the National Television System Committee (NTSC) standard blue CIE of (0.14, 0.08),9–12 and TADF materials with intramolecular charge-transfer (ICT) show broad emission results in low colour purity.13 Therefore, developing efficient fluorophores is still a great challenge in the field of OLEDs.14–17The non-doped blue devices based on anthracene materials having bulky side chains show high stability and are used as a standard to measure quantum yield (PLQY).15,17,18 These materials exhibit good carrier injection and transport properties for balanced carrier recombination.19,20 Both phosphorescent and TADF materials show efficiency roll-off due to triplet–triplet annihilation (TTA).21,22 Many efficient fluorophores also exhibit efficiency roll-off due to carrier confinement reduction at high current densities with unequal carrier mobility.23–25 Therefore, deep blue materials with balanced ambipolar properties are urgently needed to reduce efficiency roll-off. Bipolar imidazole derivatives are not only used as electron transport materials (1,3,5-tris(N-phenylbenzimidazol-2-yl)-benzene (TPBi)), but also used as efficient emissive materials with low-efficiency roll-off.26–36 Apart from fused imidazole-based emissive materials, pyrene-substituted imidazole blue emitters show excellent efficiency.37,38 Similar to the TADF mechanism, the CT excited-state component in the HLCT excited-state facilitates the reverse intersystem crossing (RISC) process by small ΔEST, leading to high external utilization efficiency (EUE). In contrast to TADF emitters, HLCT emitters exhibit higher efficiency with short excited lifetime. In some blue emissive weakly coupled HLCT materials, the emissive excited state possesses a pure locally excited (LE) state rather than a CT excited state and it is advantageous for blue-shifted emission with high efficiency.39,40
Herein, we report blue HLCT materials, namely, 2-(4-(10-(9H-carbazol-9-yl) anthracen-9-yl)phenyl)-1-(naphthalen-1-yl)-1H-phenanthro[9,10-d]imidazole (CAPI) and 4-(2-(4-(10-(9H-carbazol-9-yl)anthracen-9-yl)phenyl)-1H-phenanthro[9,10-d]imidazol-1-yl) naphthalene-1-carbonitrile (CCAPI), consisting of carbazole as the donor and phenanthroimidazole as the acceptor with anthracene spacers. The anthracene moiety increases the conjugation length, leading to an enhanced % LE component, and these materials show excellent performances with small efficiency roll-off. The analyses of single-carrier devices revealed that these compounds have good bipolar carrier transport characteristics and non-doped blue devices with CCAPI as the emitting layer showed maximum external quantum efficiency (EQE) of 10.5% and exciton utilisation efficiency (EUE) of 83%. The small energy splitting (ΔEST ≈ 0) promotes the RISC process, and the dark triplet excitons are effectively converted into singlet excitons and enhance the efficiency.
2 Experimental section
2.1. Synthesis of emissive materials
The chemicals used in the experimental section were obtained from Sigma-Aldrich. The synthetic routes of the emissive materials are outlined in Scheme S1.†2.2. Synthesis of dioxaboranylphenylphenanthroimidazoles (PPIB/CNPPIB)
A mixture of BrPPI (PPIB)/CNBrPPI (CNPPIB) (6.53 mmol), bis(pinacolato)diboron (7.84 mmol), Pd(dppf)Cl2 (0.13 mmol) and KOAc (19.60 mmol) in 1,4-dioxane (30 ml) was refluxed for 48 h (N2 stream; 90 °C). The resulting solution was extracted with dichloromethane and the separated solid was purified by column chromatography to obtain a light yellow powder.2.3. Synthesis of bromoanthracenylphenanthroimidazoles (BrPIAN/BrCNPIAN)
A mixture of PPIB (BrPIAN)/CNPPIB (BrCNPIAN) (5.35 mmol) and 9,10-dibromoanthracene (4.46 mmol) was refluxed with K2CO3 (6.51 mmol) and Pd(PPh3)4 (0.130 mmol) in tetrahydrofuran![[thin space (1/6-em)]](https://www.rsc.org/images/entities/char_2009.gif) :
:![[thin space (1/6-em)]](https://www.rsc.org/images/entities/char_2009.gif) water (50
water (50![[thin space (1/6-em)]](https://www.rsc.org/images/entities/char_2009.gif) :
:![[thin space (1/6-em)]](https://www.rsc.org/images/entities/char_2009.gif) 10 ml) at 70 °C (N2 stream; 48 h). The yellow-coloured solution was poured into ethanol and the solid was purified by the conventional method.
10 ml) at 70 °C (N2 stream; 48 h). The yellow-coloured solution was poured into ethanol and the solid was purified by the conventional method.
2.4. Synthesis of emissive materials (CAPI/CCAPI)
The blue emissive materials, CAPI/CCAPI were synthesized through a Suzuki coupling reaction of BrPIAN/BrCNPIAN with carbazole. A solution of BrPIAN (CAPI)/BrCNPIAN (CCAPI) (1.95 mmol), 9H-carbazole (4.29 mmol), Pd(PPh3)4 (0.20 mmol) and aqueous K2CO3 (2 M, 6 ml) in tetrahydrofuran![[thin space (1/6-em)]](https://www.rsc.org/images/entities/char_2009.gif) :
:![[thin space (1/6-em)]](https://www.rsc.org/images/entities/char_2009.gif) water (50
water (50![[thin space (1/6-em)]](https://www.rsc.org/images/entities/char_2009.gif) :
:![[thin space (1/6-em)]](https://www.rsc.org/images/entities/char_2009.gif) 10 ml) was refluxed at 70 °C (48 h; N2 atmosphere). The reaction solution was extracted with dichloromethane and the separated solid was purified by column chromatography.
10 ml) was refluxed at 70 °C (48 h; N2 atmosphere). The reaction solution was extracted with dichloromethane and the separated solid was purified by column chromatography.
3 Results and discussion
The synthetic route for the emissive materials is displayed in Scheme S1.† Efficient blue emitters, namely, 2-(4-(10-(9H-carbazol-9-yl)anthracen-9-yl)phenyl)-1-(naphthalen-1-yl)-1H-phenanthro[9,10-d]imidazole (CAPI) and 4-(2-(4-(10-(9H-carbazol-9-yl)anthracen-9-yl)phenyl)-1H-phenanthro[9,10-d]imidazol-1-yl)naphthalene-1-carbonitrile (CCAPI) were synthesized by a Suzuki-coupling reaction with substantial yield, and the formation of CAPI and CCAPI was confirmed by spectral techniques.3.1. Thermal and electrochemical studies
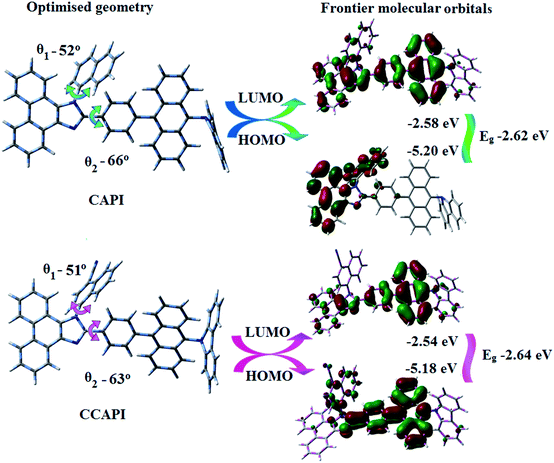
The twisted molecular architecture of CAPI and CCAPI, having a twist angle of ∼52° between the styryl substituent (C2) and the phenanthrimidazole core, effectively suppressed the conjugation and intermolecular π–π stacking (Fig. 1). The twisted molecular architecture increased the thermal stability of CAPI (Tg/Td: 218/500 °C) and CCAPI (Tg/Td: 228/528 °C) (Fig. 2). Because of the C/N-side coupling with bulky substituents, the rigid phenanthroimidazole showed high glass transition temperature and interaction of substituents at C2 with N1 of the phenanthroimidazole core induced more condensed molecular packing. The higher Tg and Td are essential for applications in devices. The morphological stability of these compounds was examined by atomic force microscopy at 30 °C and 90 °C for 12 h (Fig. 2). The root-mean-square [CAPI – 0.28 nm; CCAPI – 0.19 nm] analysis showed the absence of remarkable surface modification before and after annealing, which further supports the suitability of these materials for fabrication. CAPI and CCAPI showed a redox process with an oxidation onset potential (Eonset) of 0.63 V (CAPI) and 0.61 V (CCAPI), which revealed that these bipolar carrier transporting materials are electrochemically stable (Fig. 2). The HOMO = −(Eox vs. Ag/Ag+ − E1/2+ vs. Ag/Ag+ + 4.8) eV/LUMO = −(Ered vs. Ag/Ag+ − E1/2− vs. Ag/Ag+ + 4.8) eV have been calculated as CAPI (−5.20/−2.58 eV) and CCAPI (−5.18/−2.54 eV).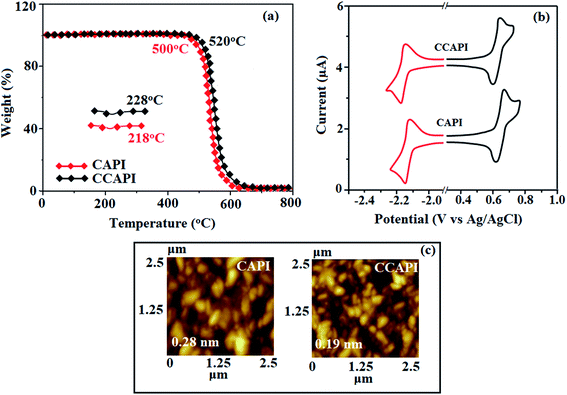 | ||
| Fig. 2 (a) TGA and DSC graphs of CAPI and CCAPI. (b) Cyclic voltammogram and (c) AFM images of CAPI and CCAPI. | ||
3.2. Photophysical studies
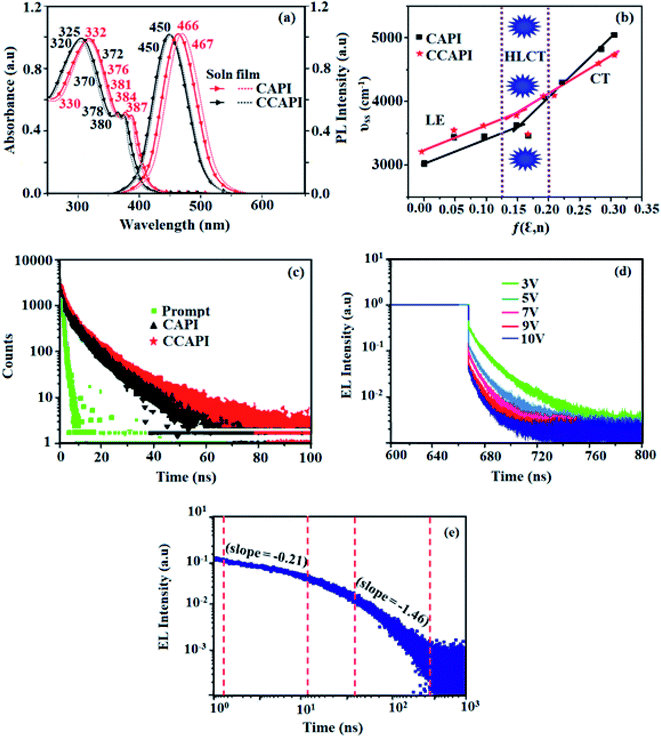
The absorption of emissive materials has been studied with various solvents (Fig. S1, Tables S1 and S2†) and in the film state (Fig. 3 and Table 1). The absorption in the region of 320–332 nm is attributed to the π–π* (LE) transition of phenanthroimidazole and carbazole moieties,41,42 whereas the absorption at around 370 nm is ascribed to the π–π* transition of the anthracene moiety.43 The transition around 380 nm is due to the CT transition [(λab (sol/film): CAPI: 332, 384, 387/330, 376, 381 nm; CCAPI: 325, 372, 380/320, 370, 378 nm]. The high extinction coefficient (εmax) of D–π–A molecule is due to increase of conjugation length and confirm CT transition from donor to acceptor:46,47 [CAPI: 332 nm (εmax – 30120.48 cm−1 M−1), 384 nm (εmax – 26![[thin space (1/6-em)]](https://www.rsc.org/images/entities/char_2009.gif) 041.67 cm−1 M−1); 387 nm (εmax – 25
041.67 cm−1 M−1); 387 nm (εmax – 25![[thin space (1/6-em)]](https://www.rsc.org/images/entities/char_2009.gif) 839.79 cm−1 M−1); CCAPI: 325 nm (εmax −30
839.79 cm−1 M−1); CCAPI: 325 nm (εmax −30![[thin space (1/6-em)]](https://www.rsc.org/images/entities/char_2009.gif) 769.23 cm−1 M−1), 375 nm (εmax – 26
769.23 cm−1 M−1), 375 nm (εmax – 26![[thin space (1/6-em)]](https://www.rsc.org/images/entities/char_2009.gif) 666.67 cm−1 M−1); 380 nm (εmax – 26
666.67 cm−1 M−1); 380 nm (εmax – 26![[thin space (1/6-em)]](https://www.rsc.org/images/entities/char_2009.gif) 315.79 cm−1 M−1)].44,45 The small shift in the film state shows the existence of weak π–π* intermolecular stacking.48 The UV absorption spectra of CAPI and CCAPI changed shape and position with increasing solvent polarity due to small dipole moment changes at the ground state in different solvents (Fig. S1†). The photoluminescence characteristics (λemi (sol/film)) of these compounds were studied in film and various solvents (Fig. S1†) [CAPI: 466/467; CCAPI: 450/450 nm] (Fig. 3 and Table 1). The solvatochromic emission spectra of CAPI and CCAPI from higher polarity solvents were remarkably broad and red-shifted from n-hexane to acetonitrile due to twisting by 9,10-substituted anthracene, and were further supported by natural transition orbitals (Fig. S2 – CAPI and Fig. S3 – CCAPI†).
315.79 cm−1 M−1)].44,45 The small shift in the film state shows the existence of weak π–π* intermolecular stacking.48 The UV absorption spectra of CAPI and CCAPI changed shape and position with increasing solvent polarity due to small dipole moment changes at the ground state in different solvents (Fig. S1†). The photoluminescence characteristics (λemi (sol/film)) of these compounds were studied in film and various solvents (Fig. S1†) [CAPI: 466/467; CCAPI: 450/450 nm] (Fig. 3 and Table 1). The solvatochromic emission spectra of CAPI and CCAPI from higher polarity solvents were remarkably broad and red-shifted from n-hexane to acetonitrile due to twisting by 9,10-substituted anthracene, and were further supported by natural transition orbitals (Fig. S2 – CAPI and Fig. S3 – CCAPI†).
| Emitters | CAPI | CCAPI |
|---|---|---|
| λab (nm) (sol/film) | 332, 384,387/330,376,381 | 325![[thin space (1/6-em)]](https://www.rsc.org/images/entities/char_2009.gif) 372 372![[thin space (1/6-em)]](https://www.rsc.org/images/entities/char_2009.gif) 380/320 380/320![[thin space (1/6-em)]](https://www.rsc.org/images/entities/char_2009.gif) 370 370![[thin space (1/6-em)]](https://www.rsc.org/images/entities/char_2009.gif) 378 378 |
| λem (nm) (sol/film) | 466/467 | 450/450 |
| Tg/Td (°C) | 218/500 | 228/520 |
| ϕ (soln/film) | 80/50 | 88/62 |
| HOMO/LUMO (eV) | −5.20/−2.58 | −5.18/−2.54 |
| Eg (eV) | −2.62 | −2.64 |
| τ (ns) | 2.38 | 2.49 |
| kr × 108 (s−1) | 0.33 | 0.35 |
| knr × 108 (s−1) | 0.09 | 0.05 |
The interaction of the dipole moment of the solute with the solvent have been analysed by the Lippert-Mataga model:49 hc(![[small epsilon, Greek, tilde]](https://www.rsc.org/images/entities/i_char_e0de.gif) abs −
abs − ![[small epsilon, Greek, tilde]](https://www.rsc.org/images/entities/i_char_e0de.gif) flu) = hc(hc
flu) = hc(hc![[small epsilon, Greek, tilde]](https://www.rsc.org/images/entities/i_char_e0de.gif) vacabs − hc
vacabs − hc![[small epsilon, Greek, tilde]](https://www.rsc.org/images/entities/i_char_e0de.gif) vacflu) + 2(μe − μg)2/ao3 f(ε,n) [f(ε,n): [(ε − 1/2 ε + 1) − 1/2 (n2 − 1/2n2 + 1)]; [μg (ground state dipole moment), μe (excited state dipole moment), f (orientation polarizability),
vacflu) + 2(μe − μg)2/ao3 f(ε,n) [f(ε,n): [(ε − 1/2 ε + 1) − 1/2 (n2 − 1/2n2 + 1)]; [μg (ground state dipole moment), μe (excited state dipole moment), f (orientation polarizability), ![[small epsilon, Greek, tilde]](https://www.rsc.org/images/entities/i_char_e0de.gif) abs (absorption maximum),
abs (absorption maximum), ![[small epsilon, Greek, tilde]](https://www.rsc.org/images/entities/i_char_e0de.gif) vacabs (absorption maximum extrapolated to gas phase),
vacabs (absorption maximum extrapolated to gas phase), ![[small epsilon, Greek, tilde]](https://www.rsc.org/images/entities/i_char_e0de.gif) flu (fluorescence maximum),
flu (fluorescence maximum), ![[small epsilon, Greek, tilde]](https://www.rsc.org/images/entities/i_char_e0de.gif) vacflu (fluorescence maximum extrapolated to gas-phase), ao (Onsager cavity), ε (solvent dielectric constant) and n (solvent refractive index)] (Fig. 3). The emission spectra gradually broadened and showed less structure with larger red-shifts, which supports that the excited state has a strong CT component. The red-shifted emission is due to the twisted conformation of these emitters, which leads to easier charge transfer from donor to acceptor via anthracene linker.
vacflu (fluorescence maximum extrapolated to gas-phase), ao (Onsager cavity), ε (solvent dielectric constant) and n (solvent refractive index)] (Fig. 3). The emission spectra gradually broadened and showed less structure with larger red-shifts, which supports that the excited state has a strong CT component. The red-shifted emission is due to the twisted conformation of these emitters, which leads to easier charge transfer from donor to acceptor via anthracene linker.
The two-section linear relation observed from the Lippert-Mataga plot (Fig. 3b) revealed that a line with a small slope in solvents with f ≤ 0.1 is due to the LE-like excited state component with a lower dipole moment (CAPI – 7.32 D and CCAPI – 5.00: DFT calculation: CAPI – 8.3 D and CCAPI – 7.5 D), whereas the higher slope in solvents with f ≥ 0.2 is because of the CT-like excited state component with a greater excited state dipole moment (CAPI – 24.3 D and CCAPI – 25.2 D).50 This highlights the coexistence and hybridization of the LE and CT excited state components (CAPI – 22.5 D and CCAPI – 23.4 D) [triphenylamine derivative TPAAnPI showed 9.9 D and 25.3 D].51 The higher dipole moment corresponding to the CT-region is greater than that of the CT molecule 4-(N,N-dimethylamino)benzonitrile (DMABN, 23 D), whereas the lower dipole moment in the LE-region is a little higher than those of conventional LE molecules such as anthracene and PI, indicating that CAPI and CCAPI are HLCT materials.
The solvatochromic data of these compounds were fitted with two straight lines corresponding to two different dipole moments because of the coexistence and hybridization of the LE and CT excited state components.50 The transformation of the slope between ether (f = 0.10) and ethyl acetate (f = 0.20) implies that CAPI and CCAPI have HLCT emissive states (intercrossed excited state of LE and CT): high % CT contribution in solvents with f ≥ 0.2, % LE dominates in solvents with f ≤ 0.1 and mixed contribution of LE and CT in moderate polarity solvents. The new blue emitters show high PLQY (soln/film) of CAPI (80/50) and CCAPI (88/62) and high PLQY is essential for efficient blue OLEDs (Table 1). It is unique that the CT material shows efficient deep-blue emission; the co-emission from LE and CT (intercrossed CT and LE state) is likely to be the reason for the high fluorescence yield. The high f (oscillator strength: λabs/λemi) in CHCl3 relative to the gas phase for CAPI [gas: 362 (f − 1.3687)/434 (f − 1.736): CHCl3-384 (f − 1.8923)/466 (f − 2.3098)] and CCAPI [gas: 356 (f − 1.4167)/433 (f − 1.5098): CHCl3-372 (f − 1.8932)/450 (f − 2.4531)] implies that higher luminescence will be obtained from the intercrossed excited state. These materials demonstrate one nanosecond lifetime without any delayed components (Fig. 3) and the energy gap of the singlet and triplet energy levels of CAPI and CCAPI is estimated to be less than 0.1 eV, which is also a feature of typical HLCT materials.
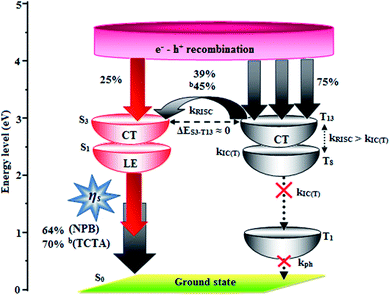
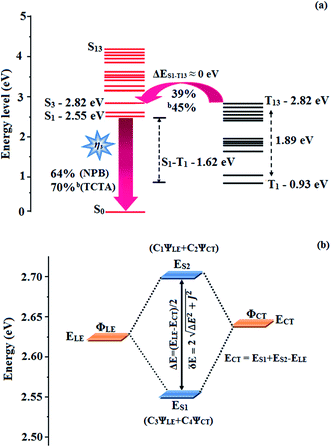
In low-polarity solvents, the PLQYs of CAPI/CCAPI remain unchanged (0.60/0.66 − n-hexane, 0.65/0.68 – isopropyl ether), which implies that the LE dominated emission from the low lying S1 state. In a medium-polarity solvent (THF), a high PLQY of 0.80/0.88 for CAPI/CCAPI was obtained due to the hybridization of LE with the CT excited state. In a high-polarity solvent (acetonitrile), a decrease in PLQY of (0.63/0.67) for CAPI/CCAPI was obtained, which is similar to that in low polarity solvents. As a result, the PLQY in solvents and film are satisfactory for OLED fabrication. The HLCT character can also be confirmed by the mono-exponential, nanosecond lifetimes of CAPI and CCAPI in solution (1.38/1.49 ns – n-hexane, 1.25/1.29 ns – ether, 2.38/2.49 ns – THF, 3.56/3.85 ns – acetonitrile) (Fig. 3) and show high radiative transition rates, CAPI (kr/knr): 0.43/0.29 (n-hexane); 0.51/0.29 (ether); 0.33/0.09 (THF); 0.17/0.11 – acetonitrile and CCAPI (kr/knr): 0.44/0.23 (n-hexane); 0.52/0.25 (ether); 0.35/0.05 (THF); 0.17/0.08 (acetonitrile) (Table 2). The CAPI/CCAPI oscillator strength (0.6089/0.6636) in the S1 excited state is consistent with PLQY in low polarity solutions. The excited state (S1) dipole moments of CAPI and CCAPI of 7.32 D and 5.00 D are also in accordance with the experimental results. Therefore, the emissive state of CAPI/CCAPI belongs to the S1 excited state and serves as exciton utilization channel. The S0 excited state exhibited obvious CT character according to NTO analysis. The NTO for S0 → S3 (CAPI) and S0 → S4 (CCAPI) transition displays a total CT transition character with hole distribution on the carbazole moiety and particle distribution on anthracene with minor overlap on the adjacent moiety, and T13 and T4 are the corresponding triplet CT excited states for CAPI (ES3-T13 – 0.00 eV) and CCAPI (ES4-T8 – 0.00 eV), respectively. Therefore, this could increase the RISC between S3 and T13 (CAPI) and S3 and T4 (CCAPI) excited states and enhance the exciton utilisation efficiency [% EUE: CAPI/CCAPI – 64/83: b70/95].
| Solvents | CAPI | CCAPI | ||||||
|---|---|---|---|---|---|---|---|---|
| PLQY (%) | τ (ns) | kr (109) s−1 | knr (109) s−1 | PLQY (%) | τ (ns) | kr (109) s−1 | knr (109) s−1 | |
| Hexane | 60.0 | 1.38 | 0.43 | 0.29 | 66.0 | 1.49 | 0.44 | 0.23 |
| Ether | 64.8 | 1.25 | 0.51 | 0.29 | 68.0 | 1.29 | 0.52 | 0.25 |
| THF | 80.0 | 2.38 | 0.33 | 0.09 | 88.0 | 2.49 | 0.35 | 0.05 |
| Acetonitrile | 62.6 | 3.56 | 0.17 | 0.11 | 67.3 | 3.85 | 0.17 | 0.08 |
3.3. Theoretical calculation
To gain more insight into the analysis of the HLCT emissive state, molecular optimization and frontier molecular orbital (FMO) analysis for CAPI and CCAPI were carried out (DFT/B3LYP/6-31G (d, p)) (Fig. 1). The blue emitters CAPI and CCAPI consist of the 9,10-substituted anthracene moiety involving the twisted D–π–A molecular configuration with torsional angles of 52° and 51° for N-side coupling, and 66° and 63° for C-side coupling, respectively. These carbazole derivatives show higher C-coupling torsional angles but smaller N-coupling angles as compared with triphenylamine derivatives TPAAnPI (torsional angles of 53.7°-C-side) and 69.0°-N-side).51Therefore, the calculated FMO exhibit partially separated characteristics. The highest occupied molecular orbital (HOMO) of CAPI is mainly localized on the phenanthrimidazole core and the LUMO is localized on the phenyl, anthracene and partially on phenanthrimidazole. In CCAPI, the HOMO is distributed on anthracene and the LUMO is fully distributed on the anthracene moiety, suggesting that the HOMO → LUMO transition involves an intercrossed CT and π–π* transition character, reflecting HLCT character. Furthermore, NTO analyses were performed for the singlet and triplet excited states based on the S0 state geometry using the time-dependent DFT (TD-DFT) method at the same level as S0. The S0 → S1 and S0 → S2 transitions of CAPI and CCAPI are the radiative π–π* and non-radiative n–π* transitions of anthracene, respectively, which efficiently increased the RISC between the S3 and T13 excited states (CAPI) and the S4 and T8 (CCAPI) excited states, and enhanced the exciton utilization efficiency.
The HONTOs and LUNTOs of CAPI and CCAPI (Fig. S2, S3, Tables S3 and S4†) exhibited hybrid splitting state character from the interstate coupling of LE with CT levels. The interstate hybridization coupling of LE with the CT state wave function is given by ΨS1/S2 = cLEΨLE ± cCTΨCT. The % CT of these emitters increased with steric hindrance with increasing aromatic substituent size and the increase in % LE in the S1 state resulted in higher photoluminescence efficiency (ηPL). The single emissive state of CAPI and CCAPI has been investigated by the excitation energies of the LE and CT states. A large energy gap (ΔEST) between T13 and T1 of CAPI (1.89 eV) and T8 and T1 of CCAPI (1.08 eV) arose from phenanthroimidazole acceptor group.50,51 A very small ΔEST between S3 and T13 (0.00 eV – CAPI) and S4 and T8 (0.00 eV – CCAPI) states facilitated the RISC (Tn → S1) process due to HLCT character (the S3–T12 energy gap of the triphenylamine derivative TPAAnPPI is only 0.0013 eV).51
CAPI and CCAPI show high photoluminescence efficiency (ηPL), high exciton utilisation efficiency (EUE) and high external quantum efficiency (EQE) because of the increased LE component in the S1 state. The small ΔEST of these materials arises from spatially separated HOMO and LUMO.46
Similar hole–electron wave functions between the singlet excited states in CAPI and CCAPI indicate the non-equivalent hybridization of the initial LE with the CT state (CAPI and CCAPI). The degree of hybridization in CAPI and CCAPI depends on both the initial ΔELE,CT and the coupling strength.54 In the transition density matrix (TDM) plot (Fig. S4 – CAPI and Fig. S5 – CCAPI†), the diagonal parts represent the LE component and the off-diagonal zone represents the CT component. Depending on electronic coupling, electrons are transferred from donor to acceptor on excitation, which was studied via the electron density distribution in both the ground and excited states. The computed distance between holes and electrons, H as well as t indexes and the RMSD of electrons and holes of these emitters are shown in Tables S5–S12.†
The formation of HLCT is supported by the Δr index (average of the hole–electron distance (dh+–e−): r < 2.0 Å LE; Δr > 2.0 Å CT) and indicates the nature of excitation (LE or CT) (Tables S13 and S14†). The LE (valence excitation) is associated with short distances (dh+–e−), whereas CT excitation is related to larger distances (dh+–e−). The dark triplet exciton is harvested through the RISC process by a hot CT mechanism in the electroluminescence process without delayed emission and leads to high exciton utilization (ηs) in CAPI and CCAPI like phosphorescent materials.44,45 The increasing % LE component and hybridization of LE with CT components result in high ηPL, and high ηs leads to enhanced device performances (Table 3). The computed overlap of the condensed function (ρ+ and ρ−) in CAPI and CCAPI is 0.99 (Fig. 4 and Table S15†), and the H/t index for CAPI and CCAPI are 5.91/5.61 and 5.91/5.85 Å, respectively. The CT index (DCT − H index) is another measure of the hole–electron separation (eqn S15 and S16†), and the calculated DCT/μCT of CAPI (0.33/37.28) and CCAPI (0.13/15.06) further confirmed the HLCT formation. A non-zero t index implies the severe overlap of holes with electrons and the Eigenvalue (>0.98) confirmed the hybridization with predominant excitation pairs (94% of transition).
| Emitters | V1000 (V) | ηc (cd A−1) | ηp (lm W−1) | EQEmax (%) | L (cd m−2) | EL (nm) | CIE (x,y) | ηroll-off (%) | ηs (%) |
|---|---|---|---|---|---|---|---|---|---|
| a ITO/PEDOT:PSS (40 nm)/NPB (5 nm)/TCTA (30 nm)/CAPI or CCAPI (20 nm)/TPBi (30 nm)/LiF (1 nm)/Al (100 nm).b ITO/PEDOT:PSS (40 nm)/TCTA (30 nm)/CAPI or CCAPI (20 nm)/TPBi (30 nm)/LiF (1 nm)/Al (100 nm). | |||||||||
| CAPIa | 3.00 | 13.32 | 13.00 | 8.40 | 26![[thin space (1/6-em)]](https://www.rsc.org/images/entities/char_2009.gif) 490 490 |
467 | 0.15,0.18 | 1.07 | 64 |
| CAPIb | 2.90 | 14.06 | 14.81 | 8.89 | 28![[thin space (1/6-em)]](https://www.rsc.org/images/entities/char_2009.gif) 801 801 |
467 | 0.15,0.18 | 1.02 | 70 |
| CCAPIa | 2.87 | 15.26 | 13.89 | 10.50 | 30![[thin space (1/6-em)]](https://www.rsc.org/images/entities/char_2009.gif) 628 628 |
450 | 0.15,0.20 | 4.76 | 83 |
| CCAPIb | 2.80 | 16.83 | 15.32 | 12.00 | 32![[thin space (1/6-em)]](https://www.rsc.org/images/entities/char_2009.gif) 546 546 |
450 | 0.15,0.20 | 0.83 | 95 |
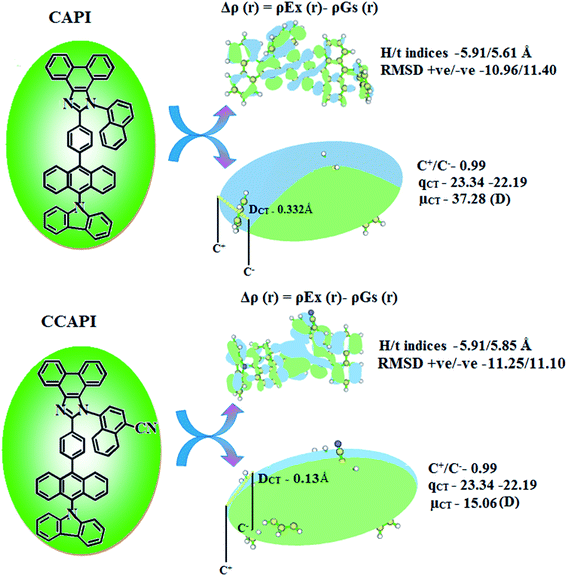 | ||
| Fig. 4 Graphical representation of DCT and centroid of charges [C+(r)/C−(r); isosurface for CAPI and for CCAPI (0.1 au)]. | ||
Fig. S6† shows the potential energy surface (PES) scan of CAPI and CCAPI in the gas phase and different polarity solvents. In the gas phase, the S3 (CAPI) and S4 (CCAPI) states are not mixed with the S1 state due to a large ΔES3-S1 (CAPI) and ΔES4-S1 (CCAPI). In low polarity solvents, the S3 (CAPI) and S4 (CCAPI) states crossed the S1 state, whereas in high polarity solvents, ES3 (CAPI) and ES4 (CCAPI) decreased sharply and became the lowest excited state. The energetic closeness in moderate-polarity solvents leads to the enhanced mixing of S3 (CAPI) and S4 (CCAPI) with S1 (the larger dipole moments of the S3 (CAPI) and S4 (CCAPI) states lead to stabilization in high polarity solvents). Therefore, the S1 state is dominated by LE character in low polarity medium; the S1 state is dominated by mixing the LE and CT character in moderate polarity medium and the S1 state is dominated by CT character in high polarity medium.
3.4. Electroluminescent properties
To understand the carrier transport abilities of CAPI and CCAPI, hole-only (HOD) and electron-only (EOD) devices have been fabricated with the configuration of ITO/NPB (8 nm)/CAPI or CCAPI (40 nm)/NPB (8 nm)/Al (100 nm) (hole-only device): NPB (LUMO: −2.3 eV) in the hole-only device can prevent electron injection from the Al cathode (Ef – 4.3 eV)47 and ITO/TPBi (8 nm)/CAPI or CCAPI (40 nm)/TPBi (8 nm)/LiF (1 nm)/Al (100 nm) (electron-only device): TPBi (HOMO: −6.2 eV) in the electron-only device with ITO (Ef – 4.8 eV) anode can prevent hole injection.52 The current densities versus voltage characteristics of hole-only and electron-only devices revealed that these compounds are bipolar materials (Fig. 5). The higher electron current density of CAPI and CCAPI based devices relative to the CBP device revealed that these bipolar materials transport electrons as well as holes effectively than CBP.55–57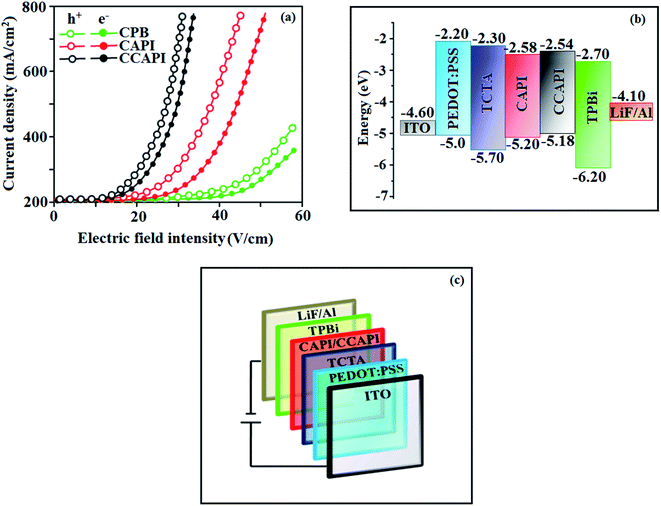 | ||
| Fig. 5 (a) Single-carrier devices: current density vs. electric field intensity; (b) energy level diagram of non-doped devices and (c) configuration of non-doped devices. | ||
To explore the potential application of CAPI and CCAPI as fluorescent materials, non-doped blue fluorescent OLEDs have been fabricated with the configuration of ITO/PEDOT:PSS (40 nm)/NPB (5 nm)/CAPI or CCAPI (20 nm)/TPBi (30 nm)/LiF(1 nm)/Al (100 nm) (Fig. 5) and ITO/PEDOT:PSS (40 nm)/TCTA (30 nm)/CAPI or CCAPI (20 nm)/TPBi (30 nm)/LiF (1 nm)/Al 100 nm) (Fig. S7†) [polyethylenedioxythiophene/polystyrene sulfonate (PEDOT![[thin space (1/6-em)]](https://www.rsc.org/images/entities/char_2009.gif) :
:![[thin space (1/6-em)]](https://www.rsc.org/images/entities/char_2009.gif) PSS) – hole injecting layer; (N,N′-diphenyl-N,N′-bis(1-naphtyl)-1,1′-biphenyl-4,4′′-diamine) (NPB) – hole transporting layer; 4,4′,4′′-tri(N-carbazolyl) triphenylamine (TCTA) – hole transporting and electron blocking layer; 1,3,5-tri(phenyl-2benzimidazolyl)benzene (TPBi) – electron transporting and hole blocking layer; LiF – electron injecting layer].
PSS) – hole injecting layer; (N,N′-diphenyl-N,N′-bis(1-naphtyl)-1,1′-biphenyl-4,4′′-diamine) (NPB) – hole transporting layer; 4,4′,4′′-tri(N-carbazolyl) triphenylamine (TCTA) – hole transporting and electron blocking layer; 1,3,5-tri(phenyl-2benzimidazolyl)benzene (TPBi) – electron transporting and hole blocking layer; LiF – electron injecting layer].
The non-doped device based on CAPI/CCAPI showed blue emission (467/450 nm) with CIE of (0.15, 0.18)/(0.15, 0.20) and exhibited maximum current efficiency (ηc), power efficiency (ηp) and EQE of 13.32/15.26 cd A; 13.0/13.89 lm W−1; 8.4/10.5% with luminance of 26![[thin space (1/6-em)]](https://www.rsc.org/images/entities/char_2009.gif) 490/30
490/30![[thin space (1/6-em)]](https://www.rsc.org/images/entities/char_2009.gif) 628 cd m−2, respectively (Fig. 6, 7 and Table 2). The external quantum efficiency [ηEQE = ηout × ηrc × ηγ × ΦPL,53 ΦPL –quantum yield of film, ηout – out-coupling efficiency (20%), ηrc – product of charge recombination efficiency (100%), ηγ – radiative exciton-production (25%)] and EUE can be estimated [ηs = 5 × ηex/ΦPL × 100]: maximum exciton utilizing the efficiency of the devices based on CAPI and CCAPI have been calculated as 64 and 83% (Fig. 8 – CAPI and S8 – CCAPI†), respectively and exceed the 25% theoretical limit of spin statistics for conventional fluorescent OLEDs. The efficiency roll-off (ηroll-off) is 0.92% only at a luminance of 1000 cd m2; however, the EQE is still not satisfactory for display applications. Therefore, the non-doped device with a configuration of bITO/PEDOT:PSS (40 nm)/TCTA (30 nm)/CAPI or CCAPI (20 nm)/TPBi(30 nm)/LiF (1 nm)/Al (100 nm) has been fabricated to enhance the efficiencies (Fig. S7†). The non-doped device with CAPI/CCAPI showed blue emission (467/450 nm) maximum current efficiency, power efficiency and EQE of 14.06/16.83; 14.81/15.32; 8.89/12.0, respectively, with a luminance of 28
628 cd m−2, respectively (Fig. 6, 7 and Table 2). The external quantum efficiency [ηEQE = ηout × ηrc × ηγ × ΦPL,53 ΦPL –quantum yield of film, ηout – out-coupling efficiency (20%), ηrc – product of charge recombination efficiency (100%), ηγ – radiative exciton-production (25%)] and EUE can be estimated [ηs = 5 × ηex/ΦPL × 100]: maximum exciton utilizing the efficiency of the devices based on CAPI and CCAPI have been calculated as 64 and 83% (Fig. 8 – CAPI and S8 – CCAPI†), respectively and exceed the 25% theoretical limit of spin statistics for conventional fluorescent OLEDs. The efficiency roll-off (ηroll-off) is 0.92% only at a luminance of 1000 cd m2; however, the EQE is still not satisfactory for display applications. Therefore, the non-doped device with a configuration of bITO/PEDOT:PSS (40 nm)/TCTA (30 nm)/CAPI or CCAPI (20 nm)/TPBi(30 nm)/LiF (1 nm)/Al (100 nm) has been fabricated to enhance the efficiencies (Fig. S7†). The non-doped device with CAPI/CCAPI showed blue emission (467/450 nm) maximum current efficiency, power efficiency and EQE of 14.06/16.83; 14.81/15.32; 8.89/12.0, respectively, with a luminance of 28![[thin space (1/6-em)]](https://www.rsc.org/images/entities/char_2009.gif) 801/32
801/32![[thin space (1/6-em)]](https://www.rsc.org/images/entities/char_2009.gif) 546 cd m−2 and the efficiency roll-off (ηroll-off) was 0.53% only at a luminance of 1000 cd m−2. The high EQE and low roll-off efficiency further emphasized the great potential of new CAPI and CCAPI materials for industrial applications. The EL spectra are stable with a driving voltage range of 3 V to 10 V (Fig. 7). The transient EL decay curves of devices with the configuration of bCAPI/bCCAPI at different voltages correspond to two components: rapid EL decay originating from the fluorescence of S1 and delayed decay. The ratio of the delayed component decreased from 3 V to 10 V because of the quenching of dark triplet excitons and the amplified delayed component obtained from the plot of log EL intensity and log time [slope: −0.21 (initial time); −1.46 (log time)] (Fig. 3);58 however, the slope should be −2 instead of −1.46 for the TTA mechanism. Therefore, the TTA configuration is insignificant in the EL process. The TPAANPPI exhibited ηc, ηp and EQE of 12.51 cd A−1, 11.47 lm W−1 and 8.00%, respectively.51
546 cd m−2 and the efficiency roll-off (ηroll-off) was 0.53% only at a luminance of 1000 cd m−2. The high EQE and low roll-off efficiency further emphasized the great potential of new CAPI and CCAPI materials for industrial applications. The EL spectra are stable with a driving voltage range of 3 V to 10 V (Fig. 7). The transient EL decay curves of devices with the configuration of bCAPI/bCCAPI at different voltages correspond to two components: rapid EL decay originating from the fluorescence of S1 and delayed decay. The ratio of the delayed component decreased from 3 V to 10 V because of the quenching of dark triplet excitons and the amplified delayed component obtained from the plot of log EL intensity and log time [slope: −0.21 (initial time); −1.46 (log time)] (Fig. 3);58 however, the slope should be −2 instead of −1.46 for the TTA mechanism. Therefore, the TTA configuration is insignificant in the EL process. The TPAANPPI exhibited ηc, ηp and EQE of 12.51 cd A−1, 11.47 lm W−1 and 8.00%, respectively.51
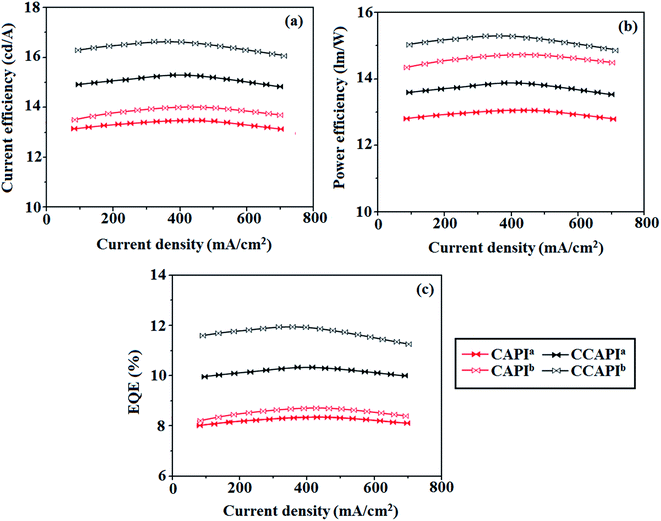 | ||
| Fig. 6 Device efficiencies: (a) current efficiency − current density; (b) power efficiency − current density and (c) external quantum efficiency – current density. | ||
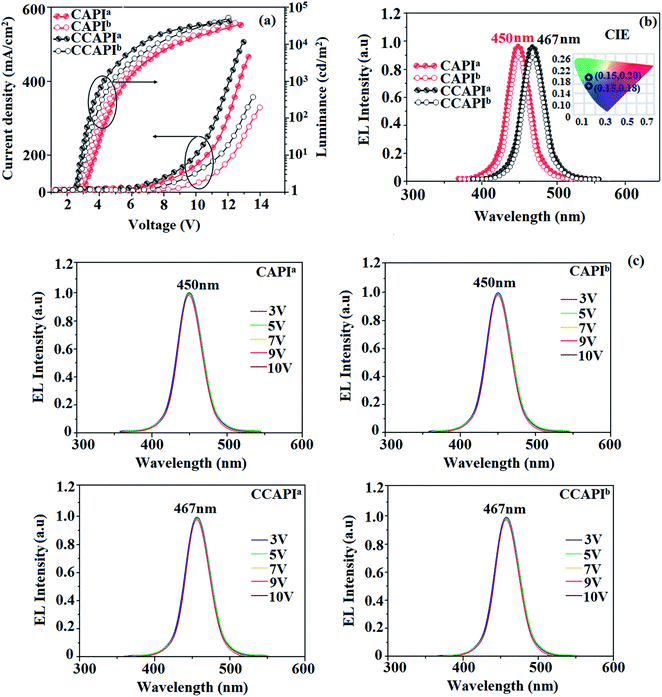 | ||
| Fig. 7 Device efficiencies: (a) luminance – current density – voltage; (b) EL spectra (inset: CIE coordinates) and (c) normalized EL specta at different voltages. | ||
The small energy splitting (ΔEST ≈ 0) between S3 and T13 (0.00 eV – CAPI) (Fig. 9) and S4 and T8 (0.00 eV – CCAPI) (Fig. S9†) promotes potential RISC processes and the dark triplet excitons are converted into singlet excitons in the EL process [aCAPI/bCAPI – 39/45%; aCCAPI/bCCAPI – 58/70%]. According to the energy-gap law,59 the larger energy-gap between T13 and T1 of CAPI (1.89 eV) and T8 and T1 of CCAPI (1.08 eV) inhibits the internal conversion (IC) process and the more competitive RISC process between T13 and S3 of CAPI (0.00 eV) and T8 and S4 of CCAPI (0.00 eV) is predominant because of a narrower energy gap. Therefore, a large fraction of electro-generated dark triplet excitons were transferred into singlet excitons via T13 → S3 (CAPI) and T8 → S4 (CCAPI) channels. Moreover, the larger energy gap between S1 and T1 (ΔES1T1 = 1.62 eV – CAPI and 0.51 eV – CCAPI) prevents the intersystem crossing process from low-lying S1 to T1 and excludes the existence of the TADF mechanism. To the best of our knowledge, the efficiencies of CAPI and CCAPI are comparable with those of blue-emitting devices reported recently (Table 4).1–4,60–75 Therefore, the HLCT mechanism is likely responsible for the radiative exciton ratio above 25% in the non-doped OLED based on CAPI and CCAPI.
| Emissive materials | V (V) | ηc (cd A−1) | ηp (lm W−1) | EL (nm) | EQEmax (%) | Lmax (cd m−2) | CIE (x,y) | Ref. |
|---|---|---|---|---|---|---|---|---|
| CAPIa | 3.00 | 13.32 | 13.0 | 467 | 8.4 | 26![[thin space (1/6-em)]](https://www.rsc.org/images/entities/char_2009.gif) 490 490 |
0.15,0.20 | This work |
| CAPIb | 2.90 | 14.06 | 14.81 | 467 | 8.89 | 28![[thin space (1/6-em)]](https://www.rsc.org/images/entities/char_2009.gif) 801 801 |
0.15,0.20 | This work |
| CCAPIa | 2.87 | 15.26 | 13.89 | 450 | 10.5 | 30![[thin space (1/6-em)]](https://www.rsc.org/images/entities/char_2009.gif) 628 628 |
0.15,0.20 | This work |
| CCAPIb | 2.80 | 16.83 | 15.32 | 450 | 12.0 | 32![[thin space (1/6-em)]](https://www.rsc.org/images/entities/char_2009.gif) 546 546 |
0.15,0.20 | This work |
| PIAnCN | 3.0 | 13.6 | — | 470 | 9.44 | 577![[thin space (1/6-em)]](https://www.rsc.org/images/entities/char_2009.gif) 787 787 |
0.14,0.19 | 1 |
| TPA-AN | — | 5.06 | 2.48 | 460 | 3.0 | 10![[thin space (1/6-em)]](https://www.rsc.org/images/entities/char_2009.gif) 079 079 |
0.15,0.23 | 2 |
| 2 | 3.26 | 2.92 | 454 | 2.05 | 1487 | 0.18,0.18 | 3 | |
| m-MethylTPE-pTPE | 4.0 | 8.4 | — | 452 | 2.60 | 11![[thin space (1/6-em)]](https://www.rsc.org/images/entities/char_2009.gif) 668 668 |
0.18,0.21 | 4 |
| o-Methyl-BTPE | 4.0 | 6.7 | — | 450 | 1.57 | 8685 | 0.18,0.18 | 4 |
| o-MethylTPE-pTPE | 3.5 | 9.7 | — | 454 | 4.06 | 14![[thin space (1/6-em)]](https://www.rsc.org/images/entities/char_2009.gif) 644 644 |
0.17,0.21 | 4 |
| 4.3 | 3.88 | 1.33 | 436/464/492 | 1.68 | 11![[thin space (1/6-em)]](https://www.rsc.org/images/entities/char_2009.gif) 629 629 |
0.18,0.22 | 59 | |
| PhN-O | 4.0 | 4.61 | — | 460 | 3.09 | 14![[thin space (1/6-em)]](https://www.rsc.org/images/entities/char_2009.gif) 747 747 |
0.17,0.19 | 60 |
| PhN | 4.0 | 3.65 | — | 470 | 2.27 | 7707 | 0.17,0.23 | 60 |
| 1 | — | 0.93 | 1.01 | 460 | — | 1525 | 0.18,0.23 | 61 |
| 2 | — | 1.59 | 1.46 | 451 | — | 2011 | 0.17,0.21 | 61 |
| 3 | — | 1.12 | 0.93 | 445 | — | 1303 | 0.17,0.19 | 61 |
| BDNPA | — | 5.21 | — | — | — | 1300 | 0.16,0.19 | 62 |
| Anthracene-PI | 3.2 | 1.33 | 0.97 | 472 | 0.80 | — | 0.16,0.24 | 63 |
| Py-BPI | 2.5 | 3.27 | 3.17 | 468 | 2.07 | — | 0.15,0.18 | 63 |
| Py-2NTF | 3.9 | 2.50 | 1.37 | 456 | 1.37 | 6081 | 0.17,0.18 | 64 |
| Chromophore I | 7.0 | 0.28 | — | 460 | — | 279 | 0.19,0.22 | 65 |
| Chromophore II | 6.0 | — | — | 466 | — | 160 | — | 65 |
| 3 | 3.5 | 3.43 | — | 460 | 2.29 | 35![[thin space (1/6-em)]](https://www.rsc.org/images/entities/char_2009.gif) 600 600 |
0.16,0.18 | 66 |
| Py-TPICN | 3.6 | 3.00 | 2.62 | 440 | 1.34 | 14![[thin space (1/6-em)]](https://www.rsc.org/images/entities/char_2009.gif) 592 592 |
0.15,0.18 | 67 |
| PPBC | — | 1.29 | 1.34 | 441 | — | 7500 | 0.21,0.22 | 68 |
| 1 | — | 2.25 | 0.92 | 478 | 1.85 | 14![[thin space (1/6-em)]](https://www.rsc.org/images/entities/char_2009.gif) 565 565 |
0.17,0.24 | 69 |
| 2 | — | 2.13 | 1.03 | 465 | 1.23 | 6163 | 0.16,0.23 | 69 |
| DTPA-DSO2 | 4.5 | 9.1 | 5.4 | — | 6.3 | — | 0.14,0.22 | 70 |
| DBPA-DSO2 | 3.0 | 6.5 | 6.8 | — | 4.7 | — | 0.17,0.22 | 70 |
| 6a | — | 4.3 | — | — | 2.8 | — | 0.16,0.21 | 71 |
| 6b | — | 4.2 | — | — | 2.6 | — | 0.16,0.22 | 71 |
| 6c | — | 1.7 | — | — | 2.4 | — | 0.15,0.18 | 71 |
| TSPI-1 | 3.77 | — | — | 457 | — | 1.6 | 0.17,0.18 | 72 |
| BPPI | 2.8 | 6.87 | 6.2 | 468 | 4.0 | — | 0.16,0.21 | 73 |
| INaCPI | 2.73 | 4.32 | 2.46 | — | 2.82 | — | 0.16,0.20 | 73 |
| Py-BPI | 2.5 | 3.27 | 3.17 | — | 2.07 | — | 0.15,0.18 | 73 |
| PCz-an-PPI | 2.6 | 6.43 | 6.23 | — | 3.99 | — | 0.15,0.23 | 73 |
| DPF-TPI | 2.7 | 8.41 | 7.23 | — | 4.85 | — | 0.17,0.24 | 73 |
| CP-PPI | 5.91 | 3.51 | — | 458 | 2.39 | — | 0.18,0.21 | 74 |
4 Conclusion
We have synthesized novel D–π–A materials with HLCT character enhancing the exciton utilization efficiency. The small energy splitting (ΔEST ≈ 0) between S3 and T13 (0.00 eV – CAPI) and S4 and T8 (0.00 eV – CCAPI) promotes a potential RISC process and the dark triplet excitons are effectively converted to singlet excitons in the EL process. The non-doped device with CCAPI shows blue emission (450 nm) with maximum current efficiency (ηc), power efficiency (ηp), external quantum efficiency (ηex) of 16.83 cd A−1, 15.32 lm W−1, 12.0%, respectively, and exciton utilization efficiency (EUE) of 95% with a luminance of 32![[thin space (1/6-em)]](https://www.rsc.org/images/entities/char_2009.gif) 546 cd m−2 and a small roll-off efficiency of 0.53%. The amplified delayed component with obtained slope ruled out the contribution of the TTA mechanism and confirmed that the HLCT mechanism is responsible for the radiative exciton ratio above 25% in the non-doped OLED based on CAPI and CCAPI. The high EQE and small roll-off efficiency of devices emphasize the great potential of CAPI and CCAPI for industrial applications.
546 cd m−2 and a small roll-off efficiency of 0.53%. The amplified delayed component with obtained slope ruled out the contribution of the TTA mechanism and confirmed that the HLCT mechanism is responsible for the radiative exciton ratio above 25% in the non-doped OLED based on CAPI and CCAPI. The high EQE and small roll-off efficiency of devices emphasize the great potential of CAPI and CCAPI for industrial applications.
Conflicts of interest
There are no conflicts to declare.References
- X. Y. Tang, Q. Bai, T. Shan, J. Y. Li, Y. Gao, F. T. Liu, H. Liu, Q. M. Peng, B. Yang, F. Li and P. Lu, Adv. Funct. Mater., 2018, 28, 1705813–1705821 CrossRef
.
- W. J. Li, Y. Y. Pan, L. Yao, H. C. Liu, S. T. Zhang, C. Wang, F. Z. Shen, P. Lu, B. Yang and Y. G. Ma, Adv. Opt. Mater., 2014, 2, 892–901 CrossRef CAS
.
- J. Y. Song, S. J. Lee, Y. K. Kim and S. S. Yoon, Mater. Res. Bull., 2014, 58, 145–148 CrossRef CAS
.
- J. Huang, M. Yang, J. Yang, R. L. Tang, S. H. Ye, Q. Q. Li and Z. Li, Org. Chem. Front., 2015, 2, 1608–1615 RSC
.
- M. R. Zhu and C. L. Yang, Chem. Soc. Rev., 2013, 42, 4963–4976 RSC
.
- K. Klimes, Z. Q. Zhu and J. Li, Adv. Funct. Mater., 2019, 29, 1903068–1903076 CrossRef
.
- H. Uoyama, K. Goushi, K. Shizu, H. Nomura and C. Adachi, Nature, 2012, 492, 234–238 CrossRef CAS
.
- L. S. Cui, Y. M. Xie, Y. K. Wang, C. Zhong, Y. L. Deng, X. Y. Liu, Z. Q. Jiang and L. S. Liao, Adv. Mater., 2015, 27, 4213–4217 CrossRef CAS
.
- Q. Zhang, J. Shizu, K. Li, S. Huang, S. Hirata, H. Miyazaki and C. Adachi, J. Am. Chem. Soc., 2012, 134, 14706–14709 CrossRef CAS
.
- H. Liang, X. Wang, X. Zhang, Z. Ge, X. Ouyang and S. Wang, Dyes Pigm., 2014, 10, 57–63 CrossRef
.
- Q. Zhang, B. Li, S. Huang, H. Nomura, H. Tanaka and C. Adachi, Nat. Photonics, 2014, 8, 326–332 CrossRef CAS
.
- J. Lee, H. F. Chen, T. Batagoda, C. Coburn, P. I. Djurovich, M. E. Thompson and S. R. Forrest, Nat. Mater., 2016, 15, 92–98 CrossRef CAS
.
- J. Zhang, D. Ding, Y. Wei and H. Xu, Chem. Sci., 2016, 7, 2870–2882 RSC
.
- P. I. Shih, C. Y. Chuang, C. H. Chien, E. W. G. Diau and C. F. Shu, Adv. Funct. Mater., 2007, 17, 3141–3146 CrossRef CAS
.
- Y. H. Kim, D. C. Shin, S. H. Kim, C. H. Ko, H. S. Yu, Y. S. Chae and S. K. Kwon, Adv. Mater., 2001, 13, 1690–1693 CrossRef CAS
.
- C. H. Wu, C. H. Chien, F. M. Hsu, P. I. Shih and C. F. Shu, J. Mater. Chem., 2009, 19, 1464–1470 RSC
.
- F. Liu, W. Y. Lai, C. Tang, H. B. Wu, Q. Q. Chen, B. Peng, W. Wei, W. Huang and Y. Cao, Macromol. Rapid Commun., 2008, 29, 659–664 CrossRef CAS
.
- C. Adachi, T. Tsutsui and S. Saito, Appl. Phys. Lett., 1990, 56, 799–801 CrossRef CAS
.
- S. Tao, Y. Zhou, C. S. Lee, S. T. Lee, D. Huang and X. Zhang, J. Phys. Chem. C, 2008, 112, 14603–14606 CrossRef CAS
.
- S. K. Kim, B. Yang, Y. I. Park, Y. Ma, J. Y. Lee, H. J. Kim and J. Park, Org. Electron., 2009, 10, 822–833 CrossRef CAS
.
- W. Staroske, M. Pfeiffer, K. Leo and M. Hoffmann, Phys. Rev. Lett., 2007, 98, 197402–197406 CrossRef CAS
.
- N. C. Giebink and S. R. Forrest, Phys. Rev. B: Condens. Matter Mater. Phys., 2008, 77, 235215–235219 CrossRef
.
- Y. J. Pu, G. Nakata, F. Satoh, H. Sasabe, D. Yokoyama and J. Kido, Adv. Mater., 2012, 24, 1765–1770 CrossRef CAS
.
- J. H. Jou, S. Kumar, M. Singh, Y. H. Chen, C. C. Chen and M. T. Lee, Molecules, 2015, 20, 13005–13030 CrossRef CAS
.
- M. Sun, L. Zhu, W. Kan, Y. Wei, D. Ma, X. Fan, W. Huang and H. Xu, J. Mater. Chem. C, 2015, 3, 9469–9478 RSC
.
- Y. Yuan, J. Chen, F. Lu, Q. Tong, Q. Yang, H. Mo, T. W. Ng, F. Wong, Z. Guo, J. Ye, Z. Chen, X. H. Zhang and C. S. Lee, Chem. Mater., 2013, 25, 4957–4965 CrossRef CAS
.
- K. Wang, S. Wang, J. Wei, Y. Miao, Y. Liu and Y. Wang, Org. Electron., 2014, 15, 3211–3220 CrossRef CAS
.
- N. Su, F. Meng, J. Chen, Y. Wang, H. Tan, S. Su and W. Zhu, Dyes Pigm., 2016, 128, 68–74 CrossRef CAS
.
- H. Liu, P. Chen, D. Hu, X. Tang, Y. Pan, H. Zhang, W. Zhang, X. Han, Q. Bai, P. Lu and Y. Ma, Chem. - Eur. J., 2014, 20, 2149–2153 CrossRef CAS
.
- C. H. Chen and J. Shi, Chem. Rev., 1998, 171, 161–174 CAS
.
- W. Kan, L. Zhu, Y. Wei, D. Ma, M. Sun, Z. Wu, W. Huang and H. Xu, J. Mater. Chem. C, 2015, 3, 5430–5439 RSC
.
- M. Liu, X. L. Li, D. Chen, Z. Xie, X. Cai, G. Xie, K. Liu, J. K. Tang, S. J. Su and Y. Cao, Adv. Funct. Mater., 2015, 25, 5190–5198 CrossRef CAS
.
- Y. Zhang, S. L. Lai, Q. X. Tong, M. F. Lo, T. W. Ng, M. Y. Chan, Z. C. Wen, J. He, K. S. Jeff, X. L. Tang, W. M. Liu, C. C. Ko, P. F. Wang and C. S. Lee, Chem. Mater., 2012, 24, 61–70 CrossRef
.
- Z. Gao, G. Cheng, F. Shen, S. Zhang, Y. Zhang, P. Lu and Y. Ma, Laser Photonics Rev., 2014, 8, L6–L10 CrossRef CAS
.
- W. Qin, Z. Yang, Y. Jiang, J. W. Y. Lam, G. Liang, H. S. Kwok and B. Z. Tang, Chem. Mater., 2015, 27, 3892–3901 CrossRef CAS
.
- X. Ouyang, X. Li, L. Ai, D. Mi, Z. Ge and S. J Su, ACS Appl. Mater. Interfaces, 2015, 7, 7869–7877 CrossRef CAS
.
- D. Kumar, K. R. Thomas, C. P. Lee and K. C. Ho, Org. Lett., 2011, 13, 2622–2625 CrossRef CAS
.
- D. Kumar, K. R. J. Thomas, C. P. Lee and K. C. Ho, Asian J. Org. Chem., 2015, 4, 164–172 CrossRef CAS
.
-
(a) W. J. Li, Y. Y. Pan, R. Xiao, Q. Peng, S. T. Zhang, D. G. Ma, F. Li, F. Z. Shen, Y. Wang, B. Yang and Y. G. Ma, Adv. Funct. Mater., 2014, 24, 1609–1614 CrossRef CAS
; (b) H. C. Liu, Q. Bai, W. J. Li, Y. C. Guo, L. Yao, Y. Gao, J. Y. Li, P. Lu, B. Yang and Y. G. Ma, RSC Adv., 2016, 6, 70085–70090 RSC
; (c) X. Y. Tang, Q. Bai, Q. M. Peng, Y. Gao, J. Y. Li, Y. L. Liu, L. Yao, P. Lu, B. Yang and Y. G. Ma, Chem. Mater., 2015, 27, 7050–7057 CrossRef CAS
; (d) H. C. Liu, Q. Bai, L. Yao, H. Y. Zhang, W. J. Li, Y. Gao, J. Y. Li, P. Lu, H. Y. Wang, B. Yang and Y. G. Ma, Chem. Sci., 2015, 6, 3797–3804 RSC
.
-
(a) M. J. Frisch, G. W. Trucks, H. B. Schlegel, G. E. Scuseria, M. A. Robb, J. R. Cheeseman, G. Scalmani, V. Barone, B. Mennucci, G. A. Petersson, H. Nakatsuji, M. Caricato, X. Li, H. P. Hratchian, A. F. Izmaylov, J. Bloino, G. Zheng, J. L. Sonnenberg, M. Hada, M. Ehara, K. Toyota, R. Fukuda, J. Hasegawa, M. Ishida, T. Nakajima, Y. Honda, O. Kitao, H. Nakai, T. Vreven, J. A. Montgomery, J. E. Peralta, F. Ogliaro, M. Bearpark, J. J. Heyd, E. Brothers, K. N. Kudin, V. N. Staroverov, R. Kobayashi, J. Normand, K. Raghavachari, A. Rendell, J. C. Burant, S. S. Iyengar, J. Tomasi, M. Cossi, N. Rega, J. M. Millam, M. Klene, J. E. Knox, J. B. Cross, V. Bakken, C. Adamo, J. Jaramillo, R. Gomperts, R. E. Stratmann, O. Yazyev, A. J. Austin, R. Cammi, C. Pomelli, J. W. Ochterski, R. L. Martin, K. Morokuma, V. G. Zakrzewski, G. A. Voth, P. Salvador, J. J. Dannenberg, S. Dapprich, A. D. Daniels, O. Farkas, J. B. Foresman, J. V. Ortiz, J. Cioslowski, D. J. Fox, Gaussian, Inc., Wallingford., CT., 2009, 121, 150
; (b) T. Lu and F. Chen, J. Comput. Chem., 2012, 33, 580–592 CrossRef CAS
.
- Z. Gao, Y. L. Liu, Z. M. Wang, F. Z. Shen, H. Liu, G. N. Sun, L. Yao, Y. Lv, P. Lu and Y. G. Ma, Chem. - Eur. J., 2013, 19, 2602–2605 CrossRef CAS
.
- S. Tang, W. J. Li, F. Z. Shen, D. D. Liu, B. Yang and Y. G. Ma, J. Mater. Chem., 2012, 22, 4401–4408 RSC
.
- R. N. Jones, Chem. Rev., 1947, 41, 353–371 CrossRef CAS
.
- M. A. Baldo, S. Lamansky, P. E. Burrows, M. E. Thompson and S. R. Forrest, Appl. Phys. Lett., 1999, 60, 14422 CAS
.
- Y. Tao, Q. Wang, C. Yang, Q. Wang, Z. Zhang and T. Zou, Angew. Chem., 2008, 47, 8104–8107 CrossRef CAS
.
- W. C. Chen, Y. Yuan, G. F. Wu, H. X. Wei, J. Ye, M. Chen, F. Lu, Q. X. Tong, F. L. Wong and C. S. Lee, Org. Electron., 2015, 17, 159–166 CrossRef CAS
.
- R. L. Martin, J. Chem. Phys., 2003, 118, 4775–4777 CrossRef CAS
.
- S. Tretiak and S. Mukamel, Chem. Rev., 2002, 102, 3171–3212 CrossRef CAS
.
- Y. C. Li, Z. H. Wang, X. L. Li, G. Z. Xie, D. C. Chen, Y. F. Wang, C. C. Lo, A. Lien, J. B. Peng, Y. Cao and S. J. Su, Chem. Mater., 2015, 27, 1100–1109 CrossRef CAS
.
- S. T. Zhang, W. J. Li, L. Yao, Y. Y. Pan, F. Z. Shen, R. Xiao, B. Yang and Y. G. Ma, Chem. Commun., 2013, 49, 11302–11304 RSC
.
- L. Xianhao, S. Mizhen, X. Lei, W. Runzhe, Z. Huayi, P. Yuyu, Z. Shitong, S. Qikun, X. Shanfeng and Y. Wenjun, Chem. Sci., 2020, 11, 5058–5065 RSC
.
- J. Jayabharathi, J. Anudeebhana, V. Thanikachalam and S. Sivaraj, RSC Adv., 2020, 10, 8866–8879 RSC
.
- J. Jayabharathi, S. Panimozhi and V. Thanikachalam, Sci. Rep., 2019, 9, 17555 CrossRef
.
- S. Zhang, L. Yao, Q. Peng, W. Li, Y. Pan, R. Xiao, Y. Gao, C. Gu, Z. Wang, P. Lu, F. Li, S. Su, B. Yang and Y. Ma, Adv. Funct. Mater., 2015, 25, 1755–1762 CrossRef CAS
.
- Y. Liu, L. S. Cui, M. F. Xu, X. B. Shi, X. B. Zhou, Z. K. Wang, Z. Q. Jiang and L. S. Liao, J. Mater. Chem. C, 2014, 2, 2488–2495 RSC
.
- Y. H. Lou, M. F. Xu, L. Zhang, Z. K. Wang, S. Naka, H. Okada and L. S. Liao, Org. Electron., 2013, 14, 2698–2704 CrossRef CAS
.
- Z. Wang, Y. Lou, S. Naka and H. Okada, Appl. Phys. Lett., 2011, 98, 063302–063305 CrossRef
.
- G. Haykir, M. Aydemir, S. H. Han, S. Gumus, G. Hizal, J. Y. Lee and F. Turksoy, Org. Electron., 2018, 59, 319–329 CrossRef CAS
.
- X. Lv, M. Sun, L. Xu, R. Wang, H. Zhou, Y. Pan, S. Zhang, Q. Sun, S. Xue and W. Yang, Chem. Sci., 2020, 11, 5058–5065 RSC
.
- C. L. Yao, Y. Yu, X. L. Yang, H. M. Zhang, Z. Huang, X. B. Xu, G. J. Zhou, L. Yue and Z. X. Wu, J. Mater. Chem. C, 2015, 3, 5783–5794 RSC
.
- X. J. Feng, J. H. Peng, Z. Xu, R. R. Fang, H. R. Zhang, X. J. Xu, L. D. Li, J. H. Gao and M. S. Wong, ACS Appl. Mater. Interfaces, 2015, 7, 28156–28165 CrossRef CAS
.
- S. N. Park, S. B. Lee, C. Kim, H. W. Lee, Y. K. Kim and S. S. Yoon, Jpn. J. Appl. Phys., 2015, 54, 06FK06 CrossRef
.
- S. Sohn, M. J. Kim, S. Jung, T. J. Shin, H. K. Lee and Y. H. Kim, Org. Electron., 2015, 24, 234–240 CrossRef CAS
.
- Y. Zhang, J. H. Wang, G. Y. Han, F. Lu and Q. X. Tong, RSC Adv., 2016, 6, 70800–70809 RSC
.
- J. Yang, L. Li, Y. Yu, Z. C. Ren, Q. Peng, S. H. Ye, Q. Q. Li and Z. Li, Mater. Chem. Front., 2017, 1, 91–99 RSC
.
- C. B. Fan, X. M. Wang and J. F. Luo, Opt. Mater., 2017, 64, 489–495 CrossRef CAS
.
- T. Shan, Z. Gao, X. Y. Tang, X. He, Y. Gao, J. Y. Li, X. Y. Sun, Y. L. Liu, H. C. Liu, B. Yang, P. Lu and Y. G. Ma, Dyes Pigm., 2017, 142, 189–197 CrossRef CAS
.
- J. Jayabharathi, P. Jeeva, V. Thanikachalam and S. Panimozhi, J. Photochem. Photobiol., A, 2017, 346, 296–310 CrossRef CAS
.
- H. P. Shi, S. J. Wang, L. Y. Qin, C. Gui, X. L. Zhang, L. Fang, S. M. Chen and B. Z. Tang, Dyes Pigm., 2018, 149, 323–330 CrossRef CAS
.
- K. Jisu, P. Soyoung, H. Namhee, L. S. Eun, K. Y. Kwan and Y. S. Soo, Mol. Cryst. Liq. Cryst., 2018, 662, 9–17 CrossRef
.
- D. C. Chen, K. K. Liu, X. L. Li, B. B. Li, M. Liu, X. Y. Cai, Y. G. Ma, Y. Cao and S. J. Su, J. Mater. Chem. C, 2017, 5, 10991–11000 RSC
.
- G. Haykir, M. Aydemir, S. H. Han, S. Gumus, G. Hizal, J. Y. Lee and F. Turksoy, Org. Electron., 2018, 59, 319–329 CrossRef CAS
.
- S. L. Ramesh Babu, Y. Peddaboodi Gopikrishna, E. Elaiyappillai, B. A, S. Manoharan, P. K. Iyer and P. M. Johnson, J. Photochem. Photobiol., A, 2018, 365, 232–237 CrossRef
.
- J. Tagare and S. Vaidyanathan, J. Mater. Chem. C, 2018, 6, 10138–10173 RSC
.
- Y. Sim, S. Kang, D. Shin, M. Park, K. Y. Kay and J. Park, Mol. Cryst. Liq. Cryst., 2019, 687, 27–33 CrossRef CAS
.
Footnote |
| † Electronic supplementary information (ESI) available. See DOI: 10.1039/d0ra10934g |
| This journal is © The Royal Society of Chemistry 2021 |

