
 Open Access Article
 This Open Access Article is licensed under a
 Creative Commons Attribution 3.0 Unported Licence
Palladium nanoparticle-decorated multi-layer Ti3C2Tx dual-functioning as a highly sensitive hydrogen gas sensor and hydrogen storage †
Thanh Hoang Phuong Doana,
Won G. Hongb and
Jin-Seo Noh *a
*a
aDepartment of Physics, Gachon University, 1342 Seongnamdaero, Sujeong-gu, Seongnam-si, Gyeonggi-do 13120, Korea. E-mail: jinseonoh@gachon.ac.kr; Tel: +82 317505611
bResearch Center for Materials Analysis, Korea Basic Science Institute (KBSI), Daejeon 34133, Korea
First published on 15th February 2021
Abstract
In this work, palladium nanoparticle (PdNP)-decorated Ti3C2Tx MXene (Pd–Ti3C2Tx) was synthesized by a simple two-step process. For this, multilayer Ti3C2Tx MXene (ML-Ti3C2Tx) was first prepared by a selective HF etching technique, and PdNPs were directly grown on the surface of ML-Ti3C2Tx flakes using a polyol method. The relative weight fraction of PdNPs to ML-Ti3C2Tx was elaborately controlled to derive the optimal size and distribution of PdNPs, thereby to maximize its performance as a hydrogen sensor. The optimized Pd–Ti3C2Tx nanocomposite showed superb hydrogen-sensing capability even at room temperature with sharp, large, reproducible, concentration-dependent, and hydrogen-selective responses. Furthermore, the nanocomposite also unveiled some extent of hydrogen storage capability at room temperature and 77 K, raising a possibility that it can dual-function as a hydrogen sensor and hydrogen storage.
1. Introduction
Nowadays, human activities produce an ever-increasing amount of greenhouse gases, which are generated mostly from the use of conventional fossil fuels. In order to reduce the emission of greenhouse gases, many countries around the world have strived to find alternative fuels, which are renewable and environment-friendly. Hydrogen gas (H2) is a promising fuel for energy generation due to its cleanliness, abundance, and recyclability.1 For this reason, H2 has recently emerged as a hot research topic, and is commercialized in various sectors such as transportation and local power generation.1,2The major challenges to tackle for the dissemination of hydrogen fuel include discovering a means to store hydrogen with high capacity and securing the safety from its potential leak.3–5 In particular, the safety issue is important because H2 is extremely flammable if its concentration is higher than 4% in air.6 Moreover, H2 is colorless and odorless, but very diffusive. These attributes underscore the importance of quick and sensitive detection of hydrogen leaks. Many hydrogen sensors have been developed towards good sensitivity and short response time, employing various nanomaterials.4 However, several drawbacks such as high operating temperature and complicated fabrication procedures still need to be improved.7–11 In this regard, a continued search for the better sensing materials and processing routes are necessary. Palladium (Pd) is one of the most popular H2-sensing materials due to its unique reaction with H2. Despite the good H2 selectivity and sensitivity, the response of bulk Pd is limited and it shows some brittleness when exposed to H2 repeatedly. To improve its response and relieve H2 brittleness, Pd nanostructures have been synthesized and further hybridized with other nanomaterials, including ZnO nanorods (NRs), SnO2 nanowires (NWs), graphene oxide (GO), and reduced graphene oxide (rGO).12–14 Among such nanomaterials, 2D materials attract renewed attention as a sensing platform due to their large surface area and directional charge transport. Other than carbon-based materials, MXenes are a class of noble 2D materials with intriguing structure and properties. Multi-layer Ti3C2Tx MXene (ML-Ti3C2Tx) has been widely used for gas sensing, owing to its facile synthesis route and strong interaction with gaseous molecules.15 In addition, it is highly conductive electrically, and its unique structure favors to reduce the electron transportation path distance.16 Therefore, combining the outstanding virtues of nanostructured Pd and ML-Ti3C2Tx may be an elaborate strategy to achieve high-performance H2 gas sensors.
Another challenge for the expanded use of H2 energy is to develop a safe hydrogen storage with high capacity. Today, compressing H2 under high pressure is the most conventional technology due to its cost advantage. However, the H2 storage capacity of the technology falls behind the general need, and a large volume or weight is required to contain enough H2.17 To address this issue, solid state storage media have been developed, including elemental metals, various alloys with formulas of AB, AB2, and AB5, alanates, and carbon materials.18 Pd can store H2 via PdH formation and supply H atoms to nearby medium by so-called “spill-over” mechanism.19 Moreover, the reactive termination groups and unique layered structure of ML-Ti3C2Tx may let this material considered for hydrogen storage.20
In this work, we developed a highly sensitive and selective hydrogen gas sensor by decorating Pd nanoparticles (PdNPs) on the surface of ML-Ti3C2Tx. Furthermore, it was demonstrated that the hydrogen gas sensor could also function as hydrogen storage. The dual functioning of the PdNPs-decorated ML-Ti3C2Tx (Pd–Ti3C2Tx) would give new insights into active hydrogen gas sensors, which can accommodate part of leaked H2 gas, thereby alleviating the potential explosion.
2. Experimental section
2.1 Materials
Ethylene glycol (C2H6O2, EG), polyvinylpyrrolidone (PVP, Mw ∼1![[thin space (1/6-em)]](https://www.rsc.org/images/entities/char_2009.gif) 300000), sodium tetrachloropalladate (II) (Na2PdCl4) were all purchased from Sigma-Aldrich (St. Louis, MO, USA). Ti3AlC2 powder (400 mesh) was purchased from 11 Technology Co., Ltd (Changchun, China). Hydrofluoric acid (HF, ∼50%) was purchased from Fisher Scientific (Fair Lawn, NJ, USA). Ethyl alcohol (C2H5OH) were purchased from Daejung Chem (Siheung, South Korea).
300000), sodium tetrachloropalladate (II) (Na2PdCl4) were all purchased from Sigma-Aldrich (St. Louis, MO, USA). Ti3AlC2 powder (400 mesh) was purchased from 11 Technology Co., Ltd (Changchun, China). Hydrofluoric acid (HF, ∼50%) was purchased from Fisher Scientific (Fair Lawn, NJ, USA). Ethyl alcohol (C2H5OH) were purchased from Daejung Chem (Siheung, South Korea).
2.2 Synthesis of ML-Ti3C2Tx and Pd–Ti3C2Tx
Fig. 1 depicts the whole process for the fabrication of Pd–Ti3C2Tx. First of all, ML-Ti3C2Tx was synthesized using the same methods with minor modifications as already published literatures.21,22 Al layers of Ti3AlC2 MAX phase were selectively etched using 50% HF. In more detail, a 4 g of Ti3AlC2 powder was slowly added to a plastic bottle containing 100 ml of HF, which was placed in an ice bath. Then, the colloidal solution was kept for 24 h at 50 °C under continuous stirring. At the next step, the etched product was washed using ethanol until the pH reached around 6. Finally, it was dried for 6 h in a convection oven at 60 °C.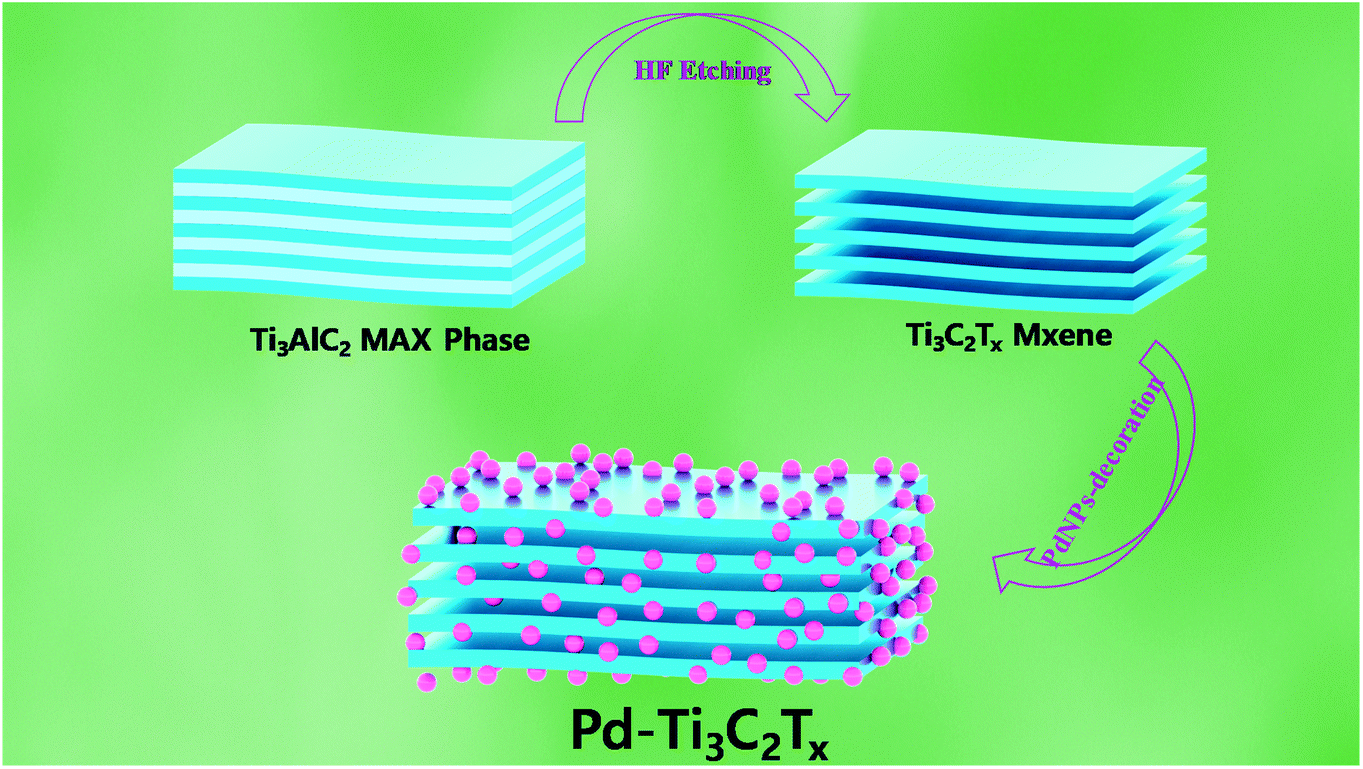 | ||
| Fig. 1 Schematic illustration of the sequential process for fabrication of ML-Ti3C2Tx and Pd–Ti3C2Tx. | ||
In order to decorate PdNPs on the surface of ML-Ti3C2Tx, we modified the process reported in the previous literatures.23,24 Firstly, ML-Ti3C2Tx flakes were dispersed over 10 min in a 50 ml vial containing 10 ml EG under ultrasonication, then this vial was placed in an oil bath at 160 °C for 2 h with stirring. Here, the weight of ML-Ti3C2Tx was controlled from 30, 60, to 90 mg. (from M1 to M3 sample, respectively). In the meantime, 8 ml of PVP solution (9.5 mM) and 4 ml of Na2PdCl4 solution (3.5 mM) were independently prepared using EG as a solvent. Next, these solutions were slowly injected into the ML-Ti3C2Tx colloidal solutions over a span of 30 min, followed by continuous stirring for additional 5 min. At the last step, the reaction products were washed 4 times using ethanol and dried for 6 h at 60 °C. The Pd–Ti3C2Tx samples were named M1 (30 mg), M2 (60 mg), and M3 (90 mg), respectively, depending on the weight of ML-Ti3C2Tx used for the nanocomposite formation.
2.3 Fabrication of hydrogen gas sensors
A silicon (Si) substrate of size in 1 cm × 2 cm was rinsed several times with ethanol and isopropyl alcohol (IPA) to remove organic and inorganic dirt on the surface, and then completely dried at 60 °C. At the same time, a 30 mg of Pd–Ti3C2Tx powder was dispersed into 5 ml of ethanol under sonication. This colloidal solution was drop-cast onto the surface of pre-cleaned Si substrate to form a H2-sensing film, then dried in an oven at 60 °C. Two contacts were made on the film using silver (Ag) paste for subsequent gold (Au) wiring to external electric units.2.4 Material characterization and gas-sensing tests
The morphologies of raw materials and Pd–Ti3C2Tx samples were investigated using a field emission scanning electron microscope (FE-SEM, JEOL JSM-7500F) mounted with an energy-dispersive X-ray spectrometer (EDX). The crystalline characteristics of samples were examined by X-ray diffraction (XRD, X'pert Pro MPD) with copper (Cu) Kα radiation. Furthermore, X-ray photoelectron spectroscopy (XPS, K-Alpha, Thermo Electron) was used to examine the binding states of ML-Ti3C2Tx and Pd–Ti3C2Tx samples.A unique-designed gas-sensing system was employed to evaluate the gas-sensing performance of the samples. For it, a sample was loaded into a gas chamber with a capacity of 682 cc and Au-wired to lead pins that were connected to an electrical source and measure unit outside the chamber. The chamber has branched channels with multiple gas sources, including H2 gas and synthetic air. The concentrations of target gases were controlled by a gas-mixing system, and the controlled gases were fed into the chamber at 500 cm3 min−1 using a mass flow controller (MFC). A Keithley 2450 multimeter was used to measure the variation of electrical resistance in response to target gases, and it was recorded in a computer through a LabView program. In this study, all gas-sensing tests were conducted at room temperature using air as a carrier gas. The response of a gas sensor was defined as
 | (1) |
2.5 Hydrogen storage test
The hydrogen storage capability of a Pd–Ti3C2Tx nanocomposite was tested using a H2 adsorption–desorption measurement system (Belsorp-HP, BEL Japan Inc.). In the test, the hydrogen storage capacity was measured volumetrically with a computer-controlled pressure-composition isotherm. The pressure was gradually increased up to 85 bar, and 99.9999% of H2 gas was used in all the measurements. The test was conducted at both room temperature and 77 K. To increase the credibility of the measurement, the system was calibrated with LaNi5 at room temperature, and with activated carbon (surface area ∼3000 m2 g−1) at 77 K.3. Results and discussion
3.1 Morphologies and compositions
Fig. 2 shows the SEM images of Ti3AlC2 MAX phase, ML-Ti3C2Tx MXene, and Pd–Ti3C2Tx nanocomposites. As can be seen in Fig. 2(a), Ti3AlC2 MAX phase is composed of microsheets, the side surfaces of which reveal slightly laminated pattern. After HF etching, the morphology is fully developed to an accordion-like laminated structure and Al content is greatly reduced to 3.2 at%, demonstrating the successful transformation from the MAX phase to ML-MXene (Fig. 2(b)). The atomic ratio of Ti to C is estimated at 1.36 from the SEM-EDX analysis (see the inset of Fig. 2(b)), which is close to the stoichiometric composition of Ti3C2Tx MXene. It is also found that a large amount of F termination group (28.23 at%) was formed during the HF etching process. Fig. 2(c)–(h) present the SEM images of Pd–Ti3C2Tx nanocomposites (M1, M2, and M3 samples in sequence). It is clear that PdNPs are evenly distributed on the side surfaces and clevaged surfaces of ML-Ti3C2Tx for all the samples. However, more detailed distribution turned to be dependent on the relative content of Pd precursor. For M1 sample (Pd content = 3.09 at%), free PdNPs that are not stuck to the Ti3C2Tx surface appear, and many PdNPs observed in between neighboring layers seem to be agglomerated. These may originate from the overdosed Pd precursor, and weaken the advantage of the layer-structured MXene, leading to the deterioration of its gas-sensing performance. On the contrary, both the size and density of PdNPs seem to be insufficient for M3 sample (Pd content = 0.53 at%), which most likely result from the underdosed Pd precursor. M2 sample can be singled out as the best sample from every aspect like the size, density, and distribution of PdNPs. For this sample, the Pd content is estimated at 1.1 at%. The uniform distribution of major elements in M2 sample can be found from SEM-EDX element maps (see Fig. S1†).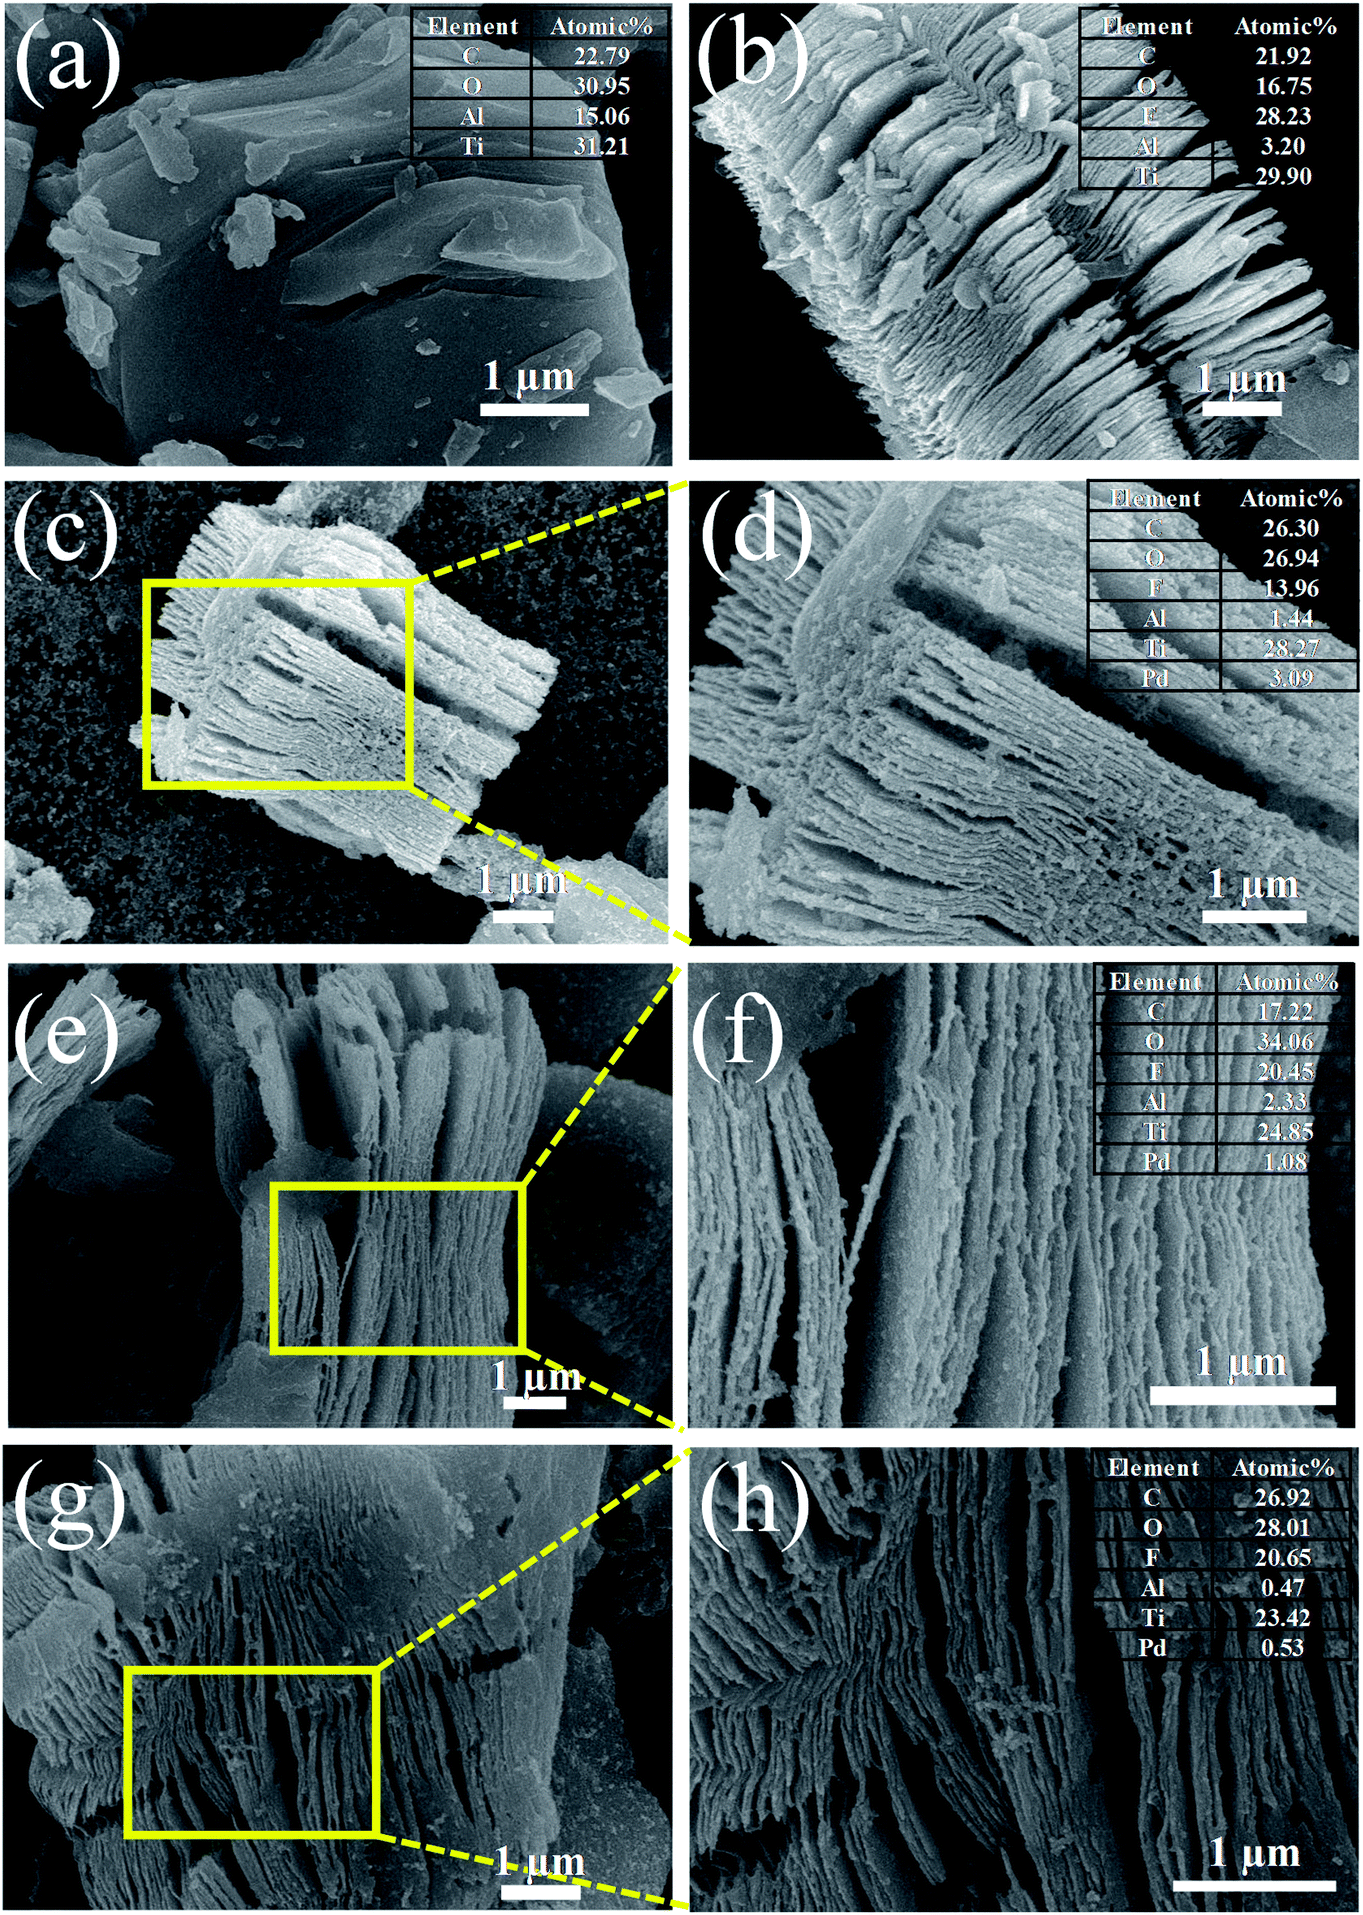 | ||
| Fig. 2 SEM images of (a) Ti3AlC2 MAX phase, (b) ML-Ti3C2Tx, (c and d) M1, (e and f) M2, and (g and h) M3 samples. The insets show the EDX elemental compositions of the respective samples. | ||
3.2 Crystal quality and binding states
In order to examine the crystal quality of the samples, XRD analysis was performed. Fig. 3 exhibits the XRD patterns of Ti3AlC2 MAX phase, ML-Ti3C2Tx MXene, Pd–Ti3C2Tx nanocomposites (M1, M2, and M3) from bottom to top. For ML-Ti3C2Tx, the strong peakest peak is observed at 2θ = 8.7°, which is indexed to (002) plane of 2D MXene. This is shifted by 0.82° from the (002) peak position of its parent material, Ti3AlC2 MAX phase. Moreover, the peak widths were clearly broadened after transforming the MAX phase to ML-MXene. These XRD peak shift and broadening are typical signals representing the full transformation of MAX phase to 2D MXene.25,26 Once PdNPs are decorated on the surface of ML-Ti3C2Tx, Pd peaks appear along with the MXene peaks. For instance, a peak found at 2θ = 40.1° is assigned to (111) plane of fcc Pd (JCPDS card no. 05-0681).27 However, the peak intensity of M1 sample looks excessive as compared to the (002) intensity of MXene, representing PdNPs are overly decorated, which is the same conclusion as derived from SEM observations. In contrast, the (111) peak intensity is too weak for M3 sample, while a TiC peak appears at 2θ = 35.94° as the main phase.28 The TiC peak intensity tends to increase as the relative weight fraction of ML-MXene increases. Just like the previous conclusion, the M2 sample shows the most desirable XRD pattern.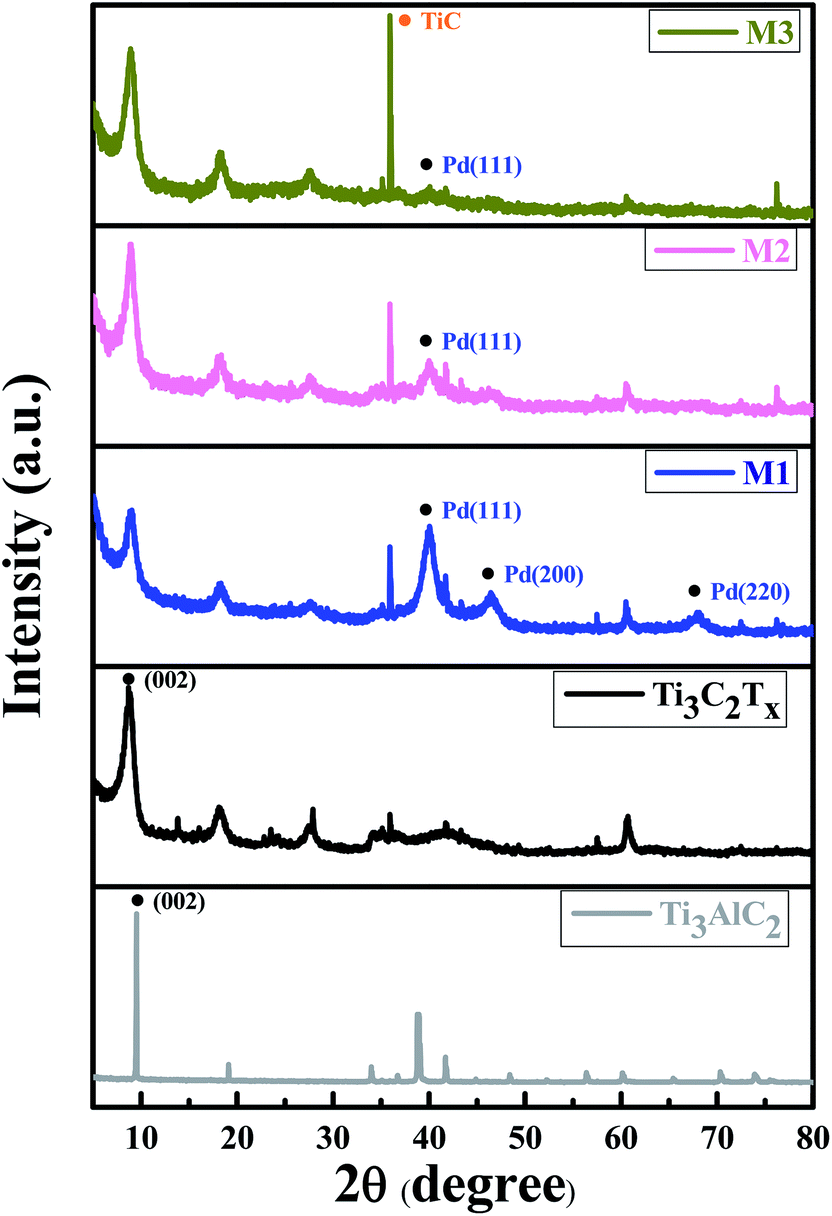 | ||
| Fig. 3 XRD patterns of Ti3AlC2 MAX phase, ML-Ti3C2Tx, and three nanocomposite samples (M1, M2, and M3). | ||
The binding states of pure ML-MXene and a nanocomposite sample were analyzed and compared using XPS. Fig. 4(a) shows the XPS full spectra of ML-Ti3C2Tx and Pd–Ti3C2Tx (M2 sample). Both samples contain C, Ti, O, and F elements, as expected from SEM-EDX data. The clear difference between the two samples can be found from the additional Pd3d and N1s peaks. The Pd3d and N1s peaks are observed only in M2 sample, which are arisen from PdNPs and remanent PVP stabilizer used in the PdNP formation step. The small amount of remanent PVP may accelerate the adsorption and desorption processes of H2 molecules due to the reduction of the apparent activation barriers, leading to the improved performance of our hydrogen gas sensors.29–31 Element-specific XPS spectra of M2 sample were further analyzed. The Ti2p spectrum in Fig. 4(b) shows two major peaks centered at 463.0 and 457.3 eV, which are assigned to (OH, or O)–Ti–C bond and (OH, or O)–Ti2+–C bond, respectively.32 This indicate that the ML-Ti3C2Tx surface is functionalized by –OH or ![[double bond, length as m-dash]](https://www.rsc.org/images/entities/char_e001.gif) O groups after PdNP decoration step. These functional groups may help the nanocomposite to adsorb gas molecules easily. Likewise, the C1s spectrum consists of three main peaks at 283.2, 284.5, and 286.3 eV (Fig. 4(c)), which represent C–Ti–Ox, C–C, and C–O bonds, respectively.33,34 This result further supports the presence of surface functional groups. From the fact that the C–O bond is not observed in pure ML-Ti3C2Tx MXene (see Fig. S2†), its appearance in M2 sample is inferred to result from the surface oxidation during PdNP decoration. Such bonds as C–O and (OH, or O)–Ti2+–C may be responsible for the conductivity decrease observed after decorating PdNPs on ML-Ti3C2Tx MXene. Regarding O1s, three peaks are found at 528.6, 530, and 531.2 eV, which correspond to Ti–O, TiO2, and C–Ti–Ox, respectively.32,35 Furthermore, two sharp Pd3d peaks (Pd3d5/2 and Pd3d3/2) are observed at the binding energies of 333.5 and 338.8 eV. The energy difference of 5.3 eV between the two peaks is quite close to the previous reports.25 Meanwhile, the Pd3d5/2 and Pd3d3/2 peak positions of the nanocomposite are shifted from those of pure Pd metal (334.88 eV for Pd3d5/2 and 340.25 eV for Pd3d3/2),36,37 due to the interaction of PdNPs and ML-Ti3C2Tx MXene.
O groups after PdNP decoration step. These functional groups may help the nanocomposite to adsorb gas molecules easily. Likewise, the C1s spectrum consists of three main peaks at 283.2, 284.5, and 286.3 eV (Fig. 4(c)), which represent C–Ti–Ox, C–C, and C–O bonds, respectively.33,34 This result further supports the presence of surface functional groups. From the fact that the C–O bond is not observed in pure ML-Ti3C2Tx MXene (see Fig. S2†), its appearance in M2 sample is inferred to result from the surface oxidation during PdNP decoration. Such bonds as C–O and (OH, or O)–Ti2+–C may be responsible for the conductivity decrease observed after decorating PdNPs on ML-Ti3C2Tx MXene. Regarding O1s, three peaks are found at 528.6, 530, and 531.2 eV, which correspond to Ti–O, TiO2, and C–Ti–Ox, respectively.32,35 Furthermore, two sharp Pd3d peaks (Pd3d5/2 and Pd3d3/2) are observed at the binding energies of 333.5 and 338.8 eV. The energy difference of 5.3 eV between the two peaks is quite close to the previous reports.25 Meanwhile, the Pd3d5/2 and Pd3d3/2 peak positions of the nanocomposite are shifted from those of pure Pd metal (334.88 eV for Pd3d5/2 and 340.25 eV for Pd3d3/2),36,37 due to the interaction of PdNPs and ML-Ti3C2Tx MXene.
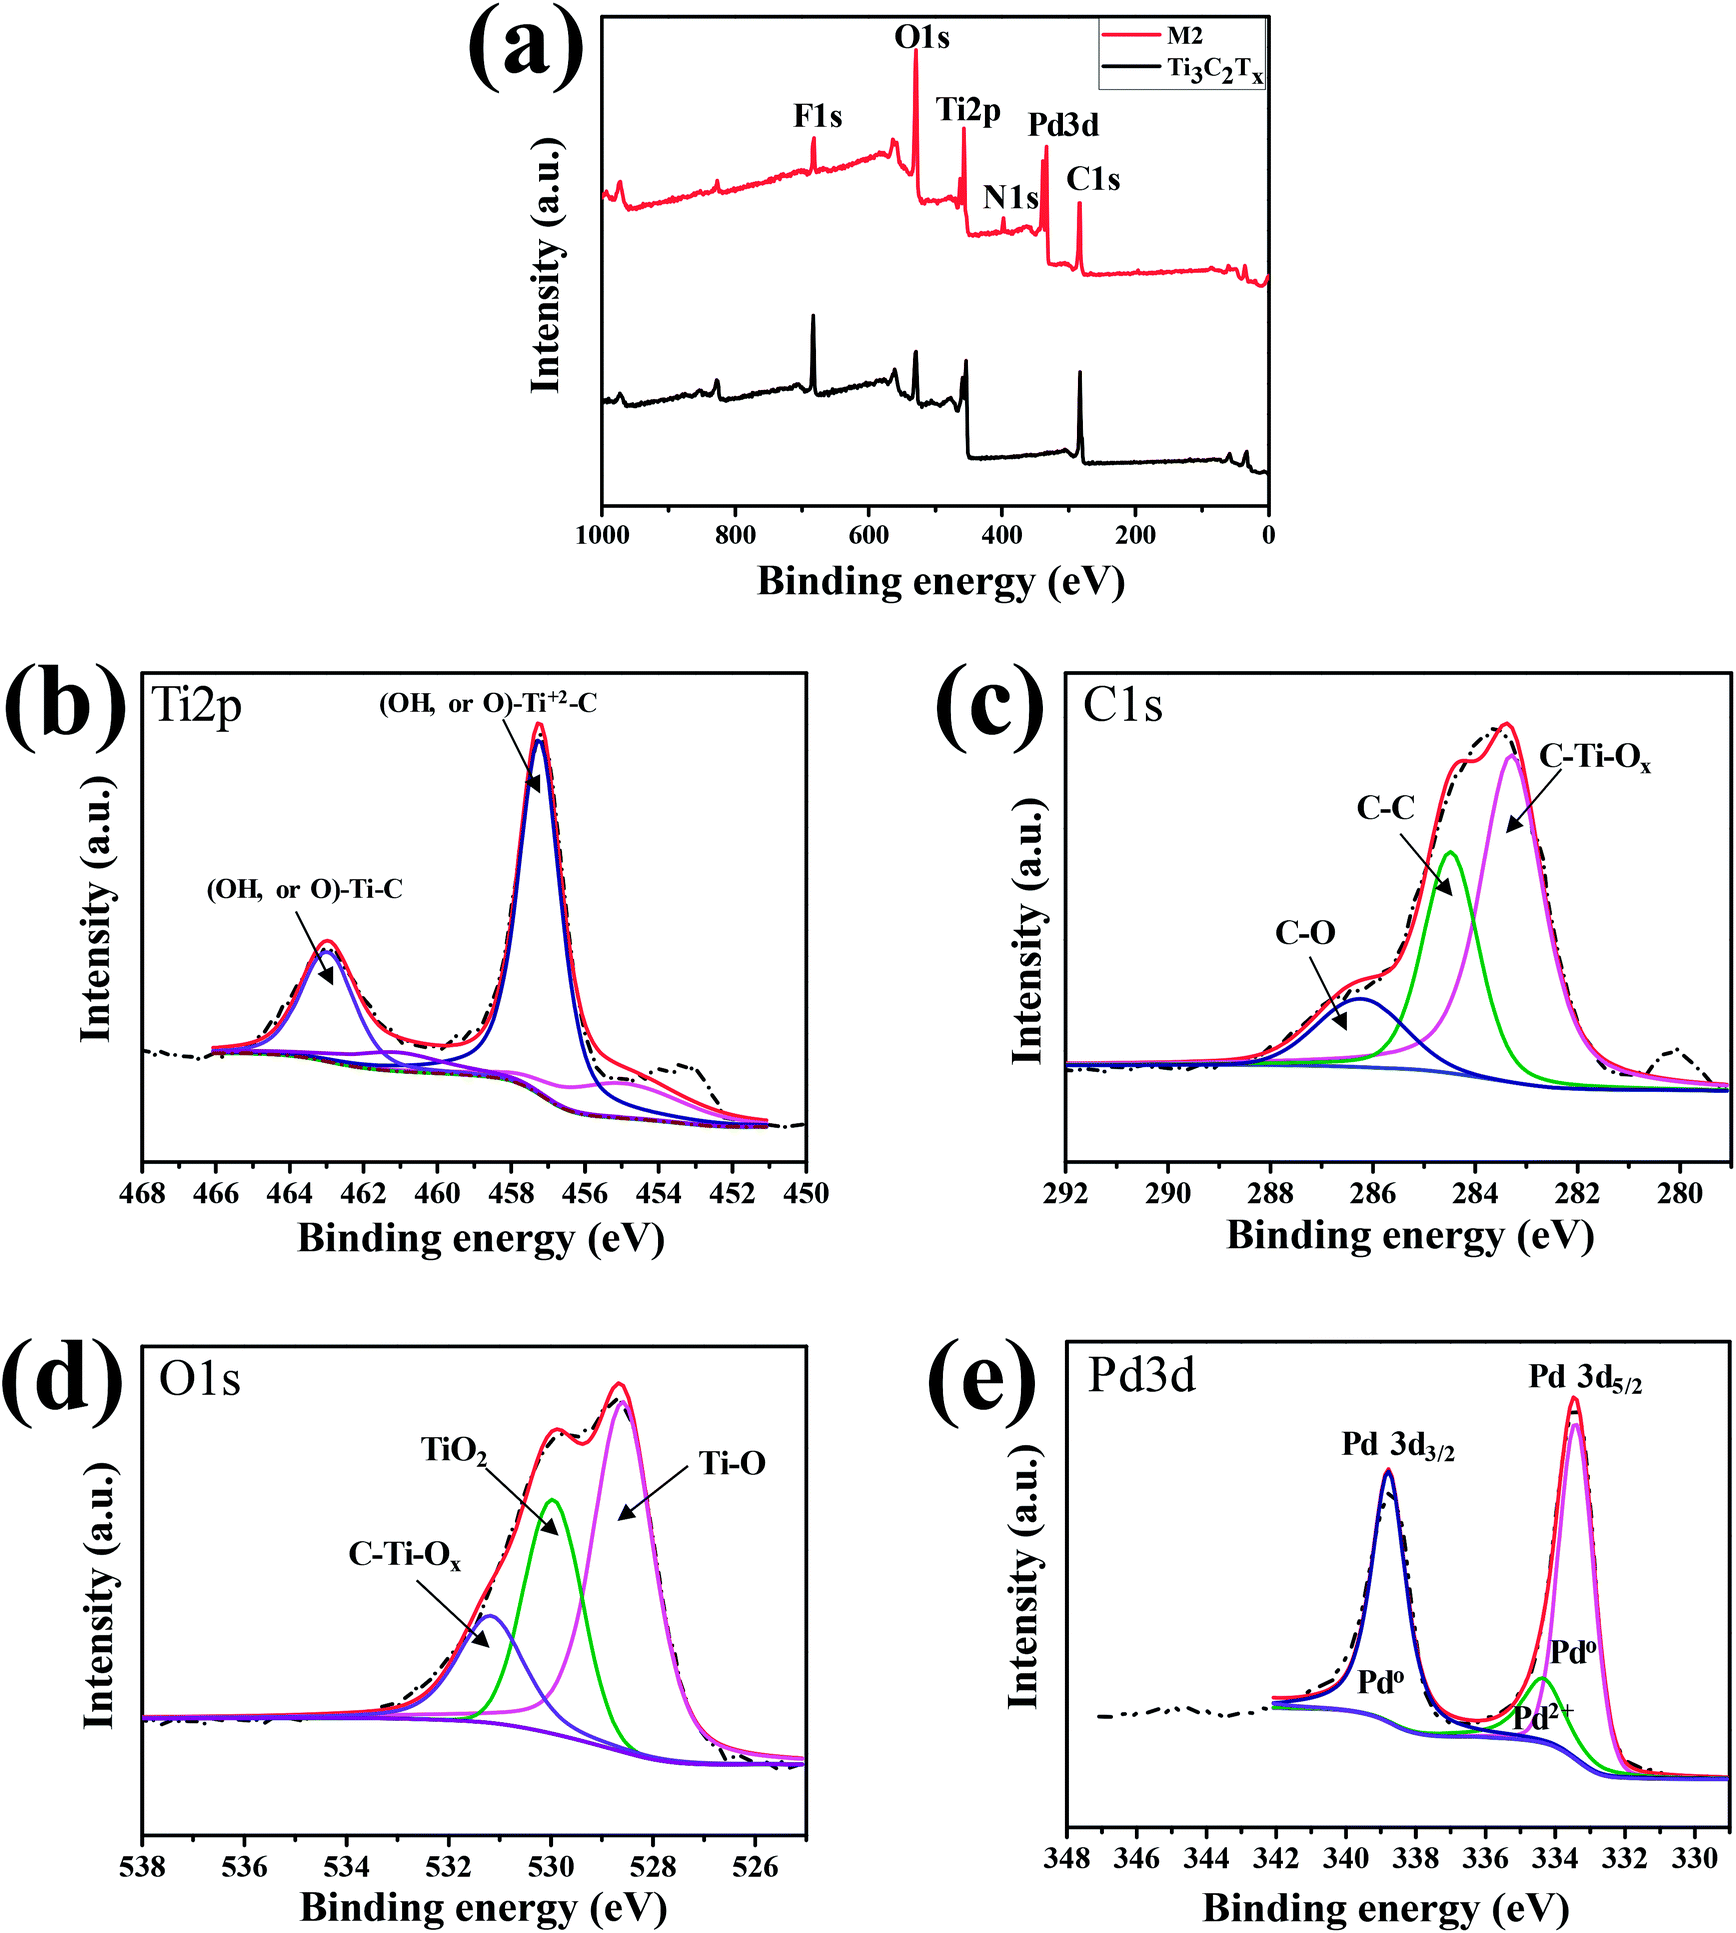 | ||
| Fig. 4 (a) Full XPS spectra of ML-Ti3C2Tx and M2 sample. XPS spectra of M2 focused on (b) Ti2p, (c) C1s, (d) O1s, and (e) Pd3d. | ||
3.3 H2-sensing performance and gas selectivity
The H2-sensing capability of Pd–Ti3C2Tx nanocomposites was evaluated at room temperature. To see the effect of the relative content of PdNPs, we first examined the H2-sensing performance of M1, M2, and M3 samples. As displayed in Fig. 5(a), M1 sample exhibits noisy and negative response. The negative response may be attributed to the high density of PdNPs in the sample. PdNPs generally experience a volume expansion on adsorbing H2, and can be locally connected when they are spaced close enough, leading to the formation of current path. The high density of PdNPs also have a MXene-screening effect, which limits the involvement of the MXene layer in H2-sensing process. On the other hand, both M2 and M3 samples show positive response signals (Fig. 5(b) and (c)), which are related to comparatively lower PdNP densities. Comparing the H2-sensing performance of the two samples, M2 is superior to M3 sample in terms of the clarity of signal, magnitude of response, and the degree of recovery. The M2 sample shows clean, large, fully recovered, and completely concentration-dependent response signals. For example, the response of the sample to 100 ppm of H2 is calculated to be 56%. In comparison, the rather noisy signal of M3 sample underlines the importance of combining PdNPs and ML-Pd–Ti3C2Tx with a golden ratio. Cyclic response test was further performed on the M2 sample, and the result is presented in Fig. 5(d). For this test, a 50 ppm of H2 gas was flowed for 10 min followed by 20 min-long air purging, and this cycle was repeated five times. Clear, sharp, and uniformly cyclic response curves are surely observed, demonstrating its excellent H2-sensing stability. Furthermore, the H2-sensing performance of the best sample (M2) was compared with previous reports in Table 1. It is obvious from the table that our H2 sensor has comparative advantages. Of course, some sensors have demonstrated larger responses, but their operating temperatures were in general higher than 100 °C. Moreover, the material combination of Pd and Ti3C2Tx MXene has been developed by Zhu et al.,25 employing a sonication technique of Pd nanocluster and Ti3C2Tx MXene suspension. However, its H2-sensing response (23%) was smaller than ours, even though a higher concentration of H2 (4%) was used for the test. Moreover, our H2 sensor shows good long-term stability, as demonstrated in Fig. S3.† Clean and sharp response signals are reproduced even after keeping the sensor for 90 days at ambient condition.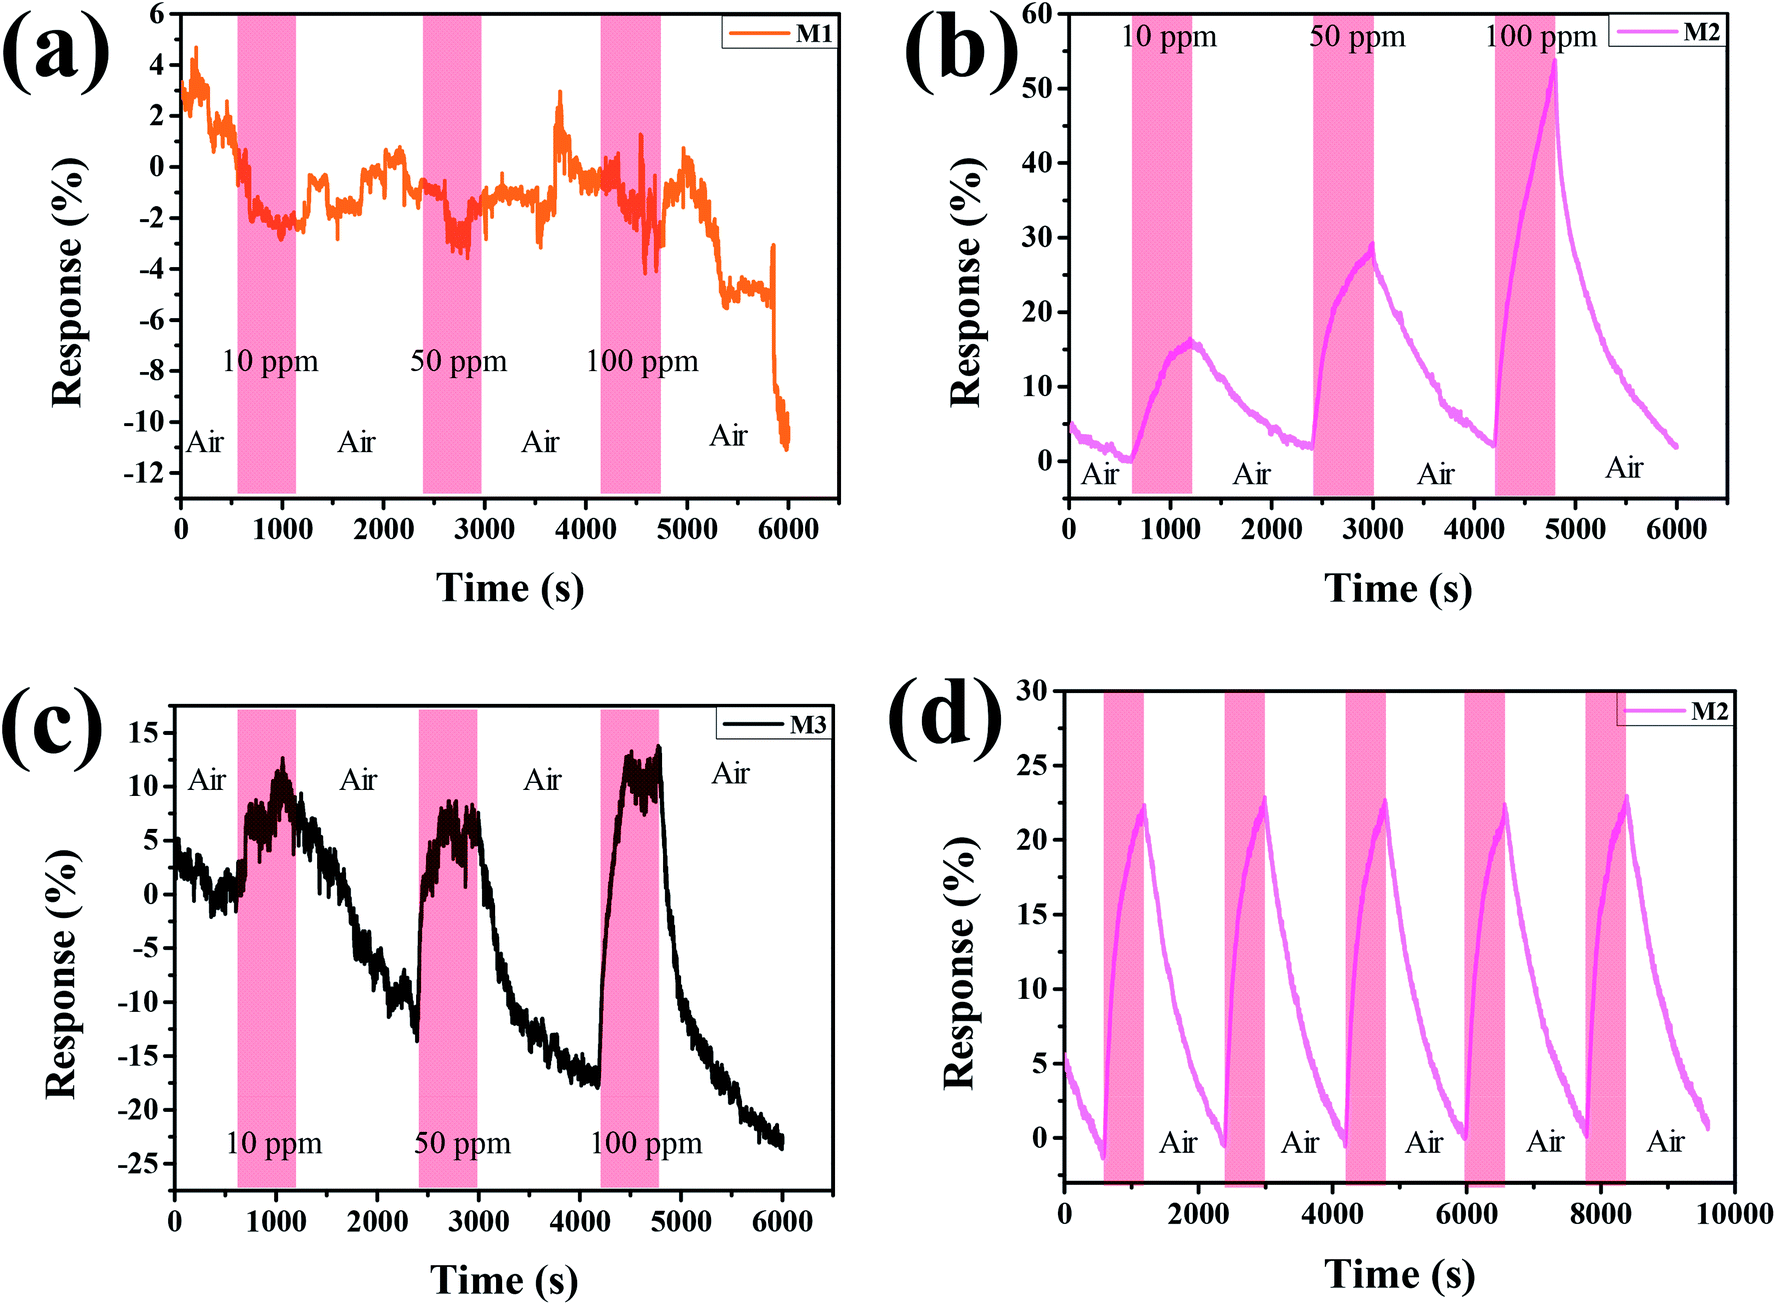 | ||
| Fig. 5 H2 concentration-dependent response curves of (a) M1, (b) M2, and (c) M3. (d) Cyclic responses of M2 to a 50 ppm of H2 gas. | ||
| Materials | H2 concentration | Operating temperature (°C) | Responsea (%) | Reference |
|---|---|---|---|---|
| a The responses were read from the figures of publications; they might be not precise. | ||||
| Pd–Ti3C2Tx | 100 ppm | RT | 56 | This work |
| SnO2/Pd | 100 ppm | 300 | 56 | 38 |
| MoS2–Pt NPs | 100 ppm | 150 | 90 | 39 |
| PdO-decorated p-type CoV2O6 NPs | 30000 ppm |
300 | 114 | 40 |
| 3D layer-by-layer Pd–Pt–Au | 2% | RT | 6.94 | 41 |
| Ti3C2Tx MXene@Pd colloidal nanoclusters | 4% | RT | 23 | 25 |
| V2CTx MXene | 100 ppm | RT | 24 | 42 |
| Pd/boron nitride/ZnO NWs | 10 ppm | 200 | 86 | 43 |
| Pd/MWCNT | 4% | RT | 12.3 | 44 |
In addition, we examined the response behaviors of Pd–Ti3C2Tx to other kinds of toxic gases. Fig. 6(a)–(c) show the response curves of M2 sample to 100 ppm of CH4, NH3, and NO2, respectively. For every gas, the response curves are not well developed with small response values, although the sign of response is dependent on the type of gas. The response (∼5%) to NO2 gas is slightly larger than the other gases, but the signal is not recovered to its original level after stopping the gas flow. A swift change of response curve is found for CH4 gas. However, the response (∼1%) to CH4 is too small. Fig. 6(d) compares the responses of M2 to H2, NO2, NH3, and CH4 at the fixed concentration of 100 ppm. This comparison manifests that the optimal-designed Pd–Ti3C2Tx nanocomposite is well suited for detecting H2 gas with high gas selectivity.
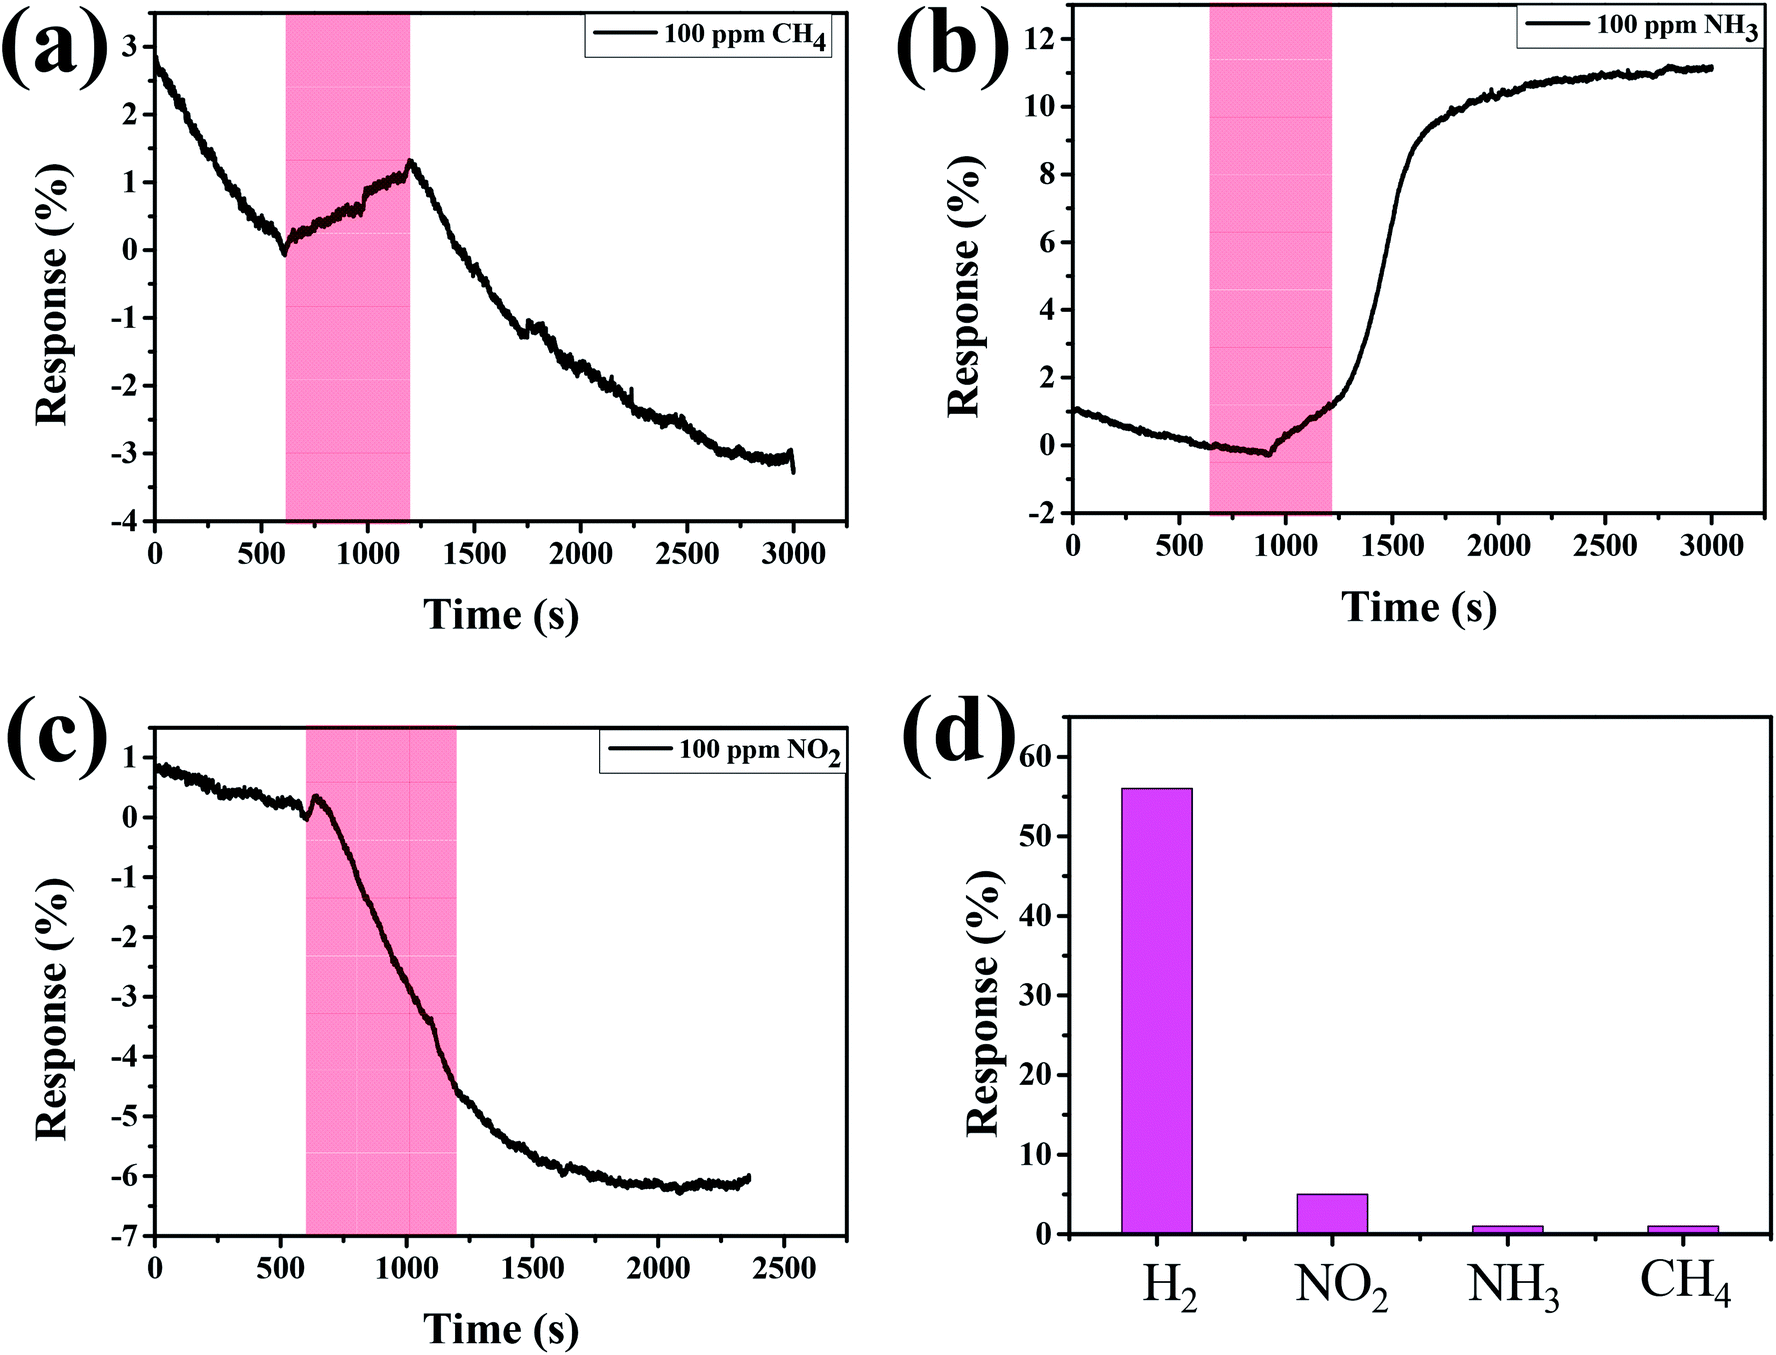 | ||
| Fig. 6 Response curves of M2 sample to 100 ppm of (a) CH4, (b) NH3, and (c) NO2. (d) Comparison of responses of M2 sample to different gases at the concentration of 100 ppm. | ||
To explain the superb H2-sensing capability of Pd–Ti3C2Tx, a potential mechanism is suggested. The nanocomposite detects H2 gas by the collaborative activities of PdNPs and ML-Ti3C2Tx, as schematically depicted in Fig. 7. When exposed to H2 gas, PdNPs adsorb H2 molecules and dissociate them into H atoms, leading to the formation of PdH.45–47 This process is facilitated by the catalytic nature of Pd, and consequently increases the material's resistance. PdNPs can also play a role to supply H atoms to nearby ML-Ti3C2Tx via a spill-over mechanism. The transferred H atoms can react with transition metals (Ti in this case) on the surface of ML-Ti3C2Tx, forming TiH2. This leads to a further increase in the sensor resistance. A similar phenomenon has been previously reported in Ti-decorated carbon nanotubes, where dissociated H atoms were adsorbed by Ti atoms without any energy barrier.48 When the Pd content is excessive (M1 sample), the role of ML-Ti3C2Tx is limited, whereas the contribution of PdNPs is reduced in the opposite situation (M3 sample). Thus, a search for the golden combination of PdNPs and ML-Ti3C2Tx is of critical importance, as demonstrated by M2 sample. To the best of our knowledge, the aforementioned oxygen-containing groups such as C–O, C–Ti–O, and C–Ti–OH do not have any strong chemical reaction with H2 molecules or H atoms. Instead, they can strengthen the atomic-scale bonding between PdNPs and Ti3C2Tx MXene, thereby improving the H spill-over efficiency and H2 adsorption. Chung et al. demonstrated that the diffusion of spilt-over H atoms could be enhanced by the oxygen functional groups. They concluded that the spill-over enhancement linearly increased with the content of oxygen groups for the samples with sufficiently high oxygen concentrations.49
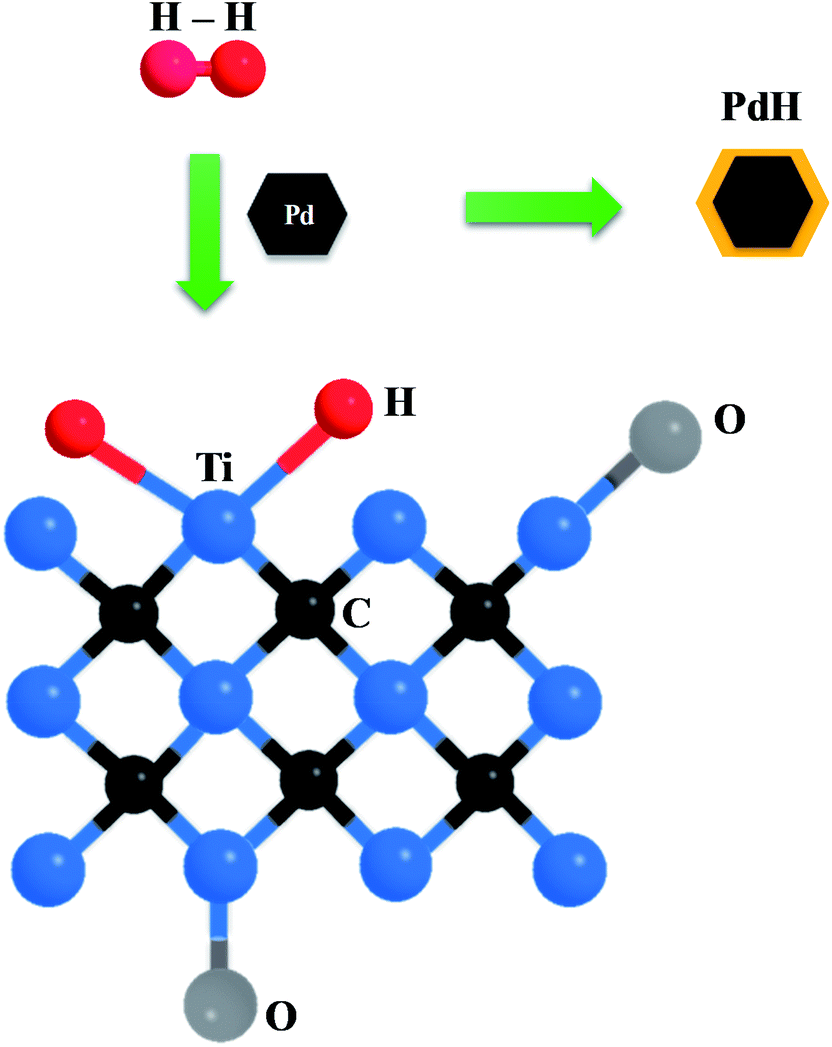 | ||
| Fig. 7 Schematic picture for illustrating the H2-sensing mechanism of the Pd–Ti3C2Tx nanocomposite. | ||
3.4 Hydrogen storage characteristics
We performed hydrogen storage test on a Pd–Ti3C2Tx nanocomposite (M2 sample) by measuring the volumetric change under varying pressure at a fixed temperature. The test was taken at both room temperature and liquid nitrogen temperature (77 K). Fig. 8(a) shows the cyclic H2 adsorption–desorption isotherms of the sample at room temperature. The amount of stored H2 is small, and it tends to gradually increase as the number of cycles increases. The maximum H2 uptake is estimated at 0.11%. The H2 adsorption–desorption behavior is greatly improved at 77 K, as shown in Fig. 8(b). Clear adsorption and desorption curves are observed. Impressively, the two curves are almost superposed with negligible hysteresis, which is an ideal feature required for stable and repeated loading and disloading of H2. The largest H2 uptake is 0.46% at 7.46 MPa. Although this H2 uptake is far lower than those of well-developed storage media, the results suggest that the Pd–Ti3C2Tx nanocomposite can also play as a hydrogen storage. In fact, there have been rare reports on the hydrogen storage capability of Ti3C2Tx MXene. As an example, Chen et al. demonstrated that Ti3C2 MXene might enhance the hydrogen storage performance of MgH2–LiAlH4 composite as an ancillary material.50 In contrast, ML-Ti3C2Tx MXene is a main component of Pd–Ti3C2Tx for hydrogen storage. Its surface functional groups like –OH andO are helpful for hydrogen adsorption, and surface Ti atoms may react easily with H atoms to form TiH2.48 Furthermore, PdNPs can assist the H2 adsorption process by the aforementioned spill-over mechanism.51 For these reasons, the hydrogen storage capability of the nanocomposite may be further improved.
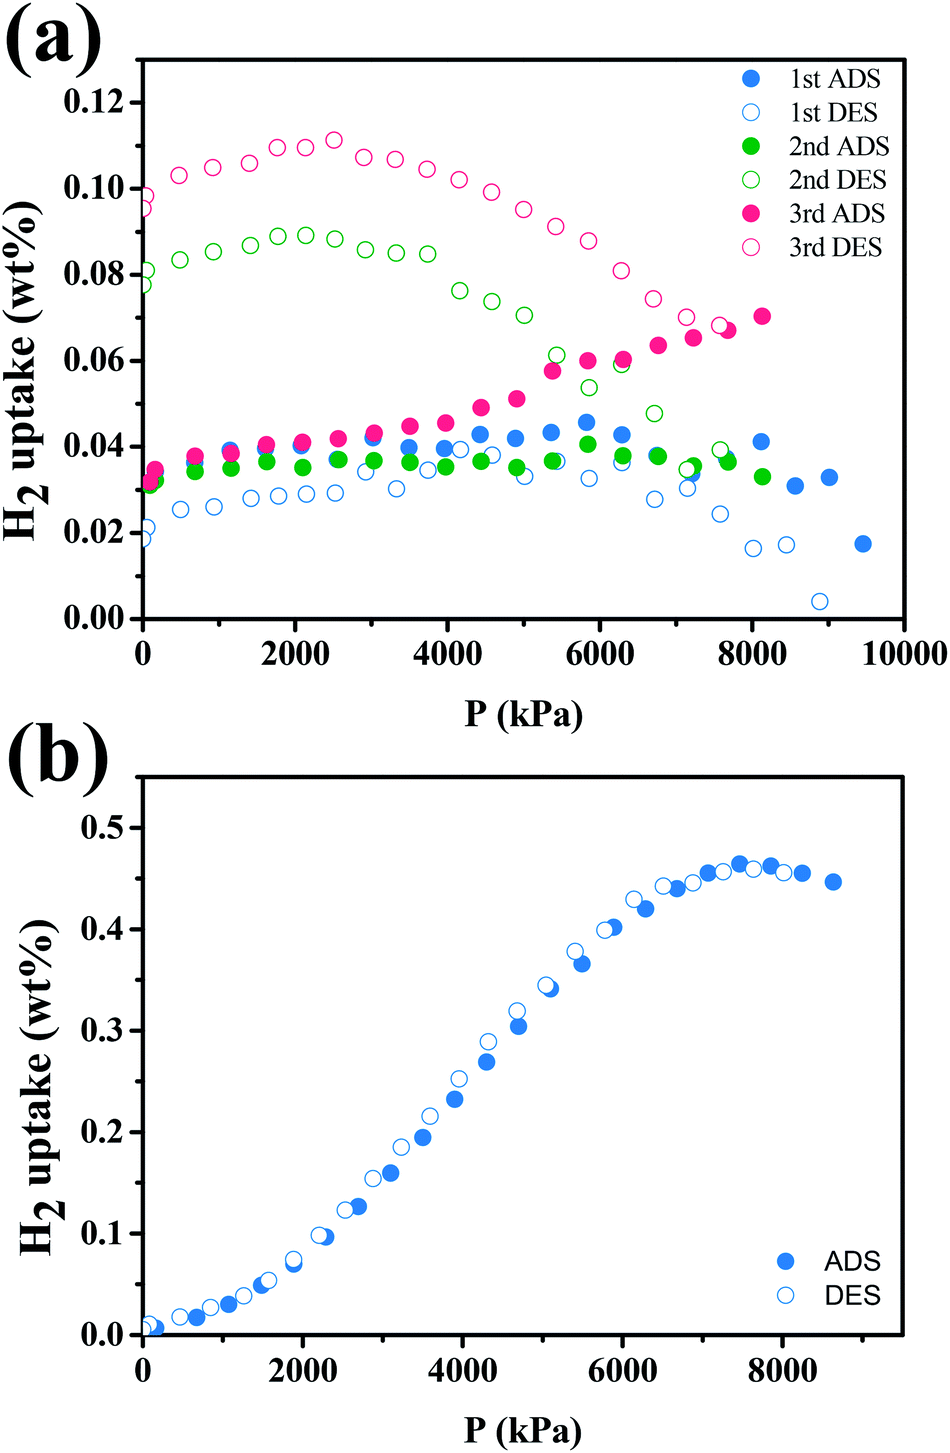 | ||
| Fig. 8 Hydrogen storage capacity of the M2 sample at (a) room temperature and (b) 77 K. | ||
4. Conclusions
Pd–Ti3C2Tx nanocomposite was synthesized by a facile two-step process. ML-Ti3C2Tx MXene was first fabricated by the HF etching of MAX phase, then PdNPs were directly decorated on the surface of ML-Ti3C2Tx using a polyol method. The average size and distribution of PdNPs were disclosed to depend on the relative weight fraction of Pd used for the PdNP formation. The material combinations of ML-Ti3C2Tx and PdNPs were tuned to find the optimal Pd–Ti3C2Tx nanocomposite. The optimal Pd–Ti3C2Tx turned out to sense H2 gas at room temperature with sharp, large, and concentration-dependent responses and full recovery. Furthermore, it showed high selectivity to H2 gas, demonstrating its potential as an ideal H2 gas sensor. In addition, the Pd–Ti3C2Tx nanocomposite exhibited clean and hysteresis-free H2 adsorption–desorption curves at 77 K, indicating that the nanocomposite could also play as a hydrogen storage.Conflicts of interest
The authors declare that they have no conflict of interest.Acknowledgements
This work was supported by the National Research Foundation of Korea (NRF) grant funded by the Korea government (MSIT) (No. 2019R1A2C1008746). This work was also supported by the Gachon University research fund of 2019 (GCU-2019-0799).Notes and references
- J. O. Abe, A. P. I. Popoola, E. Ajenifuja and O. M. Popoola, Int. J. Hydrogen Energy, 2019, 44, 15072–15086 CrossRef CAS.
- I. R. E. A. Irena, Hydrogen: A Renewable Energy Perspective – Report prepared for the 2nd Hydrogen Energy Ministerial Meeting in Tokyo, Japan, 2019 Search PubMed.
- J. Andersson and S. Grönkvist, Int. J. Hydrogen Energy, 2019, 44, 11901–11919 CrossRef CAS.
- P. S. Chauhan and S. Bhattacharya, Int. J. Hydrogen Energy, 2019, 44, 26076–26099 CrossRef CAS.
- Y. Kojima, Int. J. Hydrogen Energy, 2019, 44, 18179–18192 CrossRef CAS.
- C. C. Ndaya, N. Javahiraly and A. Brioude, Sensors, 2019, 19, 4478 CrossRef CAS.
- J. Hu, Y. Sun, Y. Xue, M. Zhang, P. Li, K. Lian, S. Zhuiykov, W. Zhang and Y. Chen, Sens. Actuators, B, 2018, 257, 124–135 CrossRef CAS.
- A. Sanger, A. Kumar, S. Chauhan, Y. K. Gautam and R. Chandra, Sens. Actuators, B, 2015, 213, 252–260 CrossRef CAS.
- A. Harley-Trochimczyk, J. Chang, Q. Zhou, J. Dong, T. Pham, M. A. Worsley, R. Maboudian, A. Zettl and W. Mickelson, Sens. Actuators, B, 2015, 206, 399–406 CrossRef CAS.
- R. Zhou, X. Lin, D. Xue, F. Zong, J. Zhang, X. Duan, Q. Li and T. Wang, Sens. Actuators, B, 2018, 260, 900–907 CrossRef CAS.
- M. Kandyla, C. Chatzimanolis-Moustakas, M. Guziewicz and M. Kompitsas, Mater. Lett., 2014, 119, 51–55 CrossRef CAS.
- R. D. Martínez-Orozco, R. Antaño-López and V. Rodríguez-González, New J. Chem., 2015, 39, 8044–8054 RSC.
- W.-T. Koo, S. Qiao, A. F. Ogata, G. Jha, J.-S. Jang, V. T. Chen, I.-D. Kim and R. M. Penner, ACS Nano, 2017, 11, 9276–9285 CrossRef CAS.
- D. H. Shin, J. S. Lee, J. Jun, J. H. An, S. G. Kim, K. H. Cho and J. Jang, Sci. Rep., 2015, 5, 12294 CrossRef.
- A. Sinha, Dhanjai, H. Zhao, Y. Huang, X. Lu, J. Chen and R. Jain, TrAC, Trends Anal. Chem., 2018, 105, 424–435 CrossRef CAS.
- T. B. Limbu, B. Chitara, J. D. Orlando, M. Y. Garcia Cervantes, S. Kumari, Q. Li, Y. Tang and F. Yan, J. Mater. Chem. C, 2020, 8, 4722–4731 RSC.
- R. Moradi and K. M. Groth, Int. J. Hydrogen Energy, 2019, 44, 12254–12269 CrossRef CAS.
- M. Hirscher, V. A. Yartys, M. Baricco, J. Bellosta von Colbe, D. Blanchard, R. C. Bowman, D. P. Broom, C. E. Buckley, F. Chang, P. Chen, Y. W. Cho, J.-C. Crivello, F. Cuevas, W. I. F. David, P. E. de Jongh, R. V. Denys, M. Dornheim, M. Felderhoff, Y. Filinchuk, G. E. Froudakis, D. M. Grant, E. M. Gray, B. C. Hauback, T. He, T. D. Humphries, T. R. Jensen, S. Kim, Y. Kojima, M. Latroche, H.-W. Li, M. V. Lototskyy, J. W. Makepeace, K. T. Møller, L. Naheed, P. Ngene, D. Noréus, M. M. Nygård, S. Orimo, M. Paskevicius, L. Pasquini, D. B. Ravnsbæk, M. Veronica Sofianos, T. J. Udovic, T. Vegge, G. S. Walker, C. J. Webb, C. Weidenthaler and C. Zlotea, J. Alloys Compd., 2020, 827, 153548 CrossRef CAS.
- E. Rangel, E. Sansores, E. Vallejo, A. Hernández-Hernández and P. A. López-Pérez, Phys. Chem. Chem. Phys., 2016, 18, 33158–33170 RSC.
- A. VahidMohammadi, E. Kayali, J. Orangi and M. Beidaghi, in 2D Metal Carbides and Nitrides (MXenes), Springer International Publishing, Cham, 2019, pp. 177–195 Search PubMed.
- R. Li, L. Zhang, L. Shi and P. Wang, ACS Nano, 2017, 11, 3752–3759 CrossRef CAS.
- M. Alhabeb, K. Maleski, B. Anasori, P. Lelyukh, L. Clark, S. Sin and Y. Gogotsi, Chem. Mater., 2017, 29, 7633–7644 CrossRef CAS.
- V. L. Nguyen, D. C. Nguyen, H. Hirata, M. Ohtaki, T. Hayakawa and M. Nogami, Adv. Nat. Sci.: Nanosci. Nanotechnol., 2010, 1, 035012 Search PubMed.
- T. H. P. Doan, Q. T. H. Ta, A. Sreedhar, N. T. Hang, W. Yang and J.-S. Noh, ACS Sens., 2020, 5, 2255–2262 CrossRef CAS.
- Z. Zhu, C. Liu, F. Jiang, J. Liu, X. Ma, P. Liu, J. Xu, L. Wang and R. Huang, J. Hazard. Mater., 2020, 399, 123054 CrossRef CAS.
- W. Yuan, K. Yang, H. Peng, F. Li and F. Yin, J. Mater. Chem. A, 2018, 6, 18116–18124 RSC.
- L. Xu, X.-C. Wu and J.-J. Zhu, Nanotechnology, 2008, 19, 305603 CrossRef.
- B. Scheibe, V. Kupka, B. Peplińska, M. Jarek and K. Tadyszak, Materials, 2019, 12, 353 CrossRef CAS.
- A. Stolaś, I. Darmadi, F. A. A. Nugroho, K. Moth-Poulsen and C. Langhammer, ACS Appl. Nano Mater., 2020, 3, 2647–2653 CrossRef.
- P. Ngene, R. J. Westerwaal, S. Sachdeva, W. Haije, L. C. P. M. de Smet and B. Dam, Angew. Chem., Int. Ed., 2014, 53, 12081–12085 CrossRef CAS.
- F. A. A. Nugroho, I. Darmadi, L. Cusinato, A. Susarrey-Arce, H. Schreuders, L. J. Bannenberg, A. B. da Silva Fanta, S. Kadkhodazadeh, J. B. Wagner, T. J. Antosiewicz, A. Hellman, V. P. Zhdanov, B. Dam and C. Langhammer, Nat. Mater., 2019, 18, 489–495 CrossRef CAS.
- Q. T. H. Ta, N. M. Tran and J. S. Noh, Catalysts, 2020, 10, 1–16 CrossRef.
- Y. Du, X. Zhang, L. Wei, B. Yu, D. Ma and S. Ye, Coatings, 2019, 9, 750 CrossRef CAS.
- J. Halim, K. M. Cook, M. Naguib, P. Eklund, Y. Gogotsi, J. Rosen and M. W. Barsoum, Appl. Surf. Sci., 2016, 362, 406–417 CrossRef CAS.
- N. My Tran, Q. Thanh Hoai Ta and J.-S. Noh, Appl. Surf. Sci., 2021, 538, 148023 CrossRef CAS.
- D. Zemlyanov, B. Aszalos-Kiss, E. Kleimenov, D. Teschner, S. Zafeiratos, M. Hävecker, A. Knop-Gericke, R. Schlögl, H. Gabasch, W. Unterberger, K. Hayek and B. Klötzer, Surf. Sci., 2006, 600, 983–994 CrossRef CAS.
- A. Sreedhar, I. N. Reddy, Q. T. Hoai Ta, G. Namgung, E. Cho and J.-S. Noh, Ceram. Int., 2019, 45, 6985–6993 CrossRef CAS.
- Z. Cai and S. Park, Sens. Actuators, B, 2020, 322, 128651 CrossRef CAS.
- S. R. Gottam, C.-T. Tsai, L.-W. Wang, C.-T. Wang, C.-C. Lin and S.-Y. Chu, Appl. Surf. Sci., 2020, 506, 144981 CrossRef CAS.
- M. Moschogiannaki, L. Zouridi, J. Sukunta, S. Phanichphant, E. Gagaoudakis, C. Liewhiran, G. Kiriakidis and V. Binas, Sens. Actuators, B, 2020, 324, 128744 CrossRef CAS.
- Z.-J. Zhao, J. Ko, J. Ahn, M. Bok, M. Gao, S. H. Hwang, H.-J. Kang, S. Jeon, I. Park and J.-H. Jeong, ACS Sens., 2020, 5, 2367–2377 CrossRef CAS.
- E. Lee, A. VahidMohammadi, Y. S. Yoon, M. Beidaghi and D.-J. Kim, ACS Sens., 2019, 4, 1603–1611 CrossRef CAS.
- M. Weber, J.-Y. Kim, J.-H. Lee, J.-H. Kim, I. Iatsunskyi, E. Coy, P. Miele, M. Bechelany and S. S. Kim, J. Mater. Chem. A, 2019, 7, 8107–8116 RSC.
- K. Yan, Y. Toku, Y. Morita and Y. Ju, Nanotechnology, 2018, 29, 375503 CrossRef.
- A. Kolmakov, D. O. Klenov, Y. Lilach, S. Stemmer and M. Moskovitst, Nano Lett., 2005, 5, 667–673 CrossRef CAS.
- Y. Peng, J. Ye, L. Zheng and K. Zou, RSC Adv., 2016, 6, 24880–24888 RSC.
- O. Lupan, V. Postica, F. Labat, I. Ciofini and T. Pauporté, Sens. Actuators, B, 2018, 254, 1259–1270 CrossRef CAS.
- T. Yildirim and S. Ciraci, Phys. Rev. Lett., 2005, 94, 1–4 CrossRef.
- T.-Y. Chung, C.-S. Tsao, H.-P. Tseng, C.-H. Chen and M.-S. Yu, J. Colloid Interface Sci., 2015, 441, 98–105 CrossRef CAS.
- G. Chen, Y. Zhang, H. Cheng, Y. Zhu, L. Li and H. Lin, Chem. Phys., 2019, 522, 178–187 CrossRef CAS.
- R. Kumar, J.-H. Oh, H.-J. Kim, J.-H. Jung, C.-H. Jung, W. G. Hong, H.-J. Kim, J.-Y. Park and I.-K. Oh, ACS Nano, 2015, 9, 7343–7351 CrossRef CAS.
Footnote |
| † Electronic supplementary information (ESI) available. See DOI: 10.1039/d0ra10879k |
| This journal is © The Royal Society of Chemistry 2021 |