 Open Access Article
A modified random network model for P2O5–Na2O–Al2O3–SiO2 glass studied by molecular dynamics simulations†
Yaxian Zhaoa,
Jincheng Du b,
Xin Caoc,
Chong Zhangc,
Gang Xu
 a,
Xvsheng Qiao
 a,
Yong Liu*a,
Shou Pengc and
Gaorong Hana
aState Key Laboratory of Silicon Materials, School of Materials Science and Engineering, Zhejiang University, Hangzhou 310027, China. E-mail: liuyong.mse@zju.edu.cn; Fax: +86 571 87951842; Tel: +86 571 87951842
bDepartment of Materials Science and Engineering, University of North Texas, Denton, Texas 76203-5017, USA
c(CNBM) Bengbu Design & Research Institute for Glass Industry Co., Ltd., No. 1047, Tushan Road, Bengbu City, Anhui Province, China
First published on 10th February 2021
Abstract
We investigated the short- and medium-range structural features of sodium aluminosilicate glasses with various P2O5 (0–7 mol%) content and Al/Na ratios ranging from 0.667 to 2.000 by using molecular dynamics simulations. The local environment evolution of network former cations (Si, Al, P) and the extent of clustering behavior of modifiers (Na+) is determined through pair distribution function (PDF), total correlation function (TDF), coordination number (CN), Qxn distribution and oxygen speciation analysis. We show that Al–O–P and Si–O–Al linkage is preferred over other connections as compared to a random model and that Si–O–Si linkage is promoted by the P2O5 addition, which is related to structural heterogeneity and generates well-separated silicon-rich and aluminum–phosphorus-rich regions. Meanwhile, due to the relatively high propensity of Al to both Si and P, heterogeneity can be partly overcome with high Al content. A small amount of Si–O–P linkages have been detected at the interface of separated regions. Clustering of Na+ is also observed and intensified with the addition of P2O5. Based on the simulated structural information, a modified random network model for P2O5-bearing sodium aluminosilicate glass has been proposed, which could be useful to optimize the mobility of sodium ions and design novel functional glass compositions.
1 Introduction
Chemical strengthening, achieved by ion exchange through immersing an alkali-containing glass into a molten salt bath, generates high compressive stress in thin or irregular shaped glass objects without measurable optical distortion, making it one of the most important techniques of glass strengthening methods.1 Sodium aluminosilicate glasses (NAS) are suitable for ion exchange strengthening and currently receive significant interest not only because of their excellent mechanical properties and chemical durability, leading to wide applications in touch-screen displays,2 windshields,3,4 and architectures,5,6 but also because they can serve as a good model system to introduce a wide range of oxides for tailoring their properties.7–11 Among these oxide additions, P2O5 has been recently studied and found to be able to increase the hardness, compressive stress and depth of ion-exchange layer by causing depolymerized silicate anions.12Phosphorus pentoxide (P2O5), even with a very small addition, is known to play an important role in aluminosilicate glass system and can impact the physical and chemical properties.13,14 The immiscibility of phosphate-rich and silicate-rich phases caused by P2O5 addition is also observed,15,16 accounting for crystallization after further thermal treatment. The 31P MAS NMR study of the P2O5 containing NAS glasses with a molar ratio of Al/Na ranging from 0 to about 1.27 shows that in peralkaline region P2O5 is partly present as phosphate tetrahedra attached to the aluminosilicate network charge balanced by sodium, while in peraluminous region it integrated into the glass former network as monomeric tetrahedra for which all three available single bonded oxygens are connected to tetrahedrally coordinated Al.17 In lithium aluminosilicate system, the P, Al and Si local environment investigations also show that P is mainly presented as orthophosphate and pyrophosphate species with a low amount of Al2O3 and gradually enters the Si and Al based glass forming network with increasing molar ratio of Al2O3/Li2O.18 While in metaluminous sodium aluminosilicate glasses, P is found to mainly integrate into the glass network via P–O–Al bonding because of the alternative charge compensation scheme for [AlO4]− and [PO4]+ units, and the formation of Si–O–P bonding played only a minor role.19 Although these experimental results provide valuable information for distinguishing the topology of the glassy states with phosphorus, fully understanding the structural change aluminosilicate glasses due to P2O5 and associated ion exchange strengthening still remains a grand challenge.
In the past few decades, the structure models for oxide glasses have been developed. The basic concept was first established in the 1930s,20 and then a modified random network (MRN) model was proposed by Greaves21 in mid-1980s, in which the oxide glass is described as partially covalent random networks made up of corner-shared glass former-oxide tetrahedra with glass modifiers in the inter-networking regions. Recently, a new modified model has been proposed to explain the prevention of the alumina-avoidance principle in term of aluminosilicate glass system,22 in which the network structure region composed of well-separated homonuclear framework containing only silicon–oxygen connection and heteronuclear framework containing both silicon and aluminum tetrahedra, and the inter-networking region composed of non-bridging oxygens and non-framework cations. Considering the fact that the ionic diffusion mechanisms are mostly vacancy-based rather than interstitial-based,23 and the possibility that the inter-networking region formed due to phosphorus addition, such modified random network models are instructive to understand the ion diffusion in P2O5–Na2O–Al2O3–SiO2 glass system.
Molecular dynamics (MD) simulations is an effective method to study the atomic structures and structure–property relationship of glass materials,24 and has been successfully applied to the investigation of structural heterogeneity in borosilicate25 and oxyfluoride glasses.26 In the present work, to explore the detailed structural information of P2O5-bearing sodium aluminosilicate glass, compositions with various P2O5 content and various Al/Na ratios were investigated by using MD simulations. Short- and medium-range structural features, such as pair distribution function (PDF), total correlation function (TDF), coordination number (CN), oxygen speciation, linkage between different network former cations (T–O–T connections, T = Si, Al, P in this work), network former species (Qxn), and network connectivity (NC), were analyzed. Based on the structural information from simulations, a modified random network model for P2O5-bearing sodium aluminosilicate glass is proposed, considering the relations between different network formers and percolated channels with sodium clustering behaviors. This structural model is then used to better understand ion-exchange efficiency acceleration of phosphorus addition in sodium aluminosilicate glass from the perspective of the glass network topology.
2 Simulation details
To fully investigate the effect of P2O5 on the structures of sodium aluminosilicate glass network, a wide range of compositions were considered in the present research, including the phosphorus-free and phosphorous-bearing glasses with variable Al/Na ratios, n%P2O5–(1 − n%)[15Na2O–xAl2O3–(85 − x)SiO2] (mol%, n = 0, 5, and x ranges from 1 to 30), labeled as NA (n = 0) and PNA (n = 5), respectively, where N, A, and P refer to Na2O, Al2O3, and P2O5, as well as a series of compositions of variable phosphorus content with fixed Al/Na ratio, x%P2O5–(1 − x%)[15Na2O–nAl2O3–(85 − n)SiO2] (mol%, n = 10, 15 and 20, and x ranges from 0 to 7), labeled as LAP (n = 10), MAP (n = 15) and HAP (n = 20) for peralkaline, metaluminous, and peraluminous glass compositions, respectively, where LA, MA, and HA refer to low, medium, and high Al content, and P refer to P2O5. Table 1 lists specific compositions and naming of the simulated glass system. The initial glass densities were calculated by using the software Glass Engineer System.27,28 MD simulations were performed using the DL_POLY version 2.20 package.29 The modified Teter potential were employed for more efficiently calculating the glass structure and reducing the computational time, which has been expanded by Du et al. and widely used in silicate,23,30 aluminosilicate,11,26,31,32 and phosphosilicate24,33,34 glass systems.| Series | SiO2 | Al2O3 | Na2O | P2O5 | Al/Na | Initial density (g cm−3) | Simulated density (g cm−3) |
|---|---|---|---|---|---|---|---|
| NA | 84 | 1 | 15 | — | 0.067 | 2.350 | 2.376 ± 0.007 |
| 81 | 4 | 15 | — | 0.267 | 2.367 | 2.388 ± 0.006 | |
| 78 | 7 | 15 | — | 0.467 | 2.383 | 2.411 ± 0.001 | |
| 75 | 10 | 15 | — | 0.667 | 2.398 | 2.418 ± 0.006 | |
| 73 | 12 | 15 | — | 0.800 | 2.408 | 2.418 ± 0.005 | |
| 72 | 13 | 15 | — | 0.867 | 2.412 | 2.438 ± 0.005 | |
| 71 | 14 | 15 | — | 0.930 | 2.417 | 2.432 ± 0.007 | |
| 70 | 15 | 15 | — | 1.000 | 2.421 | 2.441 ± 0.013 | |
| 69 | 16 | 15 | — | 1.067 | 2.435 | 2.447 ± 0.010 | |
| 68 | 17 | 15 | — | 1.133 | 2.449 | 2.455 ± 0.002 | |
| 67 | 18 | 15 | — | 1.200 | 2.463 | 2.466 ± 0.018 | |
| 66 | 19 | 15 | — | 1.267 | 2.473 | 2.461 ± 0.008 | |
| 65 | 20 | 15 | — | 1.333 | 2.482 | 2.489 ± 0.002 | |
| 63 | 22 | 15 | — | 1.467 | 2.502 | 2.491 ± 0.008 | |
| 60 | 25 | 15 | — | 1.667 | 2.532 | 2.514 ± 0.021 | |
| 57 | 28 | 15 | — | 1.867 | 2.562 | 2.522 ± 0.002 | |
| 55 | 30 | 15 | — | 2.000 | 2.581 | 2.537 ± 0.012 | |
| PNA | 79.8 | 0.95 | 14.25 | 5 | 0.067 | 2.379 | 2.398 ± 0.010 |
| 76.95 | 3.8 | 14.25 | 5 | 0.267 | 2.393 | 2.402 ± 0.005 | |
| 74.1 | 6.65 | 14.25 | 5 | 0.467 | 2.407 | 2.420 ± 0.013 | |
| 71.25 | 9.5 | 14.25 | 5 | 0.667 | 2.419 | 2.423 ± 0.003 | |
| 69.35 | 11.4 | 14.25 | 5 | 0.800 | 2.427 | 2.427 ± 0.007 | |
| 68.4 | 12.35 | 14.25 | 5 | 0.867 | 2.431 | 2.424 ± 0.008 | |
| 67.45 | 13.3 | 14.25 | 5 | 0.930 | 2.435 | 2.440 ± 0.007 | |
| 66.5 | 14.25 | 14.25 | 5 | 1.000 | 2.437 | 2.437 ± 0.005 | |
| 65.55 | 15.2 | 14.25 | 5 | 1.067 | 2.437 | 2.440 ± 0.012 | |
| 64.6 | 16.15 | 14.25 | 5 | 1.133 | 2.437 | 2.444 ± 0.006 | |
| 63.65 | 17.1 | 14.25 | 5 | 1.200 | 2.438 | 2.450 ± 0.005 | |
| 62.7 | 18.05 | 14.25 | 5 | 1.267 | 2.445 | 2.455 ± 0.003 | |
| 61.75 | 19 | 14.25 | 5 | 1.333 | 2.454 | 2.462 ± 0.001 | |
| 59.85 | 20.9 | 14.25 | 5 | 1.467 | 2.472 | 2.478 ± 0.003 | |
| 57 | 23.75 | 14.25 | 5 | 1.667 | 2.499 | 2.511 ± 0.001 | |
| 54.15 | 26.6 | 14.25 | 5 | 1.867 | 2.509 | 2.504 ± 0.004 | |
| 52.25 | 28.5 | 14.25 | 5 | 2.000 | 2.526 | 2.504 ± 0.003 | |
| LAP | 75 | 10 | 15 | 0 | 0.667 | 2.398 | 2.418 ± 0.006 |
| 74.25 | 9.9 | 14.85 | 1 | 0.667 | 2.403 | 2.419 ± 0.007 | |
| 73.5 | 9.8 | 14.7 | 2 | 0.667 | 2.407 | 2.421 ± 0.005 | |
| 72.75 | 9.7 | 14.55 | 3 | 0.667 | 2.411 | 2.422 ± 0.016 | |
| 72 | 9.6 | 14.4 | 4 | 0.667 | 2.415 | 2.422 ± 0.006 | |
| 71.25 | 9.5 | 14.25 | 5 | 0.667 | 2.419 | 2.423 ± 0.003 | |
| 70.5 | 9.4 | 14.1 | 6 | 0.667 | 2.423 | 2.429 ± 0.008 | |
| 69.75 | 9.3 | 13.95 | 7 | 0.667 | 2.427 | 2.437 ± 0.007 | |
| MAP | 70 | 15 | 15 | 0 | 1.000 | 2.421 | 2.441 ± 0.013 |
| 69.3 | 14.85 | 14.85 | 1 | 1.000 | 2.425 | 2.445 ± 0.005 | |
| 68.6 | 14.7 | 14.7 | 2 | 1.000 | 2.428 | 2.440 ± 0.002 | |
| 67.9 | 14.55 | 14.55 | 3 | 1.000 | 2.432 | 2.446 ± 0.007 | |
| 67.2 | 14.4 | 14.4 | 4 | 1.000 | 2.436 | 2.439 ± 0.006 | |
| 66.5 | 14.25 | 14.25 | 5 | 1.000 | 2.437 | 2.437 ± 0.005 | |
| 65.8 | 14.1 | 14.1 | 6 | 1.000 | 2.438 | 2.439 ± 0.012 | |
| 65.1 | 13.95 | 13.95 | 7 | 1.000 | 2.439 | 2.436 ± 0.011 | |
| HAP | 65 | 20 | 15 | 0 | 1.333 | 2.482 | 2.489 ± 0.002 |
| 64.35 | 19.8 | 14.85 | 1 | 1.333 | 2.476 | 2.474 ± 0.006 | |
| 63.7 | 19.6 | 14.7 | 2 | 1.333 | 2.471 | 2.476 ± 0.004 | |
| 63.05 | 19.4 | 14.55 | 3 | 1.333 | 2.465 | 2.472 ± 0.005 | |
| 62.4 | 19.2 | 14.4 | 4 | 1.333 | 2.459 | 2.448 ± 0.002 | |
| 61.75 | 19 | 14.25 | 5 | 1.333 | 2.454 | 2.463 ± 0.001 | |
| 61.1 | 18.8 | 14.1 | 6 | 1.333 | 2.449 | 2.461 ± 0.004 | |
| 60.45 | 18.6 | 13.95 | 7 | 1.333 | 2.444 | 2.454 ± 0.004 |
During the simulated melt-and-quench procedure, canonical (NVT), microcanonical (NVE) and constant temperature and pressure (NPT) ensembles have been chosen to obtain reasonable glass structure. In each simulation, around 3000 atoms were used in the simulation box with periodic boundary conditions. Larger simulation cells with 6000 atoms and smaller simulation cells with 1000 atoms have also been simulated for the compositions with RAl/Na = 1.000 in NA and PNA series to study the effect of system size. Related data are available in ESI (see SF 1)† and show that structural data converges for systems with 3000 and 6000 atoms per simulation cell while the smaller system with 1000 atoms showed some discrepancies. Considering both the accuracy of glass model and computational efficiency, all the results and discussion reported here are based on the simulation cell with 3000 atoms. The initial atom positions were generated by randomly putting the atoms in a cubic simulation cell with cell volume consistent to the calculated glass density. To avoid atoms being placed too close to each other during the generation of the initial configurations, constraints of minimum interatomic distance based on ionic radii were applied. After relaxing at 0 K and 0 Pa, the melting temperature reached at 6000 K through 2000 and 4000 K for fully eliminating the memory effects of the initial configuration. After that, a two-stage process with a step-wise cooling strategy was used with a nominal cooling rate of 1 K ps−1. First, before the temperature reached down to 1500 K through 4000, 3000, 2500, 2000 K, each temperature stair adopted NVT ensemble for 200![[thin space (1/6-em)]](https://www.rsc.org/images/entities/char_2009.gif) 000 steps (200 ps), followed by NVE for another 200
000 steps (200 ps), followed by NVE for another 200![[thin space (1/6-em)]](https://www.rsc.org/images/entities/char_2009.gif) 000 steps (200 ps). Second, NPT and NVE runs were performed in sequence at the temperature ranging from 1500 K to 300 K through 1000, 750, 700, 600, 500, 400 K, aiming to shrink the voids in glass samples as well as relax the system to equilibrium volume. The final trajectories of glass system, recorded every 0.05 ps, were generated by additional 200 ps NVE run at 300 K. These 4000 configurations were used for final structure analysis. For each composition, three parallel simulations were conducted starting from different initial random structures and the statistics analyses were averaged among the three samples. The simulated densities are shown in Table 1 and ranges from 2.37 to 2.54 g cm−3, consistent with previous reported experimental result.31,35,36 Compared with initial densities, the deviations are less than 2% and 1% in NA and PNA series, respectively, which is quiet reasonable for MD simulations.31
000 steps (200 ps). Second, NPT and NVE runs were performed in sequence at the temperature ranging from 1500 K to 300 K through 1000, 750, 700, 600, 500, 400 K, aiming to shrink the voids in glass samples as well as relax the system to equilibrium volume. The final trajectories of glass system, recorded every 0.05 ps, were generated by additional 200 ps NVE run at 300 K. These 4000 configurations were used for final structure analysis. For each composition, three parallel simulations were conducted starting from different initial random structures and the statistics analyses were averaged among the three samples. The simulated densities are shown in Table 1 and ranges from 2.37 to 2.54 g cm−3, consistent with previous reported experimental result.31,35,36 Compared with initial densities, the deviations are less than 2% and 1% in NA and PNA series, respectively, which is quiet reasonable for MD simulations.31
3 Results
3.1 General glass network structures
The analysis of network former species (Qxn) has been carried out as shown in Fig. 1, which is an important method to understand the intermediate range structural information in oxide glass, where n is the number of bridging oxygen (BO) coordinating with a glass network former atom x (x= Si, Al, P in the present work). [SiO4] tetrahedra in both NA and PNA compositions mainly exist as QSi4 species (Fig. 1a), with the coexistence of QSi2 and QSi3 groups, and the amount of QSi4 increasing with consuming of QSi2 and QSi3 as Al/Na ratio increasing, consistent with the experimental and theoretical results from the earlier literatures,32,37 indicating a polymerized silicon–oxygen network,9,18,33,38 which could be attributed to more sodium ions acting as charge compensator for [AlO4] tetrahedra. It is worthy to note that the P2O5 addition increases QSi4 amount with reducing QSi3 in peralkaline compositions (Fig. 1a). On the contrary, the Al environment has not been significantly influenced by Al content or P2O5 addition (Fig. 1b), with QAl4 maintaining the dominant species coexistence with a minor amount of five-fold coordinated sites QAl5.39 As shown in Fig. 1c, QPn exhibits more complicated effects compared with Si and Al. In peralkaline region, P is mainly located as depolymerized units QP1 and QP2. Due to the fact that these units need positive charge to maintain local neutrality, sodium ions have been partly scavenged from silicon–oxygen network, leading to the increased amount of QSi4, which means a denser silicon–oxygen network in peralkaline region (see Fig. 1a). These depolymerized units disappear and QP3 species become dominant as increasing Al/Na ratio. After Al/Na > 1, P mainly exists as QP4 with consuming QP3, providing charge balance for [AlO4] tetrahedra,19 thus a fraction of sodium ions transform the role of charge compensator to network modifier and move back to the vicinity of [SiO4] units, resulting in a slight reduction of QSi4 and increase of QSi3.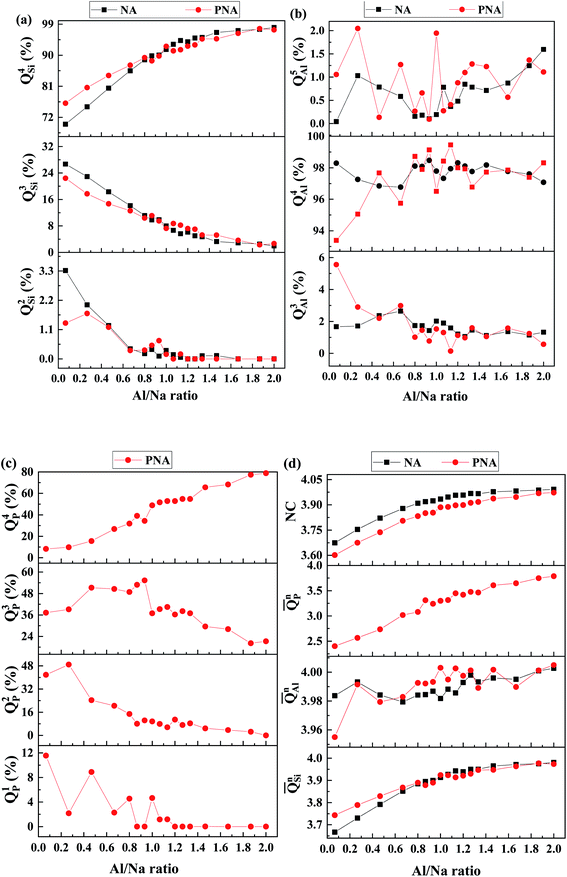 | ||
Fig. 1 Qxn distribution for (a) Si, (b) Al, (c) P and (d) ![[Q with combining macron]](https://www.rsc.org/images/entities/i_char_0051_0304.gif) xn and network connectivity (NC) in the compositions with different Al/Na ratio. xn and network connectivity (NC) in the compositions with different Al/Na ratio. | ||
To further investigate the glass network in NA and PNA, the mean Qxn was yield by
 | (1) |
 | (2) |
![[Q with combining macron]](https://www.rsc.org/images/entities/i_char_0051_0304.gif) Sin. However, the network connectivity of the overall glass structure exhibits a depolymerized behavior after P2O5 addition, even it increases with Al/Na ratio, implying a structural heterogeneity containing separated denser Si–O network with higher polymerization than overall glass structure and depolymerized P-rich regions.
Sin. However, the network connectivity of the overall glass structure exhibits a depolymerized behavior after P2O5 addition, even it increases with Al/Na ratio, implying a structural heterogeneity containing separated denser Si–O network with higher polymerization than overall glass structure and depolymerized P-rich regions.
The polymerized effect of P–O on Si–O network is more significant for peralkaline compositions (see SF 2† for LAP), with increasing P2O5 content, the amount of QSi4 increases, causing higher value of ![[Q with combining macron]](https://www.rsc.org/images/entities/i_char_0051_0304.gif) Sin. The influence gradually diminishes with increasing Al/Na ratio, that is for metaluminous and peraluminous compositions with various P2O5 content (see SF 3&4† respective for MAP and HAP), the decreased value of QSi4 and
Sin. The influence gradually diminishes with increasing Al/Na ratio, that is for metaluminous and peraluminous compositions with various P2O5 content (see SF 3&4† respective for MAP and HAP), the decreased value of QSi4 and ![[Q with combining macron]](https://www.rsc.org/images/entities/i_char_0051_0304.gif) Sin is attributed to the partly release of sodium ions from [PO4] units to [SiO4] units.
Sin is attributed to the partly release of sodium ions from [PO4] units to [SiO4] units.
In aluminosilicate glasses, phosphorus can play two different roles: first, for peralkaline compositions, P mainly exists as depolymerized species QP1 and QP2 and partly extracts sodium ions from silicon–oxygen network to maintain local charge neutrality, and second, for metaluminous and peraluminous compositions, QP4 is the dominant species with the breakage of double bond to provide an alternative charge compensation for [AlO4] units,14,19 which can be verified by oxygen speciation analysis as shown in Fig. 2. In peralkaline region, with increasing Al/Na ratio, the amount of non-bridging oxygen (NBO) decreases while that of BO increases (Fig. 2a), indicating a higher network connectivity. When Al/Na > 1, three-bonded oxygen (TBO) appears and increases dramatically with consuming of BO, due to the lack of sodium ions to charge compensate [AlO4] tetrahedra. Contrary to the effect of Al, the P2O5 addition has increased the amount of NBO and decreased that of TBO. For BO, the effect of P2O5 is more complicated, that is, in peralkaline region, the P2O5 addition reduces the amount of BO while increases it in peraluminous region. Such trend can be explained that when Al/Na < 1 there is enough sodium ions acting as charge compensator for [AlO4] units, with excess Na+ to generate NBOs in [SiO4] units. The added P would attract Na+ around [SiO4] and [AlO4] units to provide charge balance for QP1 and QP2, thus more sodium ions act as modifiers by breaking up the glass network with increased NBO and decreased BO. When Al/Na > 1, QP4 units partly replace the role of TBO and connect with [AlO4] units, transforming TBOs to BOs thus increasing the amount of BO with consuming TBO. These are consistent with simulated results of the LAP, MAP and HAP compositions in Fig. 2b, wherein the amount of NBO monotonically increases and TBO decreases with increasing P2O5 content. For LAP compositions, the amount of BO decreases to a large extent with added P2O5, while for MAP and HAP, the effect gradually diminishes, the amount of BO even keeps almost unchanged for HAP, attributing to the competition between the depolymerization and charge compensation effects of phosphorus. It is the same reason that the peak shape of BO in Fig. 2a becomes asymmetric and peak position shifts from the ratio of Al/Na = 1 to 1.2, at which point there is a balance between the two different effects of P2O5 on glass network.
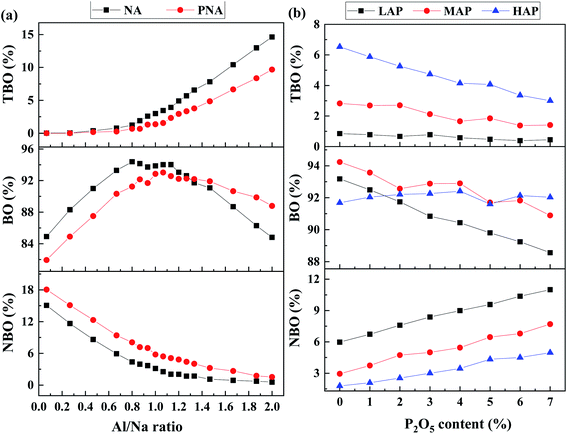 | ||
| Fig. 2 (a) Al/Na ratio dependence of oxygen speciation in NA and PNA, and (b) P2O5 content dependence of oxygen speciation in LAP, MAP and HAP. | ||
3.2 Local environment around sodium ions
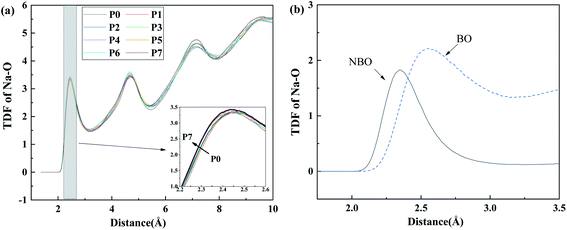
Focusing on the effect of P2O5 upon sodium ions, the total correlation function of Na–O for LAP compositions, as shown in Fig. 3a, assesses the local environmental evolution with added P2O5. The overall shape and peak position change little with composition. From the enlarged image of first peak in the inset, there is only a slight left shift of peak position, which is almost negligible. The result is nearly the same as it is in MAP and HAP compositions (see SF 5†). Based on the further analysis of TDF in Fig. 3b, Na–NBO bond length is about 2.34 Å while that of Na–BO being 2.55 Å. This suggests that the Na–O bond length becomes shorter when Na ions act as network modifiers than when they act as charge-compensators,25,40 because of the fact that Na ions are more strongly bonded to the created NBO than to the surrounding BO when they act as charge compensators.The coordination number (CN) of Na–O was calculated from the integral to the first peak of TDF and shown in Fig. 4. The cutoff value, determined from the first minimum distance of pair correlation function, was 3.25 Å for Na–O pairs.41,42 The Na–O coordination number increases in the sequence of LAP, MAP, and HAP, as well as BO and TBO, wherein NBO decreases. Contrary to the effect of Al, the addition of P2O5 increases the amount of NBO around sodium ions and decreases that of BO and TBO, which lead into the result that total CN of oxygen around sodium ions does not change significantly. This is attributed to the different mechanism of Al and P to attract Na+. Due to the fact that [AlO4] units are negative charged, sodium ions are attracted to provide charge compensation and bonded with bridging oxygen with larger bond length, causing increased oxygen coordination number. As for [PO4] units, sodium ions are extracted from the silicon–aluminum network to form QP1 and QP2 and act as modifiers to bond with non-bridging oxygen of these depolymerized units. As the number of NBO around sodium ions is much lower than that of BO, the average local oxygen environment is dominated by BO and change little with P2O5 content.
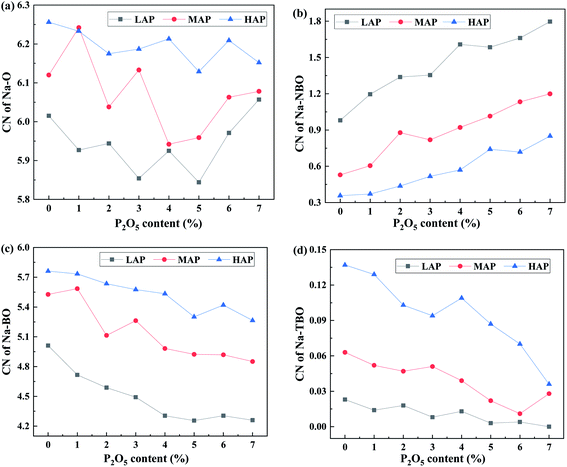 | ||
| Fig. 4 Coordination number of (a) Na–O, (b) Na–NBO, (c) Na–BO, and (d) Na–TBO for LAP, MAP and HAP glass compositions. | ||
3.3 The distribution of sodium ions and correlation with network formers
In order to investigate the spatial organization of sodium ions, Na–Na PDFs in different compositions have been calculated and shown in Fig. 5. In all the pair distribution functions, we observe the existence of a well-defined peak, suggesting the existence of some spatial correlations among sodium ions, which is indicative of a trend to cluster within modifier channels and has been identified intrinsic in silicate glasses.21,30,43 For peralkaline compositions (Fig. 5a, LAP), the first peak position of the distribution function left shifts slightly and the intensity increases significantly, indicating that the propensity for clustering increases with the addition of P2O5. Compared the Na–Na PDFs of different Al/Na ratios, we also conclude that the degree of clustering seems to decrease with increasing Al content, from the decreased difference of intensity or peak position in MAP and HAP glasses in Fig. 5b and c. It has been further verified by the PDF of Na–Na for P0 composition with various Al/Na ratios in Fig. 5d as the intensity of first peak monotonously decreases with increased Al content. These results suggest that the spatial distribution of Na+ is closely related to the interaction with different glass network former species.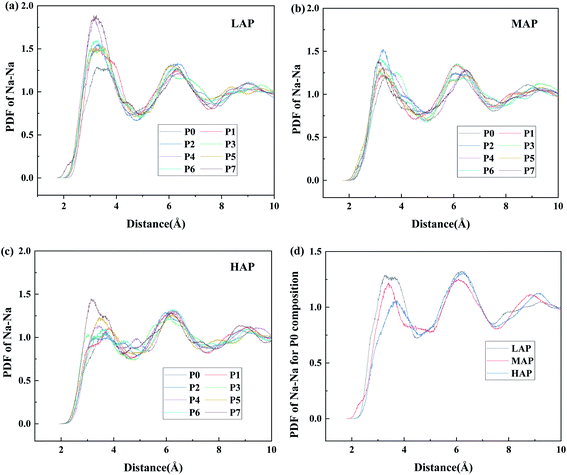 | ||
| Fig. 5 Pair distribution function of Na–Na for (a) LAP, (b) MAP, (c) HAP glass compositions and (d) P0 composition with various Al/Na ratios. | ||
To further study the correlation between network former cations and sodium ions, the average number of Na+ around different network former cations through the integral of TDFs of Si–Na, Al–Na, and P–Na (see SF 6†), has been calculated and shown in Fig. 6. In all simulated compositions, the average number of Na+ around different network former cations decrease with increasing P2O5 content. In peralkaline region, the preference of sodium ions around network former cations is found to decrease in the sequence of phosphorus, aluminum, and silicon from Fig. 6a. Sodium ions tend to be distributed in the vicinity of [PO4] units and act as modifiers to generate NBO,44 followed by that of [AlO4] and [SiO4] units. The increasing Al content (LAP, MAP, and HAP) mainly affects the distribution of sodium ions around phosphorus and aluminum cations, as the average number Na+ around [PO4] and [AlO4] units decreased while that around [SiO4] units remain almost unchanged in Fig. 6b. The distribution of sodium ions near Si is mainly affected by P. With increasing P2O5 content, sodium ions around Si decrease, indicating that sodium ions are extracted from the silicon–oxygen network, consistent with the above analysis of QSin distribution (see Fig. 1a).
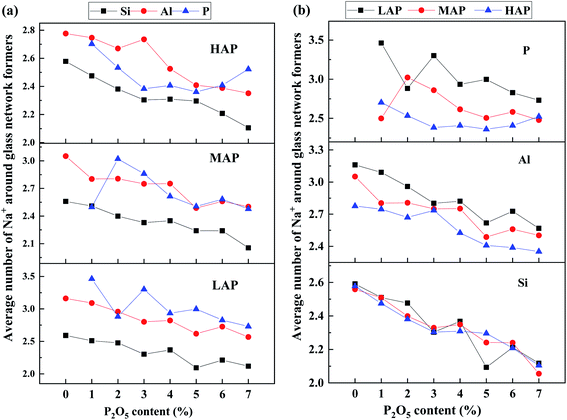 | ||
| Fig. 6 P2O5 content dependence of the average number of Na+ around different network-forming cations (a) in LAP, MAP, and HAP glass compositions and (b) for Si, Al and P with various Al content. | ||
4 Discussion
4.1 Structural heterogeneity in phosphorus-bearing aluminosilicate glass
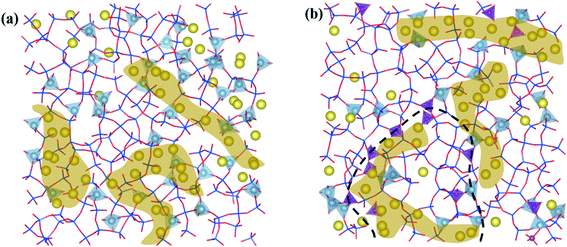
The simulated microstructures of LAP glasses are presented in Fig. 7. It is clearly that the glass structure is far from homogeneous. In the P2O5-free aluminosilicate glasses (Fig. 7a), there are two regions, a network structure region composed of well-separated aluminum–silicon and silicon-rich framework species as well as a channel region of non-bridging oxygens and network modifiers inserted into aluminum–silicon region, which is consistent with the proposed model in terms of aluminosilicate glasses.22 In the P2O5-bearing aluminosilicate glasses (Fig. 7b), the structural heterogeneity still exist and even more significant as the fraction of homonuclear framework predominantly containing [SiO4] units increase after P2O5 addition. A fraction of P is distributed at the interface of silicon-rich and aluminum–phosphorus regions, interpreting the formation of minor P–O–Si linkage, which has been detected in previous NMR experiments.19 While for MAP and HAP compositions (see SF 7†), the effect of P on the heterogeneous distribution of network formers and modifiers seems weaker.In order to investigate the mutual affinity and avoidance between different network formers, the percentage of different T–O–T (T = Si, Al, P) connections in glass compositions with various P2O5 content has been calculated through detailed analysis of BO and TBO and shown in Fig. 8a. In the simulated glass system, with increasing P2O5, the percentage of Si–O–Si, Si–O–Al, and Al–O–Al decreases while that of Si–O–P and Al–O–P increases. The amount of P–O–P linkage is too small to be drawn in the chart. It is worthy to note that a fraction of Al–O–Al exits in our simulated structure. The result is to some extent breaking the Al avoidance principle which suggests that Si–O–Al linkages are more energetically favorable such that Al–O–Al linkages are not formed if there is a possibility for Si–O–Al to occur. However, the extent of obedience of this principle in aluminosilicate glasses is questionable.45,46 Recently, prevention of the Al avoidance principle have been investigated by NMR spectral analysis and it has been proposed that breaching of the principle was essential for understanding the distribution of [SiO4] and [AlO4] units in alkaline-earth aluminosilicate glass.22 In our simulation, the quantity of Al–O–Al linkage decreases with P2O5 content while increase with Al content, which is consistent with previous experimental and simulated results.32,47,48
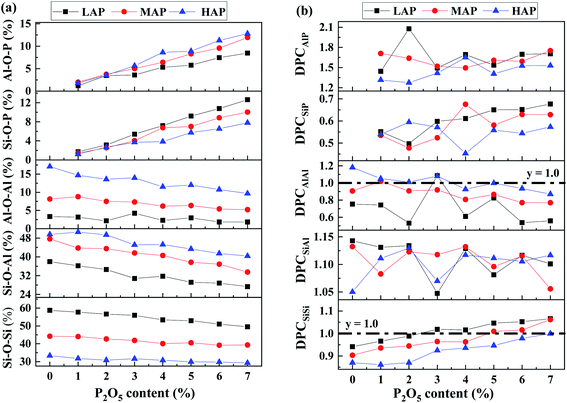 | ||
| Fig. 8 (a) Fraction and (b) degree of preferred connection of different T–O–T network linkage for LAP, MAP and HAP glass compositions various P2O5 content. | ||
To quantify the propensity of different inter-tetrahedral connectivity, the degree of preferred connection, DPCmn (where m and n mean network-former cations, Si, Al, and P for example), is defined and calculated, which is governed by
 | (3) |
 | (4) |
 | (5) |
When DPCmn > 1, m and n show some affinity and prior to form linkage in the network, whereas when DPCmn ≤ 1, there are not. As shown in Fig. 8b, the distribution of DPCmn indicates that the formation of T–O–T (T = Si, Al, P) connections is far away from random model, and shows a certain propensity. The priority of different T–O–T linkage in order from high to low is Al–O–P, Si–O–Al, Si–O–Si, Al–O–Al, and Si–O–P, revealing a strong affinity of [PO4] tetrahedra for aluminum.10,18 The lowest priority of Si–O–P might cause immiscibility and phase separation, that is, P could serve as nucleating agent in silicate glasses.49 Although the percentage of Si–O–Si connection decreases with increased P content, DPCSiSi has an increasing trend, indicating that P obviously improves the priority of Si–O–Si linkage, especially for LAP compositions, suggesting the formation of separated silicon–oxygen rich regions, which could induce the emerging of cristobalite (SiO2) crystals after heat treating.50 Such complex bonding geometries might arise from the different value of ionic field strength, P5+ > Si4+ > Al3+, leading to different NBO preference causing that [PO4] units are mainly incorporated as ortho- and pyrophosphate units (Q0P and QP1) and show broad QPn distribution with more NBO while [SiO4] units mainly exist as QSi3 and QSi4 with less NBO, and [AlO4] units mainly exist as QAl4 and are not sensitive with composition, suggesting that Si–NBO is strongly preferred than Al–NBO, which has been verified by 17O MAS NMR experiments.51 As a result, the Si environment is significantly modified by P2O5 addition with an increase of QSi4 species, generating a more polymerized Si–O network. Besides, there is a strong affinity of phosphorus to bond with aluminum as tetrahedral coordinated phosphorus have a bond valence of 1.25, the bond valence of [AlO4] species is 0.75, thus a P–O–Al connectivity leaves no charge on the bridging oxygen and local electrostatic neutrality would be satisfied.18,52 Therefore, Si–O–Al connection has been consumed to form Si–O–Si and Al–O–P with P2O5 addition.16
Based on the propensity of connection between different network former cations, the addition of P2O5 has induced separated aluminum–phosphorus-rich and silicon-rich region, exacerbating the heterogeneity of glass structure, which might not be distinguished in emission scanning microscope (SEM).16 In contrast, due to the relatively high priority of Al–O–P and Si–O–Al, the increasing Al content, acting as the role of bridge and generating linkage like Si–O–Al–O–P, tends to generate a more homogenous glass structure,15,39 which is supported by the decreased priority of Si–O–Si with addition of Al content (see SF 8†). Besides the heterogeneity of network former cations, clustering of sodium ions is also observed with addition of P2O5, especially in peralkaline region, which would have an effect on the mobility of sodium ions, as the connected Na–O polyhedra provide natural pathways for migration.23,53
4.2 Proposal of a new structural model from MD simulations
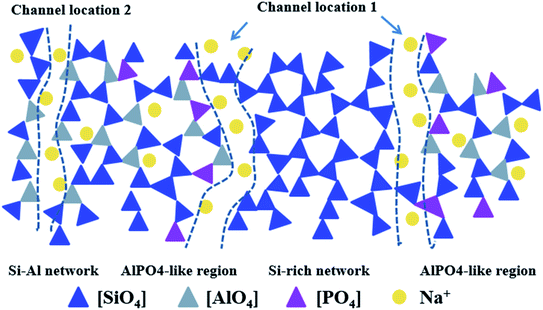
Based on the above MD simulation results, a structural model for phosphorus-bearing sodium aluminosilicate glass has been proposed, as shown in Fig. 9. In our simulated P2O5-bearing glasses, the network composes of three complicated corner-sharing network formers Si, Al, and P with inhomogeneous distribution. Phosphorus, with more NBO in the first coordination shell, has a strong affinity to Al forming aluminum–phosphorus-rich regions and avoids to connect with Si, meanwhile, the clustered Na+ are preferred to appear in the vicinity of [PO4] and [AlO4] units. Therefore, Al–O–P connections can be located at the border of framework,10 leaving NBO around P to inter-connect with clustered Na+ to form percolated channels. Due to both relatively high propensity to P and Si, [AlO4] units play a central role of separating silicon and phosphorus, acting as bridge, to form continuous network containing three network formers. Because of the effect of P on the promotion of Si–O–Si linkage, silicon-rich regions have been formed, and separated by percolated channel from aluminum–phosphorus-rich region. Due to the preferential interaction of sodium ions to [PO4] and [AlO4] units, sodium depletion layer is formed at the border of phosphorous–aluminum region and beneficial for silicon-rich region, where there is a more polymerized structure compared to the overall network connectivity. The clustered sodium ions around P and Al together with NBOs form percolated channels in the glass network. Considering the fact that sodium ions cluster around [AlO4] and [PO4] units and that NBOs can be mainly provided by [SiO4] and [PO4], there are two possible channel locations (Fig. 9): Channel location 1 is the interface of separated aluminum–phosphorus and silicon-rich region; Channel location 2 is inserted into silicon–aluminum region formed by Si–O–Al connection.In the framework of the present topological model, it is reasonable to understand that for peralkaline aluminosilicate glasses, the phosphorus addition can significantly improve the ion-exchange efficiency since it provides new percolated channel location due to the existence and exacerbation of local heterogeneity and clustering within the network former and modifier species, thus increasing the amount of diffusion pathways to improve alkali migration. On the other hand, for metaluminous and peraluminous compositions, the effect of P diminishes gradually and does not have a significant influence on ion-exchange process, as Al improves the homogeneous distribution of alkali ions and phosphorus cations in some extent.
5 Conclusions
This MD simulation study reveals the structural heterogeneity in P2O5-bearing sodium aluminosilicate glass system, especially in peralkaline compositions. Due to the relatively depolymerized [PO4] units causing Na+ ions being moved from silicate network, as well as the strong priority of P to Al, significant heterogeneity is favored in these compositions. Nevertheless, the propensity for such heterogeneity, including the inhomogeneous distribution of mutual connection of network formers and clustering extent of sodium ions, decreases with increasing Al content. Based on these results, a structural model has been proposed from the perspective of glass network topology to elucidate the effect of P on the acceleration of ion-exchange efficiency, which depends on the Al/Na ratio. With this model, we can further study the structure–properties relationship and design novel functional glass compositions with optimized ion mobility.Conflicts of interest
There are no conflicts to declare.Acknowledgements
This work was supported by the 13th Five-Year National Key R&D Program (No. 2016YFB0303700), National Natural Science Foundation of China (U1809217 and 51672242), Opening Project of State Key Laboratory of Advanced Technology for Float Glass and Fundamental Research Funds for the Central Universities.References
- S. Karlsson, B. Jonson and C. Stalhandske, Glass Technol.: Eur. J. Glass Sci. Technol., Part A, 2010, 51(2), 41–54 CAS.
- P. Ball, Nat. Mater., 2015, 14(5), 472 CrossRef CAS.
- A. K. Varshneya, Phys. Chem. Glasses: Eur. J. Glass Sci. Technol., Part B, 2017, 58(4), 127–132 Search PubMed.
- A. Vedrtnam, Proc. Inst. Mech. Eng., Part C, 2019, 233(4), 1334–1344 CrossRef CAS.
- V. I. Loganina, M. E. Sadovnikova, W. Jezierski and D. Małaszkiewicz, IOP Conf. Ser.: Mater. Sci. Eng., 2017, 245, 022023 Search PubMed.
- G. N. Hou, C. M. Zhang, W. B. Fu, G. S. Li, J. N. Xia and Y. X. Ping, Ceram. Int., 2019, 45(9), 11850–11855 CrossRef CAS.
- M. Engholm, L. Norin and D. Aberg, Opt. Lett., 2007, 32(22), 3352–3354 CrossRef CAS.
- S. Bhattacharyya, T. Höche, N. Hemono, M. J. Pascual and P. A. van Aken, J. Cryst. Growth, 2009, 311(18), 4350–4355 CrossRef CAS.
- J. Ding, Y. K. Chen, W. Chen, L. L. Hu and G. Boulon, Chin. Opt. Lett., 2012, 10(7), 071602 CrossRef.
- S. Guo-Malloy, P. F. McMillan and W. T. Petuskey, J. Non-Cryst. Solids, 2016, 451, 77–83 CrossRef CAS.
- J. J. Zhao, X. X. Xu, P. C. Li, X. Y. Li, D. Q. Chen, X. S. Qiao, J. C. Du, G. D. Qian and X. P. Fan, J. Phys. Chem. B, 2019, 123(13), 3024–3032 CrossRef CAS.
- H. D. Zeng, L. Wang, F. Ye, B. Yang, J. D. Chen, G. R. Chen and L. Y. Sun, Front. Mater., 2016, 3, 53 Search PubMed.
- B. O. Mysen, Contrib. Mineral. Petrol., 1998, 133(1–2), 38–50 CrossRef CAS.
- G. D. Cody, B. Mysen, G. Saghi-Szabo and J. A. Tossell, Geochim. Cosmochim. Acta, 2001, 65(14), 2395–2411 CrossRef CAS.
- C. C. de Araujo, L. Zhang and H. Eckert, J. Mater. Chem., 2006, 16(14), 1323–1331 RSC.
- M. Tarrago, M. Garcia-Valles, S. Martinez and D. R. Neuville, J. Environ. Manage., 2018, 220, 54–64 CrossRef CAS.
- M. J. Toplis and T. Schaller, J. Non-Cryst. Solids, 1998, 224(1), 57–68 CrossRef CAS.
- P. Glatz, M. Comte, L. Montagne, B. Doumert and L. Cormier, Phys. Chem. Chem. Phys., 2019, 21(33), 18370–18379 RSC.
- A. Nizamutdinova, T. Uesbeck, T. Grammes, D. S. Brauer and L. van Wullen, J. Phys. Chem. B, 2020, 124(13), 2691–2701 CrossRef CAS.
- W. H. Zachariasen, J. Am. Chem. Soc., 1932, 54, 3841–3851 CrossRef CAS.
- G. N. Greaves, J. Non-Cryst. Solids, 1985, 71(1–3), 203–217 CrossRef CAS.
- A. R. Allu, A. Gaddam, S. Ganisetti, S. Balaji, R. Siegel, G. C. Mather, M. Fabian, M. J. Pascual, N. Ditaranto, W. Milius, J. Senker, D. A. Agarkov, V. V. Kharton and J. M. F. Ferreira, J. Phys. Chem. B, 2018, 122(17), 4737–4747 CrossRef CAS.
- A. N. Cormack, J. C. Du and T. R. Zeitler, Phys. Chem. Chem. Phys., 2002, 4(14), 3193–3197 RSC.
- X. N. Lu, L. Deng, C. Huntley, M. G. Ren, P. H. Kuo, T. Thomas, J. Chen and J. C. Du, J. Phys. Chem. B, 2018, 122(9), 2564–2577 CrossRef CAS.
- M. Y. Wang, M. M. Smedskjaer, J. C. Mauro and M. Bauchy, J. Chem. Phys., 2019, 150(4), 044502 CrossRef.
- J. J. Zhao, X. X. Xu, X. T. Chen, Q. Xu, Z. Luo, X. Qiao, J. C. Du, X. P. Fan and G. D. Qian, J. Eur. Ceram. Soc., 2019, 39(15), 5018–5029 CrossRef CAS.
- A. Fluegel, J. Am. Ceram. Soc., 2007, 90(8), 2622–2625 CrossRef CAS.
- F. X. Gan, Calculation of physical properties of inorganic glasses and component design (in Chinese), Shanghai Science and Technology Press, Shanghai, 1981 Search PubMed.
- W. Smith and T. R. Forester, J. Mol. Graphics, 1996, 14(3), 136–141 CrossRef CAS.
- J. C. Du and A. N. Cormack, J. Non-Cryst. Solids, 2004, 349, 66–79 CrossRef CAS.
- M. G. Ren, J. Y. Cheng, S. P. Jaccani, S. Kapoor, R. E. Youngman, L. P. Huang, J. C. Du and A. Goel, J. Non-Cryst. Solids, 2019, 505, 144–153 CrossRef CAS.
- Y. X. Zhao, J. C. Du, X. S. Qiao, X. Cao, C. Zhang, G. Xu, Y. Liu, S. Peng and G. R. Han, J. Non-Cryst. Solids, 2020, 527, 119734 CrossRef CAS.
- J. C. Du, L. Kokou, J. L. Rygel, Y. S. Chen, C. G. Pantano, R. Woodman and J. Belcher, J. Am. Ceram. Soc., 2011, 94(8), 2393–2401 CrossRef CAS.
- M. G. Ren, X. N. Lu, L. Deng, P. H. Kuo and J. C. Du, Phys. Chem. Chem. Phys., 2018, 20(20), 14090–14104 RSC.
- J. Q. Wu, C. W. Lin, J. L. Liu, L. Han, H. Gui, C. Li, T. Y. Liu and A. X. Lu, J. Non-Cryst. Solids, 2019, 521, 119486 CrossRef CAS.
- T. Grammes, R. Limbach, S. Bruns, L. van Wüllen, D. de Ligny, E. I. Kamitsos, K. Durst, L. Wondraczek and D. S. Brauer, Front. Mater., 2020, 7, 115 CrossRef.
- D. A. McKeown, F. L. Galeener and G. E. Brown, J. Non-Cryst. Solids, 1984, 68(2–3), 361–378 CrossRef CAS.
- R. Dupree, D. Holland and M. G. Mortuza, Nature, 1987, 328(6129), 416–417 CrossRef CAS.
- R. R. Deshpande, L. Zhang and H. Eckert, J. Mater. Chem., 2009, 19(8), 1151–1159 RSC.
- M. Bauchy and M. Micoulaut, J. Non-Cryst. Solids, 2011, 357(14), 2530–2537 CrossRef CAS.
- Y. Xiang and J. C. Du, Chem. Mater., 2011, 23(11), 2703–2717 CrossRef CAS.
- Y. Xiang, J. C. Du, M. M. Smedskjaer and J. C. Mauro, J. Chem. Phys., 2013, 139(4), 044507 CrossRef.
- C. D. Huang and A. N. Cormack, J. Chem. Phys., 1991, 95(5), 3634–3642 CrossRef CAS.
- L. Zhang and H. Eckert, J. Phys. Chem. B, 2006, 110(18), 8946–8958 CrossRef CAS.
- A. Jaworski, B. Stevensson, B. Pahari, K. Okhotnikov and M. Eden, Phys. Chem. Chem. Phys., 2012, 14(45), 15866–15878 RSC.
- J. J. Ren, L. Zhang and H. Eckert, J. Phys. Chem. C, 2014, 118(9), 4906–4917 CrossRef CAS.
- S. K. Lee and J. F. Stebbins, Geochim. Cosmochim. Acta, 2009, 73(4), 1109–1119 CrossRef CAS.
- S. Kapoor, X. J. Guo, R. E. Youngman, C. L. Hogue, J. C. Mauro, S. J. Rzoska, M. Bockowski, L. R. Jensen and M. M. Smedskjaer, Phys. Rev. Appl., 2017, 7(5), 054011 CrossRef.
- S. Kolay and P. Bhargava, J. Am. Ceram. Soc., 2019, 102(12), 7312–7328 CrossRef CAS.
- G. Wen, X. Zheng and L. Song, Acta Mater., 2007, 55(10), 3583–3591 CrossRef CAS.
- J. R. Allwardt, S. K. Lee and J. F. Stebbins, Am. Mineral., 2003, 88(7), 949–954 CrossRef CAS.
- J. J. Ren and H. Eckert, J. Phys. Chem. C, 2018, 122(48), 27620–27630 CrossRef CAS.
- B. Park and A. N. Cormack, J. Non-Cryst. Solids, 1999, 255(1), 112–121 CrossRef CAS.
Footnote |
| † Electronic supplementary information (ESI) available. See DOI: 10.1039/d0ra10810c |
| This journal is © The Royal Society of Chemistry 2021 |

