
 Open Access Article
 This Open Access Article is licensed under a Creative Commons Attribution-Non Commercial 3.0 Unported Licence
Wetting of electrospun nylon-11 fibers and mats†
Dmitry Bagrov *ab,
Svetlana Perunovac,
Elizaveta Pavlovaad and
Dmitry Klinova
*ab,
Svetlana Perunovac,
Elizaveta Pavlovaad and
Dmitry Klinova
aFederal Research and Clinical Center of Physical-Chemical Medicine of Federal Medical Biological Agency, 1a Malaya Pirogovskaya Street, 119435, Moscow, Russian Federation. E-mail: bagrov@mail.bio.msu.ru
bLomonosov Moscow State University, Faculty of Biology, Leninskie Gory 1-12, 119234, Moscow, Russian Federation
cNational University of Science and Technology MISiS, Leninskiy Prospect 4, Moscow, 119049, Russian Federation
dMoscow Institute of Physics and Technology, 9 Institutsky Per., Dolgoprudny, 141700, Moscow Region, Russian Federation
First published on 18th March 2021
Abstract
Wetting of electrospun mats plays a huge role in tissue engineering and filtration applications. However, it is challenging to trace the interrelation between the wetting of individual nano-sized fibers and the macroscopic electrospun mat. Here we measured the wetting of different nylon-11 samples – solution-cast films, electrospun fibers deposited onto a substrate, and free-standing mats. With electrospun nylon-11 on aluminium foil, we traced the dependence of the wetting contact angle on the fibers' surface density (substrate coverage). When the coverage was low, the contact angle increased almost linearly with it. At ∼17–20% coverage, the contact angle achieved its maximum of 124 ± 7°, which matched the contact angle of a non-woven electrospun mat, 126 ± 2°. Our results highlight the importance of the outermost layer of fibers for the wetting of electrospun mats.
Introduction
How many nanofibers do we need to make a non-woven mat? Is it enough to have ten fibers? Or a hundred? Or a thousand? These questions might seem speculative; however, they become crucial when we try to relate the properties of electrospun mats with the properties of individual nanofibers. This relation is essential when we focus on the wetting of non-woven mats.1,2Wetting of electrospun mats influences their performance as filters,3 separators,4 wound dressings,5 sorbents,6 and tissue engineering scaffolds.7 Wetting depends on the chemical composition of the fibers, their diameter, spatial arrangement, and post-treatment (chemical functionalization,8 thermal treatment,9 and others). Controlling and predicting wetting properties relies on understanding the liquid–polymer interaction at different scales from individual fibers to a mat.
The theoretical and experimental studies of the macroscopic fibers give a detailed description of the interaction force and the shape of the drop placed onto a fiber10–13 or a set of fibers.14–16 Since electrospun fibers are usually far smaller than the liquid drops, their wetting is studied using sophisticated experimental procedures, such as attaching an individual nanofiber to an AFM tip.1,17 Based on the wetting properties of individual fibers and general theoretical models, one can explain the wetting properties of mats. It is usually performed using the Cassie–Baxter model.1,18–20 When a drop of liquid is placed onto an electrospun mat, it interacts with thousands of nanofibers, as well as with the air entrapped between them. The importance of air was highlighted in several studies.2 Due to the small radius of the nanofibers and their low packing density, the electrospun mats demonstrate superhydrophobic19 or super-oleophobic1,21 behaviour.
Let us reframe the above-mentioned question about the minimum number of fibers that form a mat using the “surface coverage” term. Since electrospun fibers are usually formed on a grounded collector, we can ask: “Which minimum surface coverage of the collector makes supported fibers behave as a free-standing mat?” To answer this question, we prepared non-uniform samples with a gradual change in surface coverage by electrospun nylon-11 fibers. These samples allowed us to trace the relation between the surface coverage and the sample's contact angle (CA). We have found a certain threshold (∼17–20% coverage) at which the CA of the sample becomes equal to the CA of an electrospun mat. This can be regarded as the transition from individual fibers to a mat.
Materials and methods
Solutions of nylon
Nylon-11 was purchased from Sigma-Aldrich (USA), HFIP was purchased from P&M Invest (Moscow, Russian Federation). The stock solution was prepared at 100 mg ml−1 concentration.Preparation of films, mats, and fibers
Three types of samples were used in this study (Fig. 1). Electrospun fibers and mats were prepared using the Nanofiber Electrospinning Unit apparatus (China). Upon electrospinning, we obtained samples supported by aluminium foil or free-standing mats with a thickness of 70–90 μm. The former ones are commonly obtained using electrospinning; the latter ones required a polypropylene frame positioned between the feeding syringe and the counter electrode.22 The accelerating voltage and distance between the needle and the second electrode were 30 kV and 30 cm, respectively. The polymer solution was supplied at a rate of 1 ml h−1; the inner diameter of the syringe needle was 0.7 mm.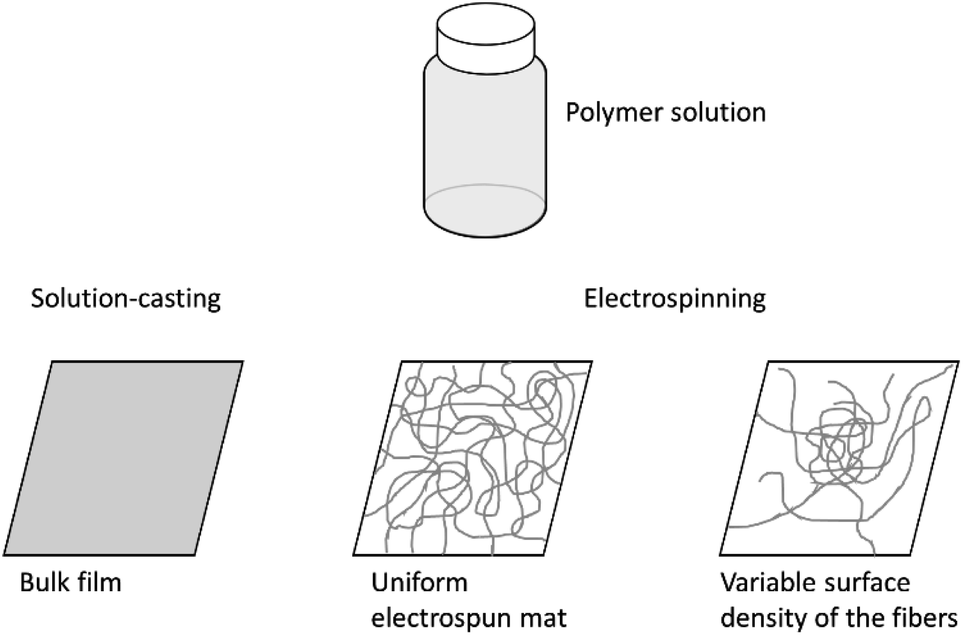 | ||
| Fig. 1 Different types of samples used in this study. | ||
To obtain a mat on foil with a gradient surface density of the fibers, we turned electrospinning on for a short time, approximately 2–5 minutes. As a result, a roughly centrosymmetric spot of fibers was formed with few fibers at the periphery and many fibers at the central part.
The bulk films used as control samples were prepared on glass Petri dishes using solution-casting.
Contact angle measurements
The hydrophilicity of the samples was evaluated by measuring the contact angle between water drops and the sample surface using a Drop Shape Analyzer DSA 25E (Kruss, Hamburg, Germany) at room temperature (22–25 °C). Water drops (∼2 μl) were placed on the sample surface with a microsyringe. The contact angle measurements were carried over a 1 min period with a 1 or 2 s step to capture the time-dependent behaviour of the drop.Scanning electron microscopy
Fragments with the size from 5 × 5 mm to 10 × 10 mm were coated with a ∼20 nm gold layer using Eiko IB3 sputter coater (Japan) and mounted onto the stage of the scanning electron microscope (SEM). The fibers, mats, and bulk films were analyzed using the TM3000 (Hitachi, Japan) at 15 kV accelerating voltage. When we analyzed the samples with the variable surface density of the fibers, we acquired SEM images within the spots (∼1 mm in width) used for the contact angle measurements.Data processing
SEM images were processed using Fiji software.23 Statistical analysis was done using Excel (Microsoft, USA) and OriginPro (OriginLab Corporation, USA). The qualitative results are presented as mean ± standard deviation. The energies were calculated using a python script (Python 3.7.9).Results
The SEM images of the solution-cast films and electrospun mats made of nylon-11 are shown in Fig. 2 (A and B, respectively). The solution-cast film exhibited a spherulitic structure with a typical spherulite size of 7.2 ± 2.1 μm. The electrospun mat exhibited the typical fibrous morphology, with the mean diameter of the fibers of 280 ± 113 nm. The contact angles (CA) of the films and mats were θf = 90 ± 2° and θm = 126 ± 3°, respectively (Fig. 2C). The CA of the nylon-11 film was in perfect agreement with the previous data (89°, according to ref. 24).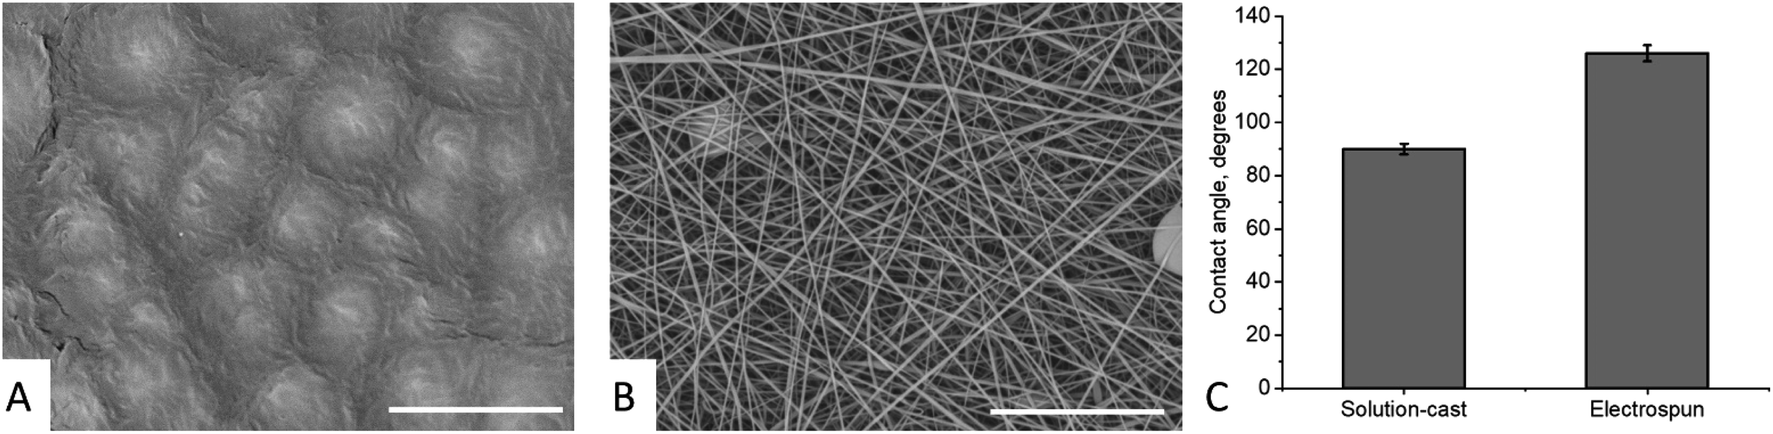 | ||
| Fig. 2 The properties of the studied solution-cast films and electrospun mats. The SEM images of a film (A) and a mat (B), scale bar 10 μm for both images. (C) The contact angles of the films and mats. | ||
We prepared “gradient” samples with the variable surface density of the electrospun fibers on aluminium foil. Some SEM images are shown in Fig. 3; the others are available on demand. At the periphery of the sample, the surface coverage was low, and a major part of the SEM image showed the aluminium substrate. When we moved from the periphery of the central part of the sample, the surface coverage increased. However, the fiber diameter was roughly the same, typically in the range from 175 to 275 nm (see ESI† for the details).
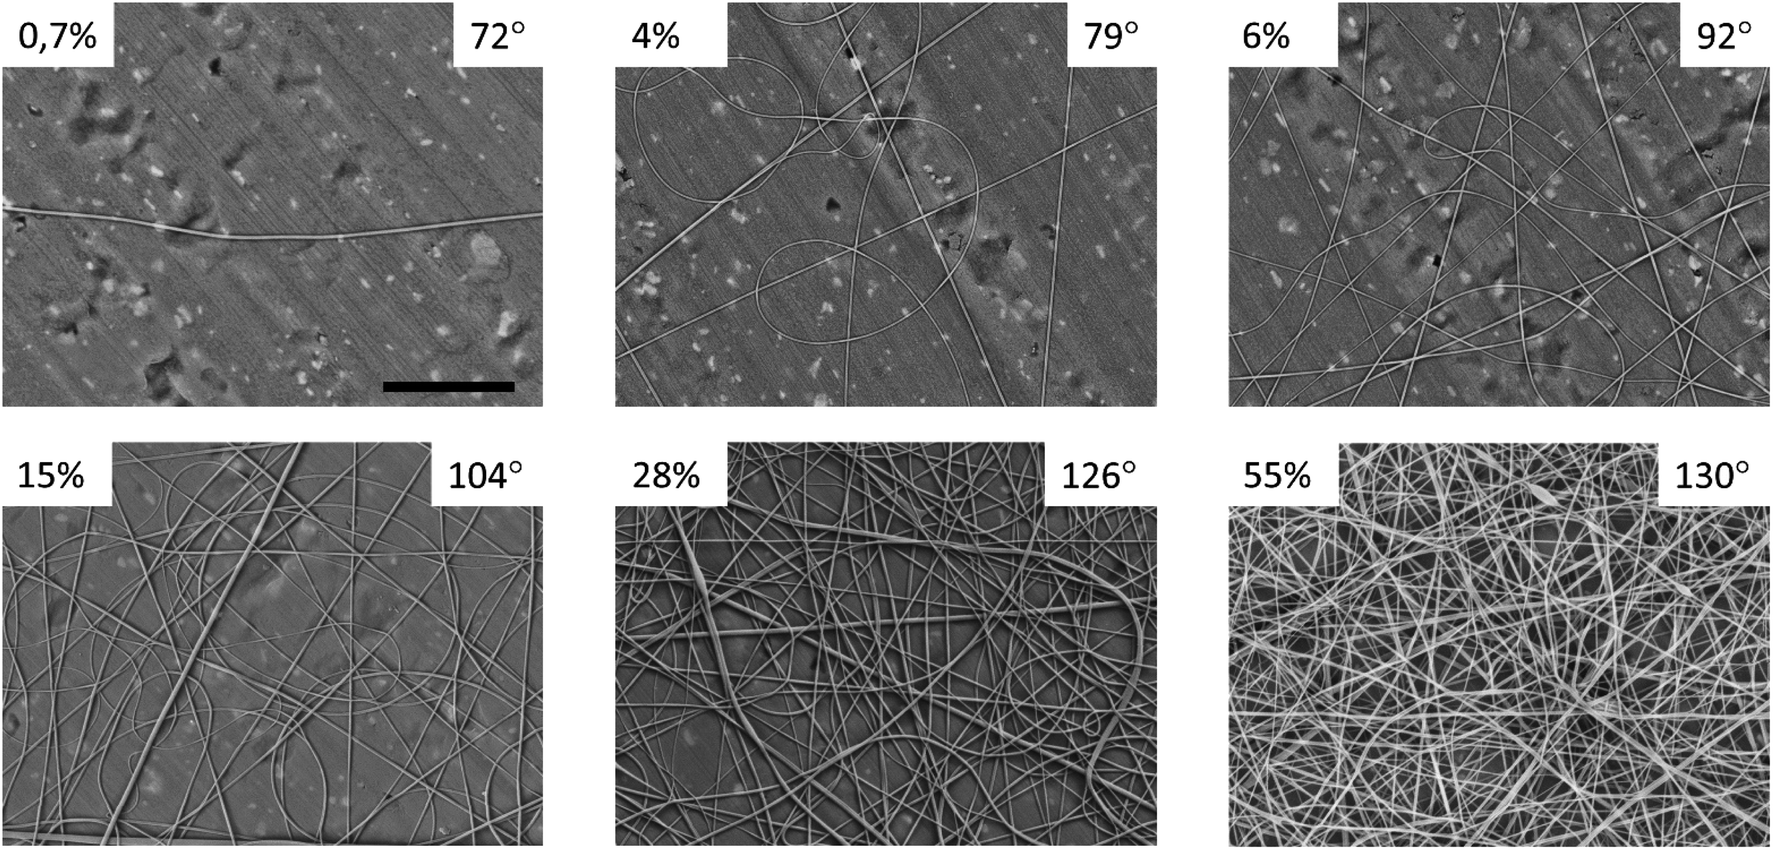 | ||
| Fig. 3 SEM images of individual points from the “gradient” nylon-11 samples. The numbers indicate the surface coverage and the contact angle. The scale bar is 10 μm, the same for all the images. | ||
We used SEM images to estimate the maximum thickness of the gradient samples. We regarded the overlapping fibers as layers and estimated the maximum number of these layers as 15, so the thickness h can be estimated as h ≤ 4 μm. This was far smaller than the thickness of the free-standing electrospun mats (70–90 μm).
We traced the influence of the surface coverage on the contact angle (Fig. 4). Each point in this graph was obtained by a two-stage experiment: first, placing a drop onto the surface for the contact angle measurement and, second, SEM measurements of the surface coverage (this step included drying of the sample and depositing a metal layer onto the surface). The colours of points in Fig. 4 correspond to the three independent repeats of the experiment – the gradient sample was prepared three times according to the same procedure.
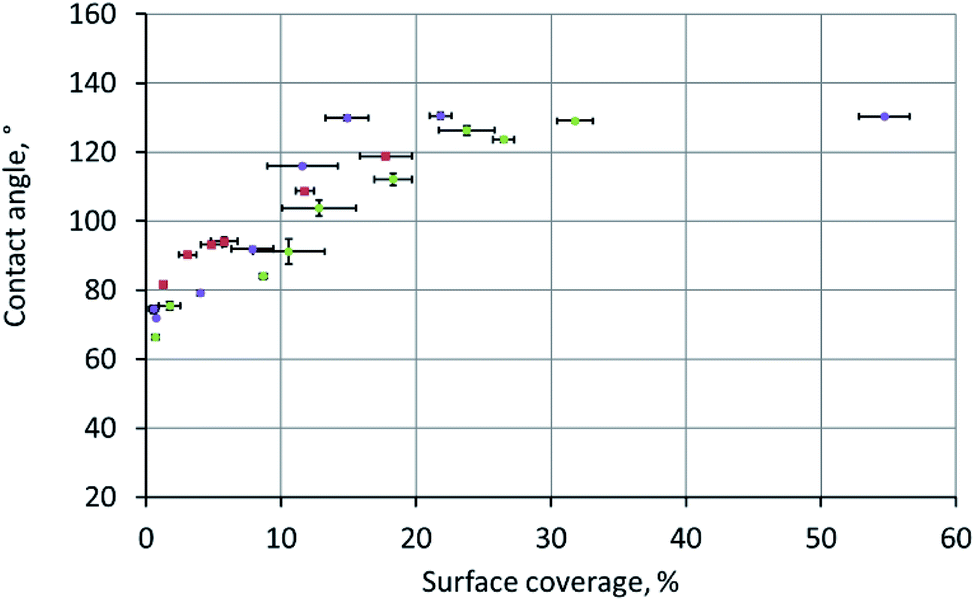 | ||
| Fig. 4 The influence of the surface coverage on the contact angle. | ||
At coverage below ∼20%, the contact angle increased linearly with the coverage. However, at ∼20% coverage, the contact angle reached its maximum (equilibrium) value of 124 ± 7°, which perfectly matched the 126 ± 2° contact angle observed on the surface of a free-standing nylon-11 mat. We interpreted this transition as the moment when the “supported fibers” became a mat. This two-stage dependence is the key conclusion of the current work.
It can be qualitatively explained as follows. When we place a water drop onto the sample, the bottom part of the drop can interact with one of the three substances: aluminium, nylon-11, or air. As we increase the surface coverage by adding fibers to the surface, we decrease the water–aluminium contact probability. At approximately 17–20% coverage, the water–aluminium contact becomes improbable and negligible, so the sample behaves as a free-standing nylon-11 mat.
Discussion
Measurements of the CA of electrospun samples
The experiment described above allowed us to trace the relation between the fraction of the substrate occupied by the fibers and the CA. The typical diameter of the gradient samples was ∼200 mm, with a region of bare substrate at the edge. The examined points were located at a distance of at least dmacro = 7 mm from each other. The typical lateral size of the water drop was ddrop ∼ 1 mm < dmacro. We estimated the maximum gradient of the surface coverage as 1% per 1 mm, so within a single experimental point (the contact area between a single water drop and the substrate), the surface coverage can be regarded as constant.The size of the SEM frame was in the range from 16.5 μm × 12.4 μm (at ×10![[thin space (1/6-em)]](https://www.rsc.org/images/entities/char_2009.gif) 000 magnification) to 110.4 μm × 82.8 μm (the ×1500 magnification). In the whole indicated range, the typical frame size was smaller than the drop size ddrop, so we captured several frames to estimate the surface coverage.
000 magnification) to 110.4 μm × 82.8 μm (the ×1500 magnification). In the whole indicated range, the typical frame size was smaller than the drop size ddrop, so we captured several frames to estimate the surface coverage.
The meaning of the error bars in Fig. 4 is worth an explanation. Each vertical error bar was calculated as the standard deviation over N = 60 measurements recorded during 1 minute of observation. Each horizontal error bar was obtained as the standard deviation of at least four surface coverage values calculated as described in the ESI.† The variations in local surface coverage were more significant than the variations of the contact angles.
SEM imaging of polymer samples requires coating them with a thin metal layer. In our experiments, we carried out the CA measurements prior to SEM imaging because we did not want the metal coating to influence the CA. We implied that the fibers' diameters and the sample's overall morphology remained intact after the CA measurement. This assumption seems reasonable since nylon-11 demonstrates low swelling in water; the typical swelling in ambient humidity is typically 0.245 wt% (ref. 25); nylon-11 – based films can be used as barriers for water.26
Electrospun mats usually retain residual electrostatic charge after manufacturing.27–29 The charge facilitates the wetting of the sample surface with water, regardless of the charge sign.30 In our experiments, we neglected the charge-related effects for two reasons. First, the typical time between the sample preparation and CA measurement was 1–2 weeks, which is usually enough to eliminate the residual charge.28 Second, the aluminium substrate used for the gradient samples facilitated the charge removal.
The relation between the substrate coverage and the CA was previously examined for the nylon-6 fibers.31 The variation of the surface coverage was achieved by varying the electrospinning time; the fibers were deposited onto a polymer-coated glass slide. In contrast with the current study, the authors of ref. 31 did not observe the transition from the monotonous growth to a plateau.
The CA of poly(methyl methacrylate) electrospun mats were found to be independent of the thickness of the mat.2 This result does not contradict the data presented above because it was obtained for the mats with a thickness between 35 and 134 μm, far larger than the thickness of our gradient sample (h ≤ 4 μm). Even at the left point of this range, the mats were macroscopic, and the surface coverage was relatively large (45.20 ± 15.55%). In the context of our experiments, it means that the samples described in ref. 2 were at the plateau of the graph shown in Fig. 4.
Theoretical considerations
Let us regard a one-dimensional system that consists of infinite fibers located near a flat surface (Fig. 5 A). Placement of the fibers at a distance above the surface accounted for the growth of the mat thickness – as the mat thickness increased, the top layer position shifted upward from the substrate. The height of the water drop (typically ∼1 mm) is small, so we can neglect the gravity.32,33 It is a common assumption used for the analysis of the interaction between a liquid and fibers.14–16,34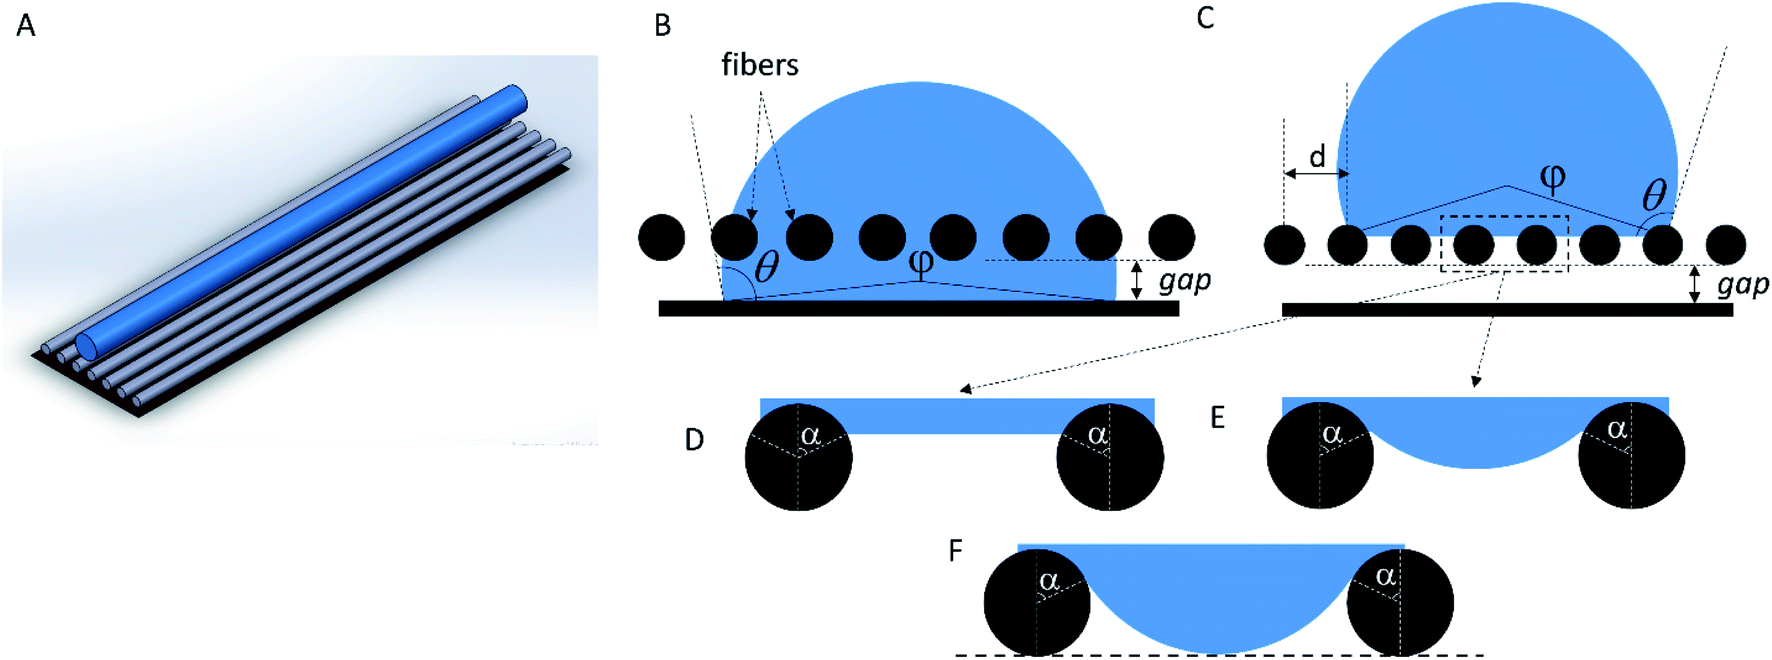 | ||
| Fig. 5 Schematic presentation of the model water drop on top of the parallel fibers. (A) The overall scheme, (B) the “full spreading” case, (C) the “non-contact” (Cassie–Baxter case). (D), (E), and (F) show different shapes of the water meniscus between the adjacent fibers. | ||
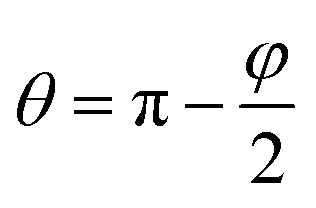
We can assess two possible states of the drop. First, if the fibers are sparse and hydrophilic, the drop penetrates between them and touches the substrate (Fig. 5 B). This “full spreading” state is likely to emerge at low surface coverage. Second, if the fibers are dense and hydrophobic, they do not let the drop touch the substrate (Fig. 5C). Both states can be described using the central angle φ, which relates to the CA of the sample θ:
 | (1) |
We calculated the energies of the two cases (Fig. 5B and C) as described in the ESI† and minimized them using a Python script to determine the equilibrium angle φ and the corresponding energy. The model relies on the five surface energies of the contacts within the system: water–air, water–substrate, water–nylon, substrate–air, and nylon–air. The calculations were carried out for different values of the distance d, which accounted for the variations of coverage. If we neglect the overlapping of the fibers, the 2r/d ratio is equal to the surface coverage measured using SEM.
If the drop is in the “full spreading” state, the CA should increase linearly with coverage, as shown in Fig. 6A (blue dots). This can explain the growth of the CA observed experimentally at low coverage (Fig. 4).
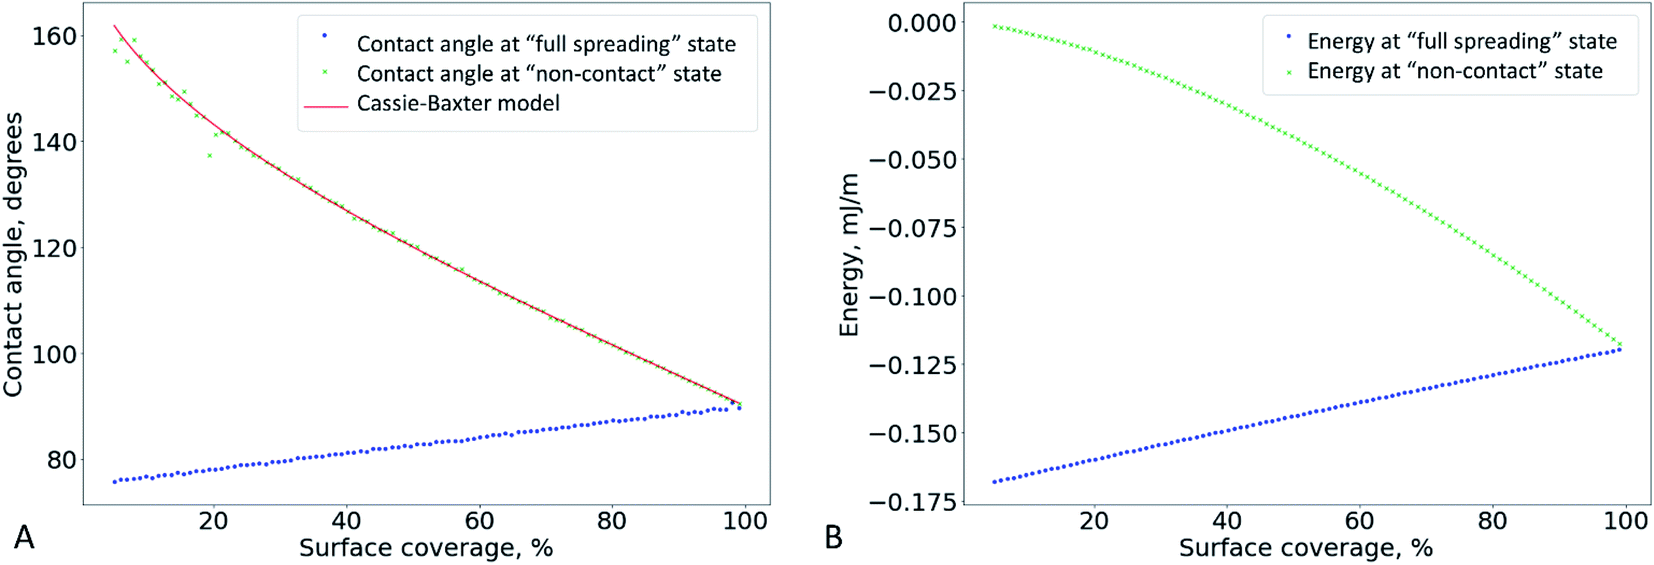 | ||
| Fig. 6 The contact angles (A) and the energies (B) calculated by the energy minimization for the “non-contact” and the “full spreading” cases (green and blue, respectively). The angles calculated using the Cassie–Baxter formula are shown in red (A). The “full spreading” state was analyzed at a 300 nm gap. | ||
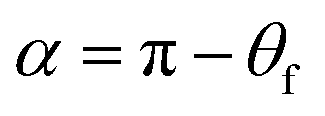
However, as the surface density of the fibers increases, we should come to the “non-contact” state (Fig. 5C). If the bottom part of the drop is considered flat (Fig. 5 D), we can determine the angle α between the bottom part of the drop and a single fiber as the CA at a curved surface (the CA of the film is θf):32,33
 | (2) |
In this case, we can use the classical Cassie–Baxter model,18,35 which describes the contact between a liquid drop and a two-phase substrate (in our case, the two phases are nylon-11 and air). When this model is applied to a set of parallel fibers,1,18–20 the contact angle θCB can be calculated as
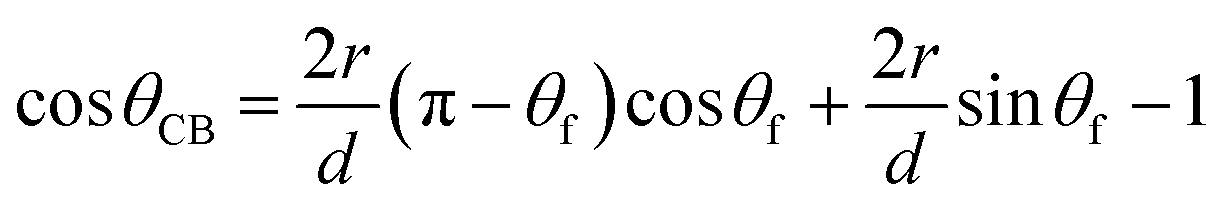 | (3) |
The CA of the film θf is often referred to as Young's contact angle.1,18,19,36
Based on this relation, we can expect that the observed contact angle θCB should decrease as the coverage increases (Fig. 6A, the red and green markers). A deviation of the experimental CA values from the ones calculates using the Cassie–Baxter model was observed previously for the electrospun mats made of nylon-6.31
The system switches from the “non-contact” state to the “full spreading” state if the drop penetrates the pores and touches the substrate. However, if the bottom part of the drop is flat (Fig. 5 D), it will not allow the formation of the contact between water and the foil substrate. Indeed, the water level is always higher than the bottom plane of the fibers, so the water does not touch the surface even if the distance d between the fibers is macroscopically large. To make the model more realistic, we can assume that the water surface between the fibers has a fixed curvature radius (Fig. 5 E), which is equal to the macroscopic drop radius R. In this case, the angle α is not fixed; it can be varied to minimize the system energy. The change from the flat surface to the curved one slightly increases the contribution of the lower part of the drop into the total system energy. However, energy estimation shows that this contribution is still small, and it is typically accompanied by a less than 1% relative change in the CA.
We can estimate the minimum distance between the fibers, which will allow the drop to penetrate down to the bottom plane of the fibers (Fig. 5F). Using the geometrical constraints, we get
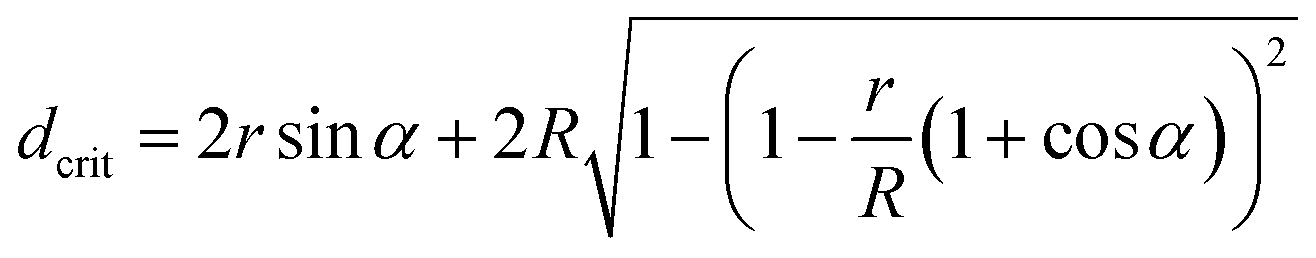 | (4) |
Thus, we can qualitatively explain the two different experimental trends – the linear growth of the CA and plateau in Fig. 4. However, the transition between the “full spreading” and “non-contact” states cannot be explained by this deterministic approach. From the energetical point of view, the “non-contact” state should never be achieved because the energy of the “full spreading” state is always lower (Fig. 6 B). The reason for this inconsistency is the stochastic nature of the wetting process,38–40 which is not captured by the deterministic models. For each pore, water either penetrates through it or is pinned (Fig. 5 D–F) at a certain probability. Further theoretical research is needed to incorporate this probability into the wetting model for a liquid drop on a non-woven material.
Besides, in the described models, we neglected several aspects of the interaction between the water drop and the fibers. First, we neglect the water vapor, which is captured in the pores between the fibers.40 Since the pore volume is low and the top part of the pore is sealed by the water drop, we can expect a large local humidity inside the pores. It will facilitate the condensation of a water film on the fibers' surface and the transition from the “non-contact” state to the “full spreading” one. Second, we regard a two-dimensional system instead of a three-dimensional one, and this simplification allows us to capture the phenomena only at a qualitative level. Finally, the measurements of the pores using SEM are usually prone to errors.41 These reasons can explain the large value of dcrit calculated above.
Conclusions
As we deposit electrospun fibers onto a substrate, they form a mesh with a gradually increasing thickness and decreasing pore size. In our experiments with nylon-11, we observed a change in the samples' wetting behaviour when the surface coverage achieved ∼17–20%, and the pore size decreased down to 2.5 ± 1.3 μm. This change can be regarded as the transition from a set of individual fibers to a mat. Further research is needed to find the dependence of this threshold coverage on the diameter of the fibers and their packing.A deeper analysis shows that the surface coverage measured using SEM seems overestimated if compared with the surface coverage in the outmost layer of the mat. Estimating the exact number of the fibers which contribute to the interaction with the liquid is challenging. A possible approach to this problem can use optical microscopy (confocal microscopy or one of its far-field super-resolution modifications42) to control the penetration of the liquid into the pores.40 Hopefully, with this setup, one can estimate the penetration of the drop into the mat and verify the applicability of certain theoretical models.
The results obtained in the current study can be used to prepare hydrophobic coatings on household goods, personal protective equipment, and other applications. Indeed, we demonstrate that relatively low surface coverage is enough to ensure surface hydrophobicity. This result can help us to prepare hydrophobic coatings made of stable constructional polymers, such as polypropylene or poly(ether ether ketone).
Conflicts of interest
There are no conflicts to declare.Note after first publication
This article replaces the version published on 18th March 2021, which contained errors in eqn (4).Acknowledgements
Our research was supported by the Russian Science Foundation, project no. 19-74-00037 (electrospinning and theoretical analysis), and the Interdisciplinary Scientific and Educational School of Moscow University “Molecular Technologies of the Living Systems and Synthetic Biology” (SEM imaging). The authors thank CJSC “MINC” (Dubna Nanocenter) for providing the Kruss DSA 25E device and A. P. Moskalets for assistance with the contact angle measurements.References
- U. Stachewicz, R. J. Bailey, H. Zhang, C. A. Stone, C. R. Willis and A. H. Barber, ACS Appl. Mater. Interfaces, 2015, 7, 16645–16652 CrossRef CAS PubMed.
- P. K. Szewczyk, D. P. Ura, S. Metwally, J. Knapczyk-Korczak, M. Gajek, M. M. Marzec, A. Bernasik and U. Stachewicz, Polymers, 2019, 11, 34 CrossRef PubMed.
- G. Yin, Q. Zhao, Y. Zhao, Y. Yuan and Y. Yang, J. Appl. Polym. Sci., 2013, 128, 1061–1069 CrossRef CAS.
- V. A. Ganesh, A. S. Ranganath, A. Baji, H. C. Wong, H. K. Raut, R. Sahay and S. Ramakrishna, Macromol. Mater. Eng., 2016, 301, 812–817 CrossRef CAS.
- S. Kim, S. G. Park, S. W. Kang and K. J. Lee, Macromol. Mater. Eng., 2016, 301, 818–826 CrossRef CAS.
- F. L. Huang, Q. Q. Wang, Q. F. Wei, W. D. Gao, H. Y. Shou and S. D. Jiang, Express Polym. Lett., 2010, 4, 551–558 CrossRef CAS.
- A. Díaz, L. J. Del Valle, D. Tugushi, R. Katsarava and J. Puiggalí, Mater. Sci. Eng. C, 2015, 46, 450–462 CrossRef PubMed.
- A. K. Haridas, C. S. Sharma, V. Sritharan and T. N. Rao, RSC Adv., 2014, 4, 12188 RSC.
- Y. Konosu, H. Matsumoto, K. Tsuboi, M. Minagawa and A. Tanioka, Langmuir, 2011, 27, 14716–14720 CrossRef CAS PubMed.
- Z. Lu, T. W. Ng and Y. Yu, Int. J. Heat Mass Transf., 2016, 93, 1132–1136 CrossRef.
- G. McHale, S. M. Rowan, M. I. Newton and N. A. Käb, J. Adhes. Sci. Technol., 1999, 13, 1457–1469 CrossRef CAS.
- B. Miller, L. S. Penn and S. Hedvat, Colloids Surf., 1983, 6, 49–61 CrossRef CAS.
- W. J. Jasper and N. Anand, J. Mol. Liq., 2019, 281, 196–203 CrossRef CAS.
- A. Sauret, A. D. Bick, C. Duprat and H. A. Stone, Europhys. Lett., 2014, 105, 56006 CrossRef.
- A. Sauret, F. Boulogne, D. Cébron, E. Dressaire and H. A. Stone, Soft Matter, 2015, 11, 4034–4040 RSC.
- A. Sauret, F. Boulogne, B. Soh, E. Dressaire and H. A. Stone, Eur. Phys. J. E, 2015, 38, 62 CrossRef PubMed.
- S. Li and A. H. Barber, MRS Online Proc. Libr., 2012, 1424, 43–48 Search PubMed.
- A. B. D. Cassie and S. Baxter, Trans. Faraday Soc., 1944, 40, 546 RSC.
- M. Ma, Y. Mao, M. Gupta, K. K. Gleason and G. C. Rutledge, Macromolecules, 2005, 38, 9742–9748 CrossRef CAS.
- H. J. Lee, C. R. Willis and C. A. Stone, J. Mater. Sci., 2011, 46, 3907–3913 CrossRef CAS.
- G. R. Choi, J. Park, J. W. Ha, W. D. Kim and H. Lim, Macromol. Mater. Eng., 2010, 295, 995–1002 CrossRef CAS.
- E. R. Pavlova, D. V. Bagrov, K. Z. Monakhova, A. A. Piryazev, A. I. Sokolova, D. A. Ivanov and D. V. Klinov, Mater. Des., 2019, 181, 108061 CrossRef CAS.
- J. Schindelin, I. Arganda-Carreras, E. Frise, V. Kaynig, M. Longair, T. Pietzsch, S. Preibisch, C. Rueden, S. Saalfeld, B. Schmid, J.-Y. Tinevez, D. J. White, V. Hartenstein, K. Eliceiri, P. Tomancak and A. Cardona, Nat. Methods, 2012, 9, 676–682 CrossRef CAS PubMed.
- T. Fort, in Contact Angle, Wettability, and Adhesion, American Chemical Society, 1964, pp. 302–309 Search PubMed.
- S. Acierno and P. Van Puyvelde, J. Appl. Polym. Sci., 2005, 97, 666–670 CrossRef CAS.
- J. Jin, R. Rafiq, Y. Q. Gill and M. Song, Eur. Polym. J., 2013, 49, 2617–2626 CrossRef CAS.
- D. Lovera, C. Bilbao, P. Schreier, L. Kador, H.-W. Schmidt and V. Altstädt, Polym. Eng. Sci., 2009, 49, 2430–2439 CrossRef CAS.
- G. Collins, J. Federici, Y. Imura and L. H. Catalani, J. Appl. Phys., 2012, 111, 044701 CrossRef.
- U. Stachewicz, C. A. Stone, C. R. Willis and A. H. Barber, J. Mater. Chem., 2012, 22, 22935 RSC.
- L. K. Koopal, Adv. Colloid Interface Sci., 2012, 179–182, 29–42 CrossRef CAS PubMed.
- U. Stachewicz, C. Benett and A. H. Barber, Mater. Res. Soc. Symp. Proc., 2012, 1403, 47–51 CrossRef.
- V. A. Lubarda and K. A. Talke, Langmuir, 2011, 27, 10705–10713 CrossRef CAS PubMed.
- D. Wu, P. Wang, P. Wu, Q. Yang, F. Liu, Y. Han, F. Xu and L. Wang, Chem. Phys., 2015, 457, 63–69 CrossRef CAS.
- H. Princen, J. Colloid Interface Sci., 1970, 34, 171–184 CrossRef CAS.
- A. Marmur, Langmuir, 2003, 19, 8343–8348 CrossRef CAS.
- D. Y. Kwok and A. W. Neumann, Contact angle measurement and contact angle interpretation, 1999, vol. 81 Search PubMed.
- X. F. Yang and X. M. Xi, J. Mater. Sci., 1995, 30, 5099–5102 CrossRef CAS.
- M. Nosonovsky and B. Bhushan, Microsyst. Technol., 2006, 12, 231–237 CrossRef CAS.
- M. Nosonovsky and B. Bhushan, J. Phys.: Condens. Matter, 2008, 20, 225009 CrossRef.
- E. Søgaard, N. K. Andersen, K. Smistrup, S. T. Larsen, L. Sun and R. Taboryski, Langmuir, 2014, 30, 12960–12968 CrossRef PubMed.
- A. Rawal, J. Text. Inst., 2010, 101, 350–359 CrossRef.
- G. Huszka and M. A. M. Gijs, Micro Nano Eng., 2019, 2, 7–28 CrossRef.
Footnote |
| † Electronic supplementary information (ESI) available. See DOI: 10.1039/d0ra10788c |
| This journal is © The Royal Society of Chemistry 2021 |