 Open Access Article
Effects of alkanolamine solvents on the aggregation states of reactive dyes in concentrated solutions and the properties of the solutions
Chuangui Cao†
a,
Zhihui Zhao†a,
Yong Qia,
Hui Penga,
Kuanjun Fangab,
Ruyi Xie*ab and
Weichao Chen *ab
*ab
aCollege of Textiles & Clothing, State Key Laboratory of Bio-Fibers and Eco-Textiles, Collaborative Innovation Center for Eco-Textiles of Shandong Province, Qingdao University, Qingdao 266071, China. E-mail: chenwc@qdu.edu.cn
bNational Manufacturing Innovation Center of Advanced Dyeing and Finishing Technology, Tai'an 271001, China
First published on 16th March 2021
Abstract
The aggregation of dyes is a common phenomenon in solutions, particularly concentrated solutions, which seriously affects the dyeing and printing processes. In this study, the effects of alkylamine solvents on the reactive dye aggregation behavior in highly concentrated solutions was studied. Typical cases were conducted with two slightly toxic and environmentally friendly solvents, namely diethanolamine (DEA) and triethanolamine (TEA), and two reactive dyes, namely C. I. Reactive Red 218 (R-218) and C. I. Reactive Orange 13 (O-13). Aggregation states were studied by ultraviolet-visible (UV-Vis) absorption spectroscopy, Gaussian-peak-fitting method and fluorescence spectroscopy. The results showed that both the additives DEA and TEA could reduce the dye aggregation because the solvents, DEA and TEA, can break the iceberg structure and allow easy entry of the molecules into the dye aggregates. Also, the disaggregation caused by DEA was higher as compared with TEA, which may be caused by the weaker hydrogen bond and the relatively smaller steric hindrance effects of DEA. The schematic of disaggregation between R-218 and DEA was also discussed. For R-218, the dimers were disaggregated to monomer, while the higher-ordered aggregates were disaggregated to trimers and dimers for O-13. Moreover, physical properties such as viscosity and surface tension of the solutions were measured. This investigation is instructive for the further dyeing progress with organic bases in the textile industries.
1. Introduction
The aggregation behavior of small molecules, particularly, dye molecules with planar benzene ring structures usually tend to self-aggregate because of the molecular interactions in solution phase.1–3 This behavior has an important impact on their applications in textile, biological, colloid and other fields.4–6 Among the various types of dyes, azo reactive dyes used for cellulose fiber dyeing and printing have drawn special attention because of their variety and bright color. However, reactive dyes tend to aggregate in solutions due to their good planarity.7,8 When dye molecules are dissolved in water, the hydrophilic parts tend to attract water, while the aromatic rings of azo reactive dyes overlap to form a stack due to the π–π interaction; therefore, the water molecules form a hydration layer via hydrogen bonds around the stack,9,10 which is known as Frank's iceberg.11 During the process of dyeing and printing, auxiliaries are generally added to improve the fixing and printing effects.12 The additives are mainly used for increasing the solubility and adjusting the properties of the dye solution to improve printing effects.13–15 Moreover, the adsorption and diffusion of dyes can be affected by the aggregation state. In the process of dyeing, inorganic bases are commonly used for the fixing process, but the interactions between alkanolamine solvents and the aggregation state are not clear in concentrated solutions. Therefore, it is quite necessary to study the interactions between the alkanolamine solvents and azo reactive dyes on the aggregation behavior and the dye solution properties in the concentrated solution in order to guide the future dyeing research.The aggregation states are also influenced by the solution environments, such as the other additives. The addition of urea, ethanol and pyridine in the dye solution reduces the degree of dye aggregation.9,10,16 However, previous reports mainly focused on the study of aggregation states in dilute solutions; however, in dye industries, concentrated dye solutions are often used. Therefore, it is necessary to investigate the aggregation state of dye molecules in concentrated solutions. Water-soluble polymers17–19 and additional organic solvents, such as lactam compounds, ethylene glycol can obtain better inkjet printing effects20–23 because these are mainly used to reduce the formation of satellite droplets at high concentrations. The aggregation behavior is also affected by salts, particularly, by the metal ion salts in solutions. Ravishanker24 and Herz et al.25 reported that the “iceberg” structure of neighboring dye molecules was destroyed by electrolytes, leading to the enhancement in the degree of dye aggregation. Mostafa et al.10 found that the length and cross section of the Acidic Red 266 aggregates increased significantly and the aggregation of Reactive Red 9 and Orange 13 were both enhanced in the presence of electrolytes in dye solutions.26 In the dyeing process, the addition of inorganic bases may also cause the dye aggregation. Moreover, an important factor in the dyeing process is the rapid diffusion of dye molecules into the fiber, a process that requires maximum disaggregation of the dye aggregates. In addition, the adsorption and diffusion of dye molecules into the fiber are also related to the properties of the dye solution. Therefore, the aggregation states and the physical parameters, viscosity and surface tension of the dye solution play an important role for their application in the textile field. Therefore, it is necessary to study the interactions between organic bases and azo reactive dyes on the properties and aggregation states of the dye solution.
Alkali conditions are essential for the fixation of reactive dyes. Inorganic bases are mainly used in traditional dyeing, but they are usually consumed in a great quantity, causing defects in textiles during the traditional production of dyeing. Here, two alkali alkanolamine solvents, namely diethanolamine (DEA) and triethanolamine (TEA), were added into the concentrated solutions of two azo reactive dyes, namely C. I. Reactive Red 218 (R-218) and C. I. Reactive Orange 13 (O-13). The effects of the solvents to the aggregation states of dyes were investigated via ultraviolet-visible (UV-Vis) absorption spectroscopy, Gaussian-peak-fitting and fluorescence spectroscopy. Properties such as surface tension and viscosity of dye solutions were also investigated. Results revealed that additional DEA and TEA could suppress the aggregation of R-218 and O-13 through the hydrophobic effects of DEA and TEA. The different aggregation states for R-218 and O-13 solutions could have been the result of different effects among numerous dye/solvent combinations of the dyes' chemical structures and physical properties of the solvents. The smaller space steric hindrance of dye molecules, lower hydrogen bonding force, and smaller space steric hindrance of the solvent could also reduce the dye aggregation states. In addition, the surface tension and viscosity of dye solutions also changed by the aggregation behaviour of the two dyes and physical properties of the solvents. These results are instructive for advancing the dyeing progress.
2. Experimental
2.1 Materials
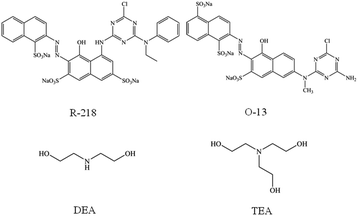
High-purity R-218 and O-13 were supplied by Everlight Chemical Industrial Corporation. TEA and DEA (AR 99%) were provided by Shanghai Aladdin Biochemical Technology Co. Ltd. Ultra-pure water with a resistivity of 18.2 MΩ cm at 25 °C was used throughout the experiment. The structures of the two dyes (R-218 and O-13) and two additional solvents (DEA and TEA) are displayed in Fig. 1.2.2 Preparation of the concentrated solutions
1 wt%, 2 wt%, 3wt%, 4wt% and 5wt% aqueous solutions (aq) of DEA and TEA were prepared, respectively, and then were used to dissolve R-218 and O-13 to the uniform concentration of 1 mM and 100 mM. R-218/O-13 dissolved in pure water with the concentration for 10 mM, 20 mM, 50 mM and 100 mM were also prepared.2.3 Measurements
UV-vis absorption spectroscopy was performed on an AU-3900H UV spectrophotometer (Hitachi High-tech Co, Ltd, Tokyo, Japan). A micro-cuvette with an optical path of 0.01 mm was used to escape high concentration-induced analysis errors.Fluorescence spectroscopy was performed on an FS5 Fluorescence Spectrometer (Edinburgh Instruments Ltd, Kirkton Campus, UK) at 25 °C.
Dynamic surface tension was measured by a Bubble Pressure Tensiometer BP-100 (Bubble Pressure Tensioeter company, KRUSS, Germany) at 25 °C.
The viscosity of the samples was recorded using a FLUDICAM RHEO microfluidic visual rheometer (Formulaction company, Toulouse, France) at 25 °C.
3. Results and discussions
3.1 UV-vis absorption spectroscopy
The UV-vis absorption spectroscopy is the most commonly used method to understand the changes in dye aggregation states in solutions.27–29 It has been found that dye aggregation can be split into two main types: one is the blue-shift observed in the dimer peak relative to the monomer peaks that form H-aggregates, and the other is J-aggregates, conversely.30–33 Fig. 2a and b show that the UV-vis absorption spectra of R-218 and O-13 with different concentrations in aqueous solutions, respectively. According to their specific molecular structures, both R-218 and O-13 tend to form face-to-face parallel arrangements (H-aggregates) by π–π stacking interactions of the planar parts. For this type of aggregation, the maximum UV-vis absorbance peak of the aggregates is blue-shifted compared to the monomer.34,35 For R-218, the peaks at 555 nm and 518 nm belonged to the absorption of monomers and dimers, respectively, and the shoulder peaks around 480 nm belonged to the higher-ordered aggregates. Similarly, for O-13 (Fig. 2b), the peaks at 520 nm, 478 nm and around 400 nm belonged to monomers, dimers, and higher-order aggregates, respectively. For the two dyes, the changes in the peaks indicated variation in the aggregation states. Obviously, for R-218, with the increase in the dye concentration, the absorption intensity at the monomer peak gradually decreased. For O-13, the intensity of higher-ordered aggregates increased. That may be due to the increase in the number of dye molecules in the dye solution, resulting in the increase in entropy, and the chance of collision between dye molecules was increased, thus, the aggregation of dye molecules was enhanced.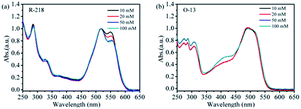 | ||
| Fig. 2 The UV-vis absorption spectra of the two dye aqueous solutions with different concentrations, (a) R-218, (b) O-13. | ||
Fig. 3 shows the UV-vis absorption spectra of R-218 and O-13 in aqueous solutions and different concentrations of DEA/TEA. All spectra were normalized with respect to the maximum absorption peak. For R-218, the absorbance of monomers gradually increased with the increase in the DEA/TEA concentration. It indicated that DEA and TEA caused the disaggregation of R-218 in the solutions. Moreover, the degree of disaggregation influenced by DEA was much larger as compared to TEA. However, for O-13, the absorption of monomers barely changed, but the peaks of aggregates (350–450 nm) changed regularly with the increasing concentration of DEA. The spectra of O-13/TEA combination had no obvious changes. In order to investigate further the quantitative changes in dye aggregation states in different solutions, Gaussian-peak-fitting of the spectra was conducted.
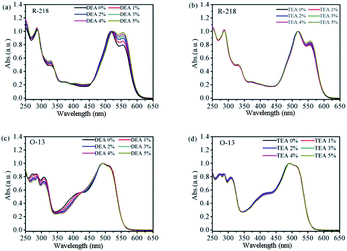 | ||
| Fig. 3 The UV-vis absorption spectra of R-218 (a and b) and O-13 (c and d) in DEA and TEA solutions with different concentrations. | ||
We calculated DEA/TEA with a mass ratio of 1–5% into the moles, which is more conducive to quantitatively compare the changes in the two dye aggregate states; λm/λd and λm/λh are the intensities of the UV-vis absorption spectra between the monomer peak (λm) and the dimmers (λd) and the higher-ordered aggregates (λh), respectively. It can be seen from Fig. 4a that for R-218 the intensity of λm/λd gradually increased with the increase in the mole content of DEA/TEA, and the λm/λd of DEA is higher compared to that of TEA with the same mole content in the dye solution. From the same calculation, for O-13 (Fig. 4b and c), it also can be also seen that with the increasing in the mole ratio of DEA/TEA, the ratio of λm/λd showed slight variations, while the ratio of λm/λh changed significantly. When the same moles of DEA/TEA were added to the dye solution, additional changes in DEA were higher as compared to TEA. This result shows that DEA has better performance in inhibiting the dye aggregation compared to TEA; these changes are also consistent with the results in UV-vis absorption spectroscopy.
 | ||
| Fig. 4 The intensity of the UV-vis absorption spectra of R-218 (a) and O-13 (b and c) in the same mole of DEA and TEA. (a) The λm/λd of R-218, (b) the λm/λd of O-13, (c) the λm/λh of O-13. | ||
3.2 Gaussian-peak-fitting curves
Fig. 5 shows the Gaussian-peak-fitting curves. All the fitting coefficients were larger than 99.99%. The fitting curves of R-218 and O-13 were divided into 3 peaks and 4 peaks, respectively. Peak 1 of each curve corresponded to the dye monomer, while peaks 2–4 corresponded to dimers, trimers, and higher-ordered aggregates, respectively. The integral area of each peak was calculated in the form of proportion as provided in Table 1, which was then used to explore the quantitative changes in the aggregation states. It can be seen from Table 1 that for R-218 in a 5% DEA solution the proportion of peak 2 (dimer) and peak 3 (trimer) reduced by 20.20% and 10.42%, while the area of peak 1 (monomer) increased by 14.98%. However, the area of peak 2 and peak 3 only reduced by 3.51% and 2.94%, respectively, while that of peak 1 increased by 5.09% in a 5% TEA solution. As previously discussed, these results indicated that both the addition of DEA and TEA lead to the disaggregation of R-218; however, DEA had much more impact on the disaggregation effect compared to TEA. In addition, for R-218, the disaggregation effects on dimers were larger compared to higher-ordered aggregates. For O-13 in the 5% DEA solution, the proportion of peak 4 (higher-ordered aggregates) decreased by 11.78%, while peak 3 (trimer), peak 2 (dimer) and peak 1 (monomer) increased by 12.08%, 3.47% and 0.83%, respectively. This result suggested that DEA caused the disaggregation of higher-ordered aggregates mainly into trimers rather than in dimers and monomers. The aggregation states of O-13 in the 5% TEA solution changed a little, but a positive effect could still be observed. These different changes in the aggregation states of R-218 and O-13 were due to the distinct molecular structures of the two dyes. As shown in Fig. 1, the non-conjugated part for R-218 was located at the α-position of the naphthalene ring, while is situated at the β-position for O-13. Therefore, the steric hindrance of O-13 molecules is smaller than of R-218. That is why bigger aggregates were much easier to observed in O-13 solutions. It was also the reason for the disaggregation of O-13 that occurred in higher-ordered aggregates.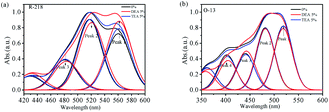 | ||
| Fig. 5 Gaussian-peak-differentiating-imitating curves of the UV-vis absorption spectra of R-218 (a) and O-13 (b) in different solvents. | ||
| Dyes | Solvents | Area contributions of peaks (%) | |||
|---|---|---|---|---|---|
| Peak 1 | Peak 2 | Peak 3 | Peak 4 | ||
| R-218 | 0% | 32.98 | 41.33 | 17.66 | |
| 5% DEA | 37.86 | 37.15 | 15.82 | ||
| 5% TEA | 34.66 | 39.93 | 17.41 | ||
| O-13 | 0% | 29.06 | 28.26 | 16.56 | 15.96 |
| 5% DEA | 29.30 | 29.24 | 18.56 | 14.08 | |
| 5% TEA | 29.50 | 28.51 | 16.34 | 15.50 | |
3.3 Fluorescence spectroscopy
Fluorescence spectroscopy is also an important measure to analyze the aggregation state of dyes.36,37 The increasing degree of dye aggregation could reduce the intensity of fluorescence.38 As shown in Fig. 6a and b, for R-218, the fluorescence intensity gradually increased with the increase in the concentration of DEA/TEA in dye solutions. Fig. 6c, the fluorescence intensity of R-218 with DEA is higher compared to that of TEA. The change in the fluorescence intensity was consistent with the ultraviolet absorption spectra (Fig. 3a and b). These results showed that both the addition of DEA and TEA could reduce the degree aggregation of R-218, and DEA had a bigger impact on the disaggregation effects compared to TEA. For O-13, as shown in Fig. 6d–f, the fluorescence intensity also increased with the increase in the DEA/TEA content in dye solutions, and the intensity with DEA was higher compared with that of TEA. However, the fluorescence intensities of O-13 and R-218 with 5% DEA were 115 and 8790, respectively, which indicate that the highest disaggregation was observed to the R-218/DEA combination. These results are consistent with the UV-vis absorption spectra (Fig. 3 and 5).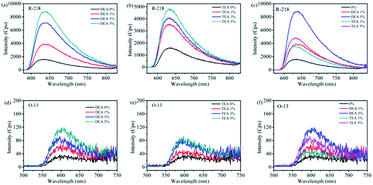 | ||
| Fig. 6 Fluorescence spectra of R-218 (a–c) and O-13 (d–f) in DEA and TEA solutions with different contents, the concentration of dye solutions is 1 mM. | ||
3.4 The interactions between R-218 and DEA
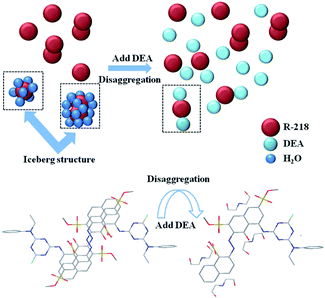
Hydrogen bonds and hydrophobic forces in the hydrophobic parts of dye molecules lead to different degrees of dye aggregation.38 It has been pointed out that the hydration layer around the benzene ring consists of 24 water molecules.24The interactions between the dyes and the solvents were also studied by taking the most significant combination (R-218 in 5% DEA solution) as an example. Fig. 7 shows the possible schematic of the different aggregation states. Before the addition of DEA, there were monomers, dimers and higher-ordered aggregates present in the solution. Dye molecules stack via π–π interactions with a better planarity from the benzene ring and naphthalene ring, thus resulting in dye molecules to form dimers or higher-ordered aggregates. H-type aggregates exist in the solution due to face-to-face stacking. The water molecules surround the dye molecules with different aggregation states by hydrogen bonding. However, after the addition of DEA, the hydrophobic parts of dye molecules and the DEA molecules attracted by each other. First, the “iceberg structure” water around R-218 aggregates got destroyed; then, the water molecules that originally surrounded the dye aggregates were released; further, the naphthalene ring part of R-218 molecules was packaged by the hydrophobic part of the DEA molecules and the hydrophilic part of DEA molecules was exposed to the water, which resulted in the naphthalene ring hydrophilic. As a result, the hydrophilic group of DEA molecules surround the dye molecules, which could interact with the water molecule through hydrogen bonds resulting in the formation of a hydration layer. As a consequence, the disaggregation was achieved. Other dye/solvent combinations went through a similar process but to different degrees. The disaggregation effects of different solvents were explained from aspect of the physical properties of the solvents. As listed in Table 2, DEA and TEA have higher dispersion forces compared to water. This meant that the hydrophobic interactions between DEA/TEA and the naphthalene ring of dyes were much higher than that of water.
| Solvent | Dispersion force | Molar volume | Hydrogen bonding | Relative molecular weight |
|---|---|---|---|---|
| DEA | 17.2 | 95.5 | 21.2 | 105.1 |
| TEA | 17.3 | 133.2 | 23.3 | 149.2 |
| H2O | 15.5 | 42.3 | 18.0 |
That was the key factor to destroy the “iceberg structure” of aggregates. Then, the steric hindrance effect of DEA was lower compared to TEA since the molecular volume of DEA present was small to interact with the dye, although the dispersion forces of two solvents are roughly equal. Moreover, the relative molecular weight of DEA is smaller as compared with TEA, so there were more dissociated DEA molecules in the solution to interact with the dye molecules and to reduce aggregation.
3.5 Dynamic surface tension
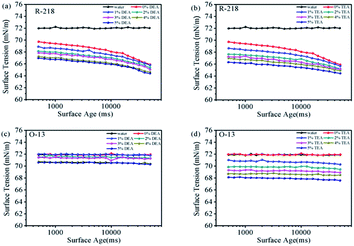
Surface tension of dye solutions plays an important role in the dyeing process.28,39,40 Reducing the surface tension is beneficial to promote the wetting of the fabric surface and the diffusion of dye molecules into the fibers. Fig. 8 shows the surface tension of R-218 and O-13 in different solutions. The surface tension of pure water was also plotted for comparison. The curves of R-218 solutions were significantly lower compared to that of water (Fig. 8a and b), while those of O-13 almost overlapped with water. This distinction was caused by the different distribution of hydrophilic groups of R-218 and O-13. The hydrophilic groups are located on one side of R-218 molecules; therefore, R-218 molecules could adsorb to the gas–liquid interface of the solution like surfactant to reduce the surface tension. However, the hydrophilic groups of O-13 are located on both sides, so O-13 molecules had little effects on the surface tension of the solution. Despite being obvious or not, the surface tension of all the solutions decreased gradually with the increase in the concentration of DEA or TEA. That was mainly because the number of dye monomers increased with the increasing amount of the solvent. Moreover, the interactions between DEA/TEA molecules and water also decreased the surface tension.3.6 Rheological
Fig. 9 shows that the viscosity-shear rate curves of all the solutions. Viscosity of all the tested solutions did not change with the shear rate, which belonged to Newtonian fluid.41,42 The viscosity of dye solutions depends mainly on the intermolecular forces. All the viscosities increased with the increase in the concentration of solvents. This could be attributed to the decreasing distance and increasing intermolecular interactions between DEA/TEA and water with the increase in the number of DEA/TEA molecules. Fig. 9e shows the comparison of R-218 and O-13 in the same solvent concentration. Apparently, the viscosity of R-218 solutions was larger than that of O-13 because the molecular volume of R-218 was larger than that of O-13. Moreover, the viscosity of solutions with TEA was significantly higher compared with DEA. That was because the addition of DEA leads to a larger number of dye molecules compared to TEA, and the interactions between the extra molecules resulted in the larger viscosity.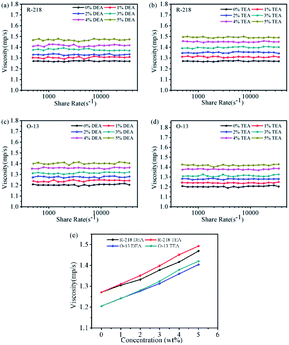 | ||
| Fig. 9 The viscosity-shear rate curves of R-218 (a and b) and O-13 (c and d) in different solutions, (e) plotted viscosity of the dyes versus the concentration of the solvents. | ||
4. Conclusions
The effects of the alkanolamine solvent to the aggregation states of reactive dyes in the concentrated solution were investigated. The combinations of DEA/TEA and R-218/O-13 were used for examples. It was the addition of solvents that inspired the disaggregation of the dyes. The change in degree of the aggregation states was quantified. It was found that the highest disaggregation occurred due to the R-218/DEA combination. The disaggregation mechanism included the hydrophobic interactions between the hydrophobic parts of the dye, and the solvent destroyed the “iceberg structure” of the aggregates. Then, the different degrees of disaggregation effects were explained from the aspects of the molecular structure of the dye and the physical properties of the solvent. In addition, for the two dyes, the surface tension and viscosity of the solutions were measured. With the increase in the concentration of the solvent in the solutions, the surface tension decreased while the viscosity increased accordingly, which was instructive for future dye applications.Conflicts of interest
The authors declare no competing financial interest.Acknowledgements
This work is supported by the National Key R&D Program of China, grant No. 2017YFB0309800; and State Key Laboratory of Bio-Fibers and Eco-Textiles (Qingdao University), ZFZ201801.References
- F. Jones and D. R. Kent, Dyes Pigm., 1980, 1, 39–48 CrossRef CAS.
- A. Navarro and F. Sanz, Dyes Pigm., 1999, 40, 131–139 CrossRef CAS.
- K. Murakami, Dyes Pigm., 2002, 53, 31–43 CrossRef CAS.
- H. von Berlepsch and C. Bottcher, Langmuir, 2013, 29, 4948–4958 CrossRef PubMed.
- X. Dong, Z. J. Gu, C. Y. Hang, G. Q. Ke, L. W. Jiang and J. X. He, J. Cleaner Prod., 2019, 226, 316–323 CrossRef CAS.
- X. Li, G. Huang, W. Chen, H. Jiang, S. Qiao and R. Yang, ACS Appl. Mater. Interfaces, 2020, 12, 16670–16678 CrossRef CAS PubMed.
- H. Wang, H. Kong, J. Zheng, H. Peng, C. Cao, Y. Qi, K. Fang and W. Chen, Molecules, 2020, 25, 1588 CrossRef CAS PubMed.
- L. Zhang, K. Fang and H. Zhou, Molecules, 2020, 25, 2507 CrossRef CAS PubMed.
- K. Hamada, H. Nonogaki, Y. Fukushima, B. Munkhbat and M. Mitsuishi, Dyes Pigm., 1991, 16, 111–118 CrossRef CAS.
- O. I. Mostafa, A. Y. Abd El-Aal, A. A. El Bayaa, H. B. Sallam and A. A. Mahmoud, J. Chin. Chem. Soc., 1995, 42, 507–513 CrossRef CAS.
- H. S. Frank and M. W. Evans, J. Chem. Phys., 1945, 13, 507–532 CrossRef CAS.
- S. M. Burkinshaw and G. Salihu, Dyes Pigm., 2019, 161, 519–530 CrossRef CAS.
- H. Wang, H. Kong, J. Zheng, H. Peng, C. G. Cao, Y. Qi, K. J. Fang and W. C. Chen, Molecules, 2020, 25, 9 Search PubMed.
- X. Y. Zhang, K. J. Fang, H. Zhou, K. Zhang and M. N. Bukhari, J. Mol. Liq., 2020, 312, 113481 CrossRef CAS.
- L. Zhang, N. Li, F. L. Zhao and K. Li, Anal. Sci., 2004, 20, 445–450 CrossRef CAS PubMed.
- K. K. Karukstis, L. A. Perelman and W. K. Wong, Langmuir, 2002, 18, 10363–10371 CrossRef CAS.
- J. Y. Park, Y. Hirata and K. Hamada, Color. Technol., 2012, 128, 184–191 CAS.
- Z. Y. Tang, K. J. Fang, Y. W. Song and F. Y. Sun, Polymers, 2019, 11, 739 CrossRef CAS PubMed.
- C. Ouyang, S. Chen, B. Che and G. Xue, Colloids Surf., A, 2007, 301, 346–351 CrossRef CAS.
- K. Ni, H. Fang, Z. Yu and Z. Fan, J. Mol. Liq., 2019, 278, 234–238 CrossRef CAS.
- H. Qin, K. Fang, Y. Ren, K. Zhang, L. Zhang and X. Zhang, ACS Sustainable Chem. Eng., 2020, 8, 17291–17298 CrossRef CAS.
- R. Y. Xie, K. J. Fang, Y. Liu, W. C. Chen, J. N. Fan, X. W. Wang, Y. F. Ren and Y. W. Song, J. Mater. Sci., 2020, 55, 11919–11937 CrossRef CAS.
- H. Peng, R. Xie, K. Fang, C. Cao, Y. Qi, Y. Ren and W. Chen, Langmuir, 2021, 37, 1493–1500 CrossRef CAS PubMed.
- G. Ravishanker, P. K. Mehrotra, M. Mezei and D. L. Beveridge, J. Am. Chem. Soc., 1984, 106, 4102–4108 CrossRef CAS.
- A. H. Herz, Photogr. Sci. Eng., 1974, 18, 323–335 CAS.
- B. Neumann, J. Phys. Chem. B, 2001, 105, 8268–8274 CrossRef CAS.
- M. G. Bielska, A. Sobczyńska and K. Prochaska, Dyes Pigm., 2009, 80, 201–205 CrossRef CAS.
- L. C. Abbott, S. N. Batchelor, J. Oakes, J. R. L. Smith and J. N. Moore, J. Phys. Chem. B, 2004, 108, 13726–13735 CrossRef CAS.
- B. Boruah, P. M. Saikia and R. K. Dutta, Dyes Pigm., 2010, 85, 16–20 CrossRef CAS.
- F. C. Spano, Acc. Chem. Res., 2010, 43, 429–439 CrossRef CAS PubMed.
- P. Verma and H. Pal, J. Phys. Chem. A, 2012, 116, 4473–4484 CrossRef CAS PubMed.
- A. Eisfeld and J. S. Briggs, Chem. Phys., 2006, 324, 376–384 CrossRef CAS.
- E. Rabinowitch and L. F. Epstein, J. Am. Chem. Soc., 2012, 63, 69–78 CrossRef.
- Z. Tang, K. Fang, M. N. Bukhari, Y. Song and K. Zhang, Langmuir, 2020, 36, 9481–9488 CrossRef CAS PubMed.
- J. L. Bricks, Y. L. Slominskii, I. D. Panas and A. P. Demchenko, Methods Appl. Fluoresc., 2018, 6, 1088 Search PubMed.
- T. E. Kaiser, H. Wang, V. Stepanenko and F. Wurthner, Angew. Chem., Int. Ed., 2007, 46, 5541–5544 CrossRef CAS PubMed.
- Y. Qi, R. Xie, A. Yu, M. N. Bukhari, L. Zhang, C. Cao, H. Peng, K. Fang and W. Chen, RSC Adv., 2020, 10, 34373–34380 RSC.
- Y. Qi, R. Xie, A. Yu, M. N. Bukhari, L. Zhang, C. Cao, H. Peng, K. Fang and W. Chen, RSC Adv., 2020, 10, 34373–34380 RSC.
- J. D. Halverson, C. Maldarelli, A. Couzis and J. Koplik, J. Chem. Phys., 2008, 129, 827 CrossRef PubMed.
- S. Khan and J. K. Singh, Mol. Simul., 2014, 40, 458–468 CrossRef CAS.
- J. Yang, H. Zhou, L. Wang, Y. Zhang, C. Chen, H. Hu, G. Li, Y. Zhang, Y. Ma and J. Zhang, ChemCatChem, 2017, 9, 1355 CrossRef.
- R. Q. Wang, K. J. Fang, Y. F. Ren, Y. W. Song, K. Zhang and M. N. Bukhari, J. Mol. Liq., 2019, 294, 111668 CrossRef CAS.
Footnote |
| † These authors contributed equally to this work. |
| This journal is © The Royal Society of Chemistry 2021 |

