 Open Access Article
Facile mass preparation and characterization of Al/copper ferrites metastable intermolecular energetic nanocomposites†
Chao Sangab,
Keke Chenab,
Guoping Li*ab,
Shaohua Jin ab and
Yunjun Luo
 *ab
*ab
aSchool of Materials Science and Engineering Technology, Beijing Institute of Technology, Beijing 100081, China. E-mail: girlping3114@bit.edu.cn; yjluo@bit.edu.cn
bKey Laboratory for Ministry of Education of High Energy Density Materials, Beijing 100081, China
First published on 17th February 2021
Abstract
In the present work, a novel Al/copper ferrites metastable intermolecular energetic nanocomposite was prepared by a simple and mild sol–gel method followed by low temperature calcination, and characterized by various analytical techniques. The X-ray diffraction (XRD) analysis suggests that the products contain crystal forms of aluminum and spinel-type ferrite crystal forms which are CuFe2O4 with many crystal defects. The scanning electron microscopy (SEM) and nitrogen adsorption–desorption analyses reveal that the prepared Al/copper ferrites are mesoporous structures with large specific surface areas of up to 184.47 m2 g−1 and further reveal the pore construction of this material. Its crystal defects and large specific surface area provide the possibility for its excellent catalytic performance. Al/copper ferrites have 45% better exothermic properties with higher energy output efficiency, faster burning rate, and higher reactivity than traditional Al/Fe2O3 prepared by the same method. Due to the synergistic catalytic effect of Cu–Fe oxides, Al/copper ferrites have a better catalytic effect on AP thermal decomposition and can reduce the HTD peak temperature of AP 33% more than Al/Fe2O3. The catalytic mechanism of Al/copper ferrites for the thermal decomposition of AP is obtained based on the electron transfer theories, synergistic catalytic mechanism, and the porous structure of Al/copper ferrites. Due to the mild reaction conditions and low calcination temperature, dozens of grams of product can be safely obtained at one time with low cost and easily available raw materials to meet the requirements of propellant up to several kilograms or other industrial applications.
1. Introduction
Metastable intermolecular composites (MICs), also termed metastable intermixed composites, super thermites, nano-thermites, nanocomposite energetic materials, etc., are a class of energetic materials that are composed of nano-sized metal fuel (mostly Al, Mg, etc.) and oxidizer particles (CuO, Fe2O3, etc.)1–3 Compared with the traditional thermites, MICs have a larger nanoparticle contact area, thus shortening the diffusion distance between fuel and oxidizer. Therefore, the reaction kinetics of MICs are basically controlled by the chemical reaction rate rather than the mass transfer rate, resulting in shorter ignition time, higher burning speed, and faster reaction speed.4–6 MICs are widely used in both civilian and military fields, such as propellants, pyrotechnics, aerospace devices, airbag ignition materials, pressure-mediated molecule delivery, and biomedicine-related applications.7–9 Especially in the field of solid propellants, MICs have become a high-profile functional additive for solid propellants because of its own energy-containing and catalytic combustion function, and the alumina produced by thermite reaction has the effect of inhibiting unstable combustion.The catalytic performance of MICs on solid propellant combustion is achieved by the transition metal oxides such as CuO, Fe2O3, and Bi2O3 in the components of MICs described above which have a certain catalytic effect on the thermal decomposition of various common components of solid propellants.10–13 Especially for ammonium perchlorate (AP), which is the most commonly used oxidizer in a variety of solid rocket propellants so far, common transition metal oxides such as CuO and Fe2O3 can greatly reduce its thermal decomposition activation energy and thermal decomposition temperature.14–16 Furthermore, two or more transition metal oxides together can achieve better catalytic performance than the individual catalysts. The excellent catalytic activities of composite catalysts are mainly attributed to the synergistic effect.17 For example, Singh found that the binary transition metal ferrites could effectively catalyze the thermal decomposition of AP as a catalyst due to the synergistic effect of the two metals.18 Wang et al. found that the catalytic effect of the same content of the catalyst on AP from strong to weak is CuO/Fe2O3, CuO, Fe2O3.10 A few studies on the copper ferrites catalyzed AP thermal decomposition have been reported, which are mainly focused on the respective catalytic mechanisms of CuO and Fe2O3 for the thermal decomposition of AP. So far, the synergistic catalytic mechanism of Cu–Fe–O remains unclear. Copper ferrites belong to a subgroup of spinel-type ferrites, which are usually prepared by auto-combustion method, coprecipitation method, solid state reactions, etc.18,19 These methods usually require either strong acids or high heating temperatures, which makes loading nano aluminum (n-Al) on copper ferrites during the preparation process difficult due to the high activity of n-Al. That is why no Al/copper ferrites metastable intermolecular nanocomposite is reported.
Many ways were used to prepare MICs.20 The sol–gel method is one of the widely used methods for preparing metal oxides, which are assembled in a three-dimensional porous structure in the form of very small-sized particles. There have been studies on the preparation of MICs by the sol–gel method. However, the oxidant component of MICs obtained in these studies is iron oxyhydroxide (FeOOH) instead of iron trioxide (Fe2O3).21 In order to dehydrate, purify and crystallize the metal oxide prepared by the sol–gel method, so as to make it function as a highly efficient catalyst, calcination is required. However, high-temperature calcination can cause an oxidation reaction of n-Al, which makes it impossible to prepare the required MICs and is very dangerous.
In the present work, we successfully prepared Al/copper ferrites metastable intermolecular energetic nanocomposites by a facile sol–gel reaction under mild conditions, followed by low temperature calcination. On the basis of our previous research (see Fig. S1 and in ESI†), we prepared Al/copper ferrites with the Cu/Fe molar ratio which performed the best catalytic performance and improved the preparation process so that the production can be scaled up to 20 g. After characterization, it is found that the performance of Al/copper ferrites is equal to or better than that of Al/Fe2O3 prepared by the same method. Especially for the catalysis of AP thermal decomposition, Al/copper ferrites have huge advantages. Due to the mild reaction conditions and low calcination temperature, it can be prepared in large quantities and is suitable for large-scale applications.
2. Experiment
2.1 Chemicals
Analytical grade, iron nitrate nonahydrate (Fe(NO3)3·9H2O), copper nitrate trihydrate (Cu(NO3)2·3H2O), absolute ethanol, 1,2-propylene oxide, n-hexane, N,N-dimethylformamide, ethyl acetate were purchased from Beijing Tong Guang Fine Chemicals Company and used as received without further purification. Ammonium perchlorate (AP, 5–10 μm) was purchased from Dalian Potassium Chlorate Factory. The Al fuel with average diameters of 90 nm was homemade according to the method of Ying Liu.222.2 Preparation of Al/copper ferrites MICs
Al/copper ferrites MICs were prepared by the method in ref. 3. 0.06 mol Fe(NO3)3·9H2O and Cu(NO3)2·3H2O were dissolved in ethanol (120 mL). Ensure that the scale of n(Cu) and n(Fe) was 1![[thin space (1/6-em)]](https://www.rsc.org/images/entities/char_2009.gif) :
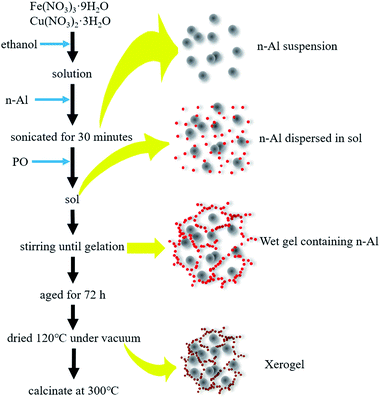
:![[thin space (1/6-em)]](https://www.rsc.org/images/entities/char_2009.gif) 4, which was proved to have the best catalytic performance in our previous research (see Fig. S1 and in ESI†). The solution was stirred in a 200 mL beaker at room temperature for 10 min. The fuel of aluminum (n-Al) was added and then the system was sonicated for 30 minutes. As a gelation agent, 12 mL of 1,2-propylene oxide was added to the solution dropwise. As the stirring progress, gelation occurred with a rapid heat release. After aged for 72 h, the product was dried to evaporating the ethanol at 120 °C in a vacuum oven, and then calcinate at 300 °C. The whole preparation process is shown in Fig. 1. Considering that Al is abundant in propellant as a high-energy fuel component we increased the molar ratio of Al in the MICs. The products were labeled as CF, CFA1, CFA3, CFA5 and CFA7 which corresponded to n(Al)/(n(Fe) + n(Cu)) as 0 (infinity, free of Al), 1/1, 3/1, 5/1 and 7/1. As a comparison, Al/Fe2O3 MICs were prepared by the same method. The same amount of Cu(NO3)2·3H2O was replaced by Fe(NO3)3·9H2O. The products were labeled as FA3 which corresponded to n(Al)/n(Fe) as 3/1. The basic information of the products is shown in Table 1. Due to the low calcination temperature and low heating rate (10 K min−1), all samples are calcined simultaneously in the same tube furnace. See Fig. S3 and S4 in ESI† for the XRD and TG data of the samples before and after calcination.
4, which was proved to have the best catalytic performance in our previous research (see Fig. S1 and in ESI†). The solution was stirred in a 200 mL beaker at room temperature for 10 min. The fuel of aluminum (n-Al) was added and then the system was sonicated for 30 minutes. As a gelation agent, 12 mL of 1,2-propylene oxide was added to the solution dropwise. As the stirring progress, gelation occurred with a rapid heat release. After aged for 72 h, the product was dried to evaporating the ethanol at 120 °C in a vacuum oven, and then calcinate at 300 °C. The whole preparation process is shown in Fig. 1. Considering that Al is abundant in propellant as a high-energy fuel component we increased the molar ratio of Al in the MICs. The products were labeled as CF, CFA1, CFA3, CFA5 and CFA7 which corresponded to n(Al)/(n(Fe) + n(Cu)) as 0 (infinity, free of Al), 1/1, 3/1, 5/1 and 7/1. As a comparison, Al/Fe2O3 MICs were prepared by the same method. The same amount of Cu(NO3)2·3H2O was replaced by Fe(NO3)3·9H2O. The products were labeled as FA3 which corresponded to n(Al)/n(Fe) as 3/1. The basic information of the products is shown in Table 1. Due to the low calcination temperature and low heating rate (10 K min−1), all samples are calcined simultaneously in the same tube furnace. See Fig. S3 and S4 in ESI† for the XRD and TG data of the samples before and after calcination.
| Samples | Components (mol) | Φ (estimated value) | SBET (m2 g−1) | Heat (J g−1) | Samples mixed with AP | ΔT (°C) | ||
|---|---|---|---|---|---|---|---|---|
| Fe(NO3)3·9H2O | Cu(NO3)2·3H2O | n-Al | ||||||
| a Components refers to the consumption of raw materials. Φ is the equivalence ratio (Φ = (fuel/oxidizer)actual/(fuel/oxidizer)stoichiometry, estimated value, because of the copper ferrite is a mixture whose main component is CuFe2O4). SBET is the specific surface area calculated by the BET method. Heat is the total heat release during thermite reaction. ΔT is the temperature difference between the THmax (the temperature of the high-temperature decomposition maximum decomposition rate of AP) of the sample and that of pure AP. | ||||||||
| CF | 0.048 | 0.012 | 0 | 0 | 80.43 | — | AP/CF | 90.9 |
| CFA1 | 0.048 | 0.012 | 0.060 | 0.75 | 184.47 | 747.9 | AP/CFA1 | 81.6 |
| CFA3 | 0.048 | 0.012 | 0.180 | 2.25 | 170.55 | 1563.3 | AP/CFA3 | 78.6 |
| CFA5 | 0.048 | 0.012 | 0.300 | 3.75 | 149.06 | 1284.2 | AP/CFA5 | 70.6 |
| CFA7 | 0.048 | 0.012 | 0.420 | 5.25 | 117.22 | 959.7 | AP/CFA7 | 67.7 |
| FA3 | 0.060 | 0 | 0.180 | 2.10 | 178.21 | 1081.5 | AP/FA3 | 57.7 |
2.3 Preparation of AP/Al/copper ferrites MICs
The Al/copper ferrites MICs and Al/Fe2O3 MICs obtained above were ground into 200 mesh powder with an agate mortar. AP (0.5 g) and Al/copper ferrites (0.025 g) or Al/Fe2O3 (0.025 g) was then added into 5 mL n-hexane in a test tube, sonicated for 15 minutes, and centrifuged. The precipitate was collected and dried by evaporation under reduced pressure at 60 °C. The products prepared with CF, CFA1, CFA3, CFA5, CFA7 and FA3 were respectively denoted as AP/CF, AP/CFA1, AP/CFA3, AP/CFA5, AP/CFA7 and AP/FA3.2.4 Measurements and characterizations
The morphology of the Al/copper ferrites MICs and Al/Fe2O3 MICs were observed by the S4800 cold field scanning electron microscope (SEM) (Japan's Hitachi Corporation) at an accelerating voltage of 15.0 kV. The surface area and pore structure of the samples were measured by the ASAP 2020 volumetric analyzer (Micromeritics Instrument Corporation). All samples were degassed at 120 °C for at least 6 h prior to the measurements. X-ray diffraction (XRD) measurements were carried out by an X'Pert Pro MPD (PANalytical, Netherlands) diffractometer with monochromatic Cu Ka radiation (λ = 1.5406 Å) at 40 kV and 40 mA, the scanning speed was 0.01 s−1 and the step size was 0.01 from 10° to 90° (2θ). The thermal performance of the samples was monitored by thermogravimetric-differential scanning calorimetry (TG-DSC) using a METTLER TOLEDO TGA/DSC 1-Thermogravimetric Analyzer. No more than 1 mg of the Al/copper ferrites MICs or Al/Fe2O3 MICs samples placed in alumina ceramic crucible were respectively heated from 30 °C to 900 °C at the heating rate of 10 °C min−1 under an ultrapure argon atmosphere (Ar, 40 mL min−1). The AP/Al/copper ferrites and AP/Al/Fe2O3 samples placed in uncovered alumina ceramic crucible were respectively heated from 30 °C to 500 °C at the heating rate of 10 °C min−1 under an ultrapure nitrogen atmosphere. Pressure cell combustion tests were implemented by the self-made equipment of the research group. The equipment includes the following parts: stainless steel pressure cell (custom built, 13 mL free volume), oscilloscope (MDO3000, Tektronix, USA), piezoelectric pressure sensor (CY-YD-205, Sinocera Piezotronics, Inc.), signal conditioner (YE5850, Sinocera Piezotronics Inc.), DC power supply (24 V), fast-heating wire (Φ = 0.2–0.3 mm, Cr20Ni80). The relationship between the pressure signal and the voltage is 1 V = 1 MPa and the fixed dose of each test is 25 mg. Sequential snapshots of MICs burning on a fast-heating wire in the atmosphere were obtained by a high-speed camera (20![[thin space (1/6-em)]](https://www.rsc.org/images/entities/char_2009.gif) 000 frames per second, i-SPEED 726, IX Cameras Inc.).
000 frames per second, i-SPEED 726, IX Cameras Inc.).
3. Results and discussion
3.1 Crystal forms
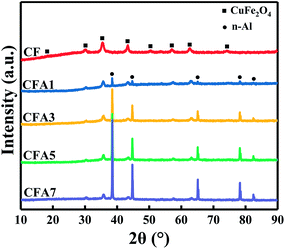
Phase investigation of the crystallized products was performed by XRD and the powder diffraction patterns were presented in Fig. 2. The diffraction pattern of CF is consistent with the standard PDF card no. 25-0283, which has main diffraction peaks at 30.17°, 35.64°, 43.04°, 57.05°, 62.77°, 74.54°, and means that CF has the crystal form of CuFe2O4.23 This indicated that under low-temperature calcination at 300 °C, the crystal form of copper ferrite can be successfully obtained. It has been reported that copper ferrite crystals are formed by the replacement of some iron atoms in iron oxide crystals with copper atoms. Therefore, copper ferrites are considered as one of a subgroup of spinel-type ferrites. The spinel-type ferrites usually display cubic symmetry, but some show tetragonal distortions where one of the lattice edges differs in length relative to the other two.19 Therefore, there are more crystal defects in copper ferrite crystals than in pure iron oxide crystals. Crystal defects are beneficial to their catalytic function.24 Since the feed ratio of the raw materials is 1/4 (n(Cu)/n(Fe)), the product is a mixture whose main component is CuFe2O4.It can also be found from Fig. 2 that CFA1–CFA7 have the same set of n-Al diffraction peaks at 38.47°, 44.74°, 66.13°, 78.23°, 82.44° (standard PDF card no. 04-0787). This indicates that Al did not participate in the crystallization with copper ferrites, and there was no eutectic between Al and copper ferrites. The exist of Al in the products and demonstrate the structure of Al nanocrystalline particles has not been destroyed after sol–gel and calcination process (see Fig. S3 in ESI† for the XRD data of before and after calcination). As the content of n-Al increases, the diffraction peak intensity of Al gradually increases. And the relative content of copper ferrites reduces as the content of n-Al increases, so their diffraction peaks gradually weakened but the 2θ angles of copper ferrites diffraction peaks have not changed which indicated that the existing of n-Al has not changed the crystal form of the copper ferrites. This proves that the Al/copper ferrites MICs were successfully prepared.
3.2 Morphological characterization
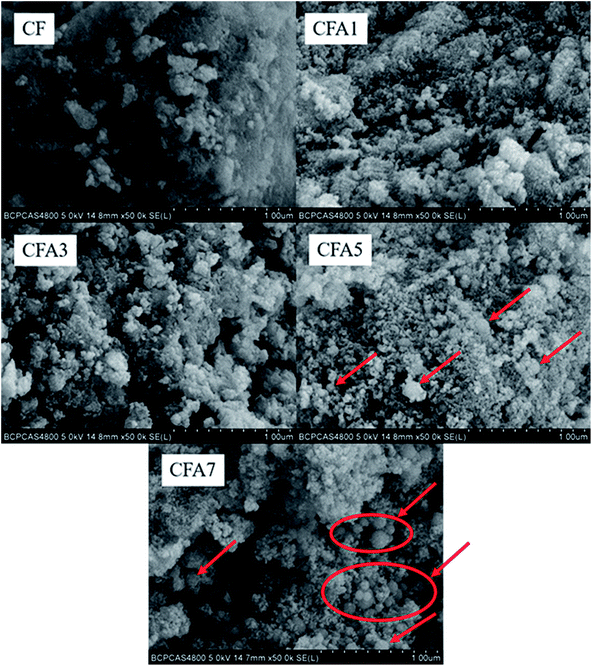
The surface morphology of the Al/copper ferrites MICs was observed by SEM as shown in Fig. 3. Pure copper ferrites exist in the form of agglomerates with a relatively smooth surface. The particles with a size of less than 10 nm which make up the agglomerates are smaller than n-Al particles and formed the copper ferrites gel skeleton. The sample surface became rougher with the Al content increased. It can be found from Fig. 3 that when n(Al)/(n(Fe) + n(Cu)) is 1 and 3 (CF1, CF3), almost no n-Al particles are observed in the field of view. It indicates that n-Al particles participated in the formation of the gel skeleton and do not exist outside of the gel skeleton. When n(Al)/(n(Fe) + n(Cu)) or n(Al)/n(Fe) increases to 5 and 7 (CF5, CF7), n-Al particles are clearly observed on the surface of the gel skeleton. The surface of these n-Al particles is not as smooth as that of pure n-Al particles (see Fig. S5 and S6 in ESI† for the SEM image of pure n-Al and partially enlarged comparison image of Al/copper ferrites and n-Al), but coated with smaller nanoparticles (copper ferrites, see Fig. S7† for the SEM image of copper ferrites particles). It will help the mass transfer of the thermite reaction and promote the progress of the thermite reaction. And such a composite form exposes the oxide to the outermost layer, which is beneficial to increase the number of catalytically active sites when used as a catalyst for other reactions.3.3 Specific surface area and pore volume
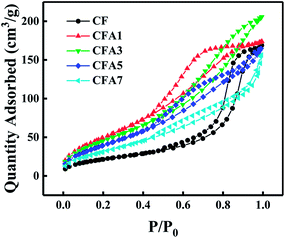
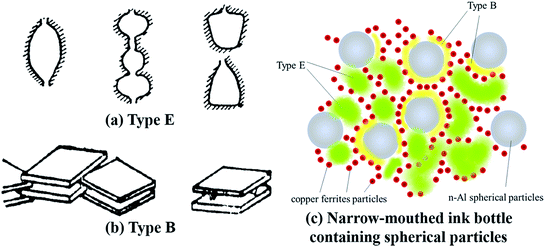
As shown in Fig. 4, the nitrogen adsorption–desorption isotherms of Al/copper ferrites MICs belong to type IV, which indicated the existence of abundant mesopores in the samples. It can be found from Fig. 4 that the adsorption loops of CF and CFA1 belong to type E, whose pore structure is similar with narrow-mouthed ink bottle shape with a large hole radius and a small opening, as shown in Fig. 5(a).25 Each of the adsorption loops of CFA3, CFA5, and CFA7 is composed of both type B and type E adsorption loops. Type B adsorption loop corresponds to pores with slit-like openings which are similar with parallel plate walls (Fig. 5(b)). Part of the spherical n-Al particles entered the “ink bottle” and formed “parallel plate walls” with the inner wall of the ink bottle. However, there are no n-Al particles in some ink bottles, or the space in the “ink bottle” is not completely occupied by these spherical particles. Therefore, these adsorption loops simultaneously show the characteristics of the B and E types (Fig. 5(c)).Measured specific surface area (SBET) of samples are presented in Table 2. With the addition of n-Al, the specific surface area of the MICs rises sharply (from 80.43 m2 g−1 of CF to 184.47 m2 g−1 of CFA1). As the result discussed in Section 3.2, the presence of n-Al participated in the construction of the gel skeleton, and thus increased the porosity of the MICs. As the content of n-Al continues to increase, the specific surface area of CFA3 is 170.55 m2 g−1, which is slightly lower than that of CFA1. The reason is that, as described above, when the n-Al content increases, more n-Al particles enter in the pores formed by the gel skeleton. The specific surface area of CFA5, CFA7 decreased obviously to 149.06 m2 g−1 and 117.22 m2 g−1 respectively. The reason is that when the n-Al content continues to increases, part of the n-Al particles exist outside the gel skeleton which can be observed clearly by SEM images in Fig. 3. The n-Al particles with a relatively smooth surface spherical structure and a relatively smaller specific surface area have a smaller contribution to the surface area and a greater contribution to the denominator (mass) of the entire composite material. That is to say, some spherical n-Al particles entered in the “ink bottle”, causing the surface area of the samples to increase and the pore volume to decrease. Some spherical n-Al particles formed the wall of the ink bottle (the gel skeleton) and made the hole of the ink bottle bigger, causing the surface area of the samples and the pore volume to increase. As the content increased, more and more spherical n-Al particles existed outside of the ink bottle, causing the surface area of the samples to slightly increase but the specific surface area to decrease. The above factors lead to the specific surface area changes by the content of n-Al but the total pore volume (Vtot) and the average pore diameter (Dave) have no obvious regular changes.
| Samples | SBET (m2 g−1) | Vtot (cm3 g−1) | Dave (nm) |
|---|---|---|---|
| a SBET is the specific surface area calculated by the BET method, Vtot is the total pore volume, and Dave is the average pore diameter. | |||
| CF | 80.43 | 0.26 | 11.77 |
| CFA1 | 184.47 | 0.27 | 4.77 |
| CFA3 | 170.55 | 0.31 | 6.39 |
| CFA5 | 149.06 | 0.25 | 5.71 |
| CFA7 | 117.22 | 0.24 | 7.05 |
| FA3 | 178.21 | 0.32 | 6.26 |
These MICs have good physical stability while maintaining high reactivity.20 When used as a catalyst, the material with a large specific surface area can provide more catalytic active sites to improve its catalytic performance. The pore volume and specific surface areas of CFA3 are roughly equivalent to those of FA3.
3.4 Thermal analysis and combustion performance
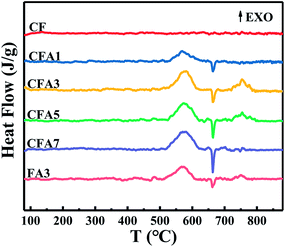
Differential scanning calorimetry (DSC) can be used to test the thermal effect of materials with temperature changes. Although the classic DSC technique is not suitable for characterizing the true thermite reaction triggered by rapid heating,26 it can be used to compare the amount of heat released by similar materials through similar reactions. It is also used to measure the change of the melting temperature of metal nanoparticles and to study the mechanism of the slow reaction of MICs.Fig. 6 is the DSC curves of Al/copper ferrites MICs. The comparison of the DSC curves of CFA3 and FA3 is also shown in Fig. 6. No endothermic peak or exothermic peak appears in sample “CF”. While in the sample “CFA1”, there is an unobvious endothermic peak at about 663.5 °C and a less clear broad exothermic peak appears at 520–620 °C. In sample “CFA3”, “CFA5” and “CFA7”, the endothermic peaks at about 663.5 °C, and the exothermic peaks at 520–600 °C are obvious. CFA3 and CFA5 have obvious exothermic peaks of solid–liquid thermite reaction at 720–790 °C.
Pure copper ferrites have no chemical reaction and other thermal effects during the heating process, so its DSC curve does not have endothermic or exothermic peak. The exothermic peaks of “CFA1”, “CFA3”, “CFA5” and “CFA7” at 520–600 °C are caused by the solid–solid thermite reaction while the endothermic peaks at about 663.5 °C are due to the melting of aluminum.27 The thermite reaction occurred before the melting of aluminum, which indicates that the aluminum of MICs prepared by the sol–gel method has good surface contact with the oxidant (copper ferrites).28
The solid aluminum and the oxidant (copper ferrites) are in good contact with each other so the solid–solid thermite reaction occurs. After the solid–solid reaction is completed, as the temperature increases, the remaining Al melts and continues to contact with the remaining oxidant, and then the solid–liquid thermite reaction proceeds. Compare with the solid–solid thermite reaction, the solid–liquid thermite reaction rate is slower. This is because the solid–liquid thermite reaction can only occur when the liquid aluminum flows near the copper ferrites. There is no solid–liquid exothermic peak in CFA1 because the aluminum has reacted completely before melting, while CFA7 does not find a solid–liquid reaction exothermic peak because copper ferrites have been consumed in the solid–solid reaction. The entire process of the thermite reaction is shown in Fig. S8 (ESI†).
Thermite reaction parameters of Al/copper ferrites MICs are listed in Table 3. With the increase of aluminum content, the starting temperature of solid–solid thermite reaction (T0) shows a general trend of decreasing. According to the analysis in Section 3.2, as the number of aluminum particles increases, the solid–solid interface between the oxidizer and the combustion agent increases, and the solid–solid reaction becomes easier, so the activation temperature is slightly reduced. The exothermic peak temperature of solid–solid thermite reaction (TP1) and solid–liquid thermite reaction (TP2) of the samples basically at the same temperature. CFA3 has the most total heat release (Heat), in particular that is more than FA3. It indicates that Al/copper ferrites MICs have better exothermic properties than Al/Fe2O3 MICs. The reason is that the thermite reaction of CuO and Al exotherms more than that of Fe2O3 and Al.29
| Samples | T0 (°C) | TP1 (°C) | TP2 (°C) | Heat (J g−1) |
|---|---|---|---|---|
| CF | — | — | — | — |
| CFA1 | 533.3 | 569.4 | — | 747.9 |
| CFA3 | 528.0 | 576.7 | 753.6 | 1563.3 |
| CFA5 | 524.0 | 572.5 | 753.6 | 1284.2 |
| CFA7 | 518.7 | 569.4 | 753.2 | 959.7 |
| FA3 | 511.6 | 570.5 | 750.5 | 1081.5 |
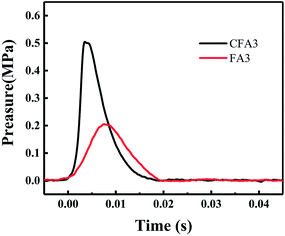
The burning of energetic materials in a constant-volume container will generate high-temperature and high-pressure gas and shock waves, which will cause the pressure inside the container to increase. The energy output performance, combustion performance, and reactivity of MICs can be obtained by analyzing the pressure-time curve (P–t curve) of its constant volume combustion. Constant volume combustion can be realized by the pressure cell combustion tests. After ignition, the pressure in the pressure cell first rises and then drops to the initial value. In this progress, the maximum pressure (Pmax) represents the energy output efficiency of MICs in the combustion process, and the time required to reach the maximum pressure (rise time) indirectly indicates the combustion rate (reaction activity) of the MICs.30
Fig. 7 compares the P–t curves of CFA3 and FA3 obtained by the same preparation method under the same test conditions. After ignition, the pressure rises rapidly from zero and reaches the maximum value within 10 ms. The increase of pressure is attributed to the following factors: (1) the heat released during combustion increased the temperature of the air in the pressure cell and thus increased the pressure; (2) during the combustion process, the high temperature and high pressure reaction center formed a shock wave; (3) the high-temperature environment vaporized part of Al, Fe, Cu and decomposed CuFe2O4 to form O2 and then the newly generated gas increased the pressure.
After 3.6 ms of ignition, CFA3 reached the maximum pressure (0.5 MPa), which reached a higher pressure in a shorter time than FA3 (7.5 ms, 0.2 MPa). These indicate that Al/copper ferrites MICs have higher energy output efficiency, faster burning rate, and higher reactivity than Al/Fe2O3 MICs. The reasons are as follows: CFA3 has a slightly lower porosity than FA3 (see Section 3.3), the oxidizer component and the reductant component are in closer contact so that the thermite reaction is more likely to occur, the reaction rate is faster, and hot spots are more likely to form and cause shock waves. The boiling point of Cu (2562 °C) in the product is lower than that of Fe (2750 °C) so that more gas is easily formed. In addition, the existence of numbers of crystal defects in the copper ferrite crystals (as described in Section 3.1) makes copper ferrites decompose more easily than Fe2O3 to produce O2.
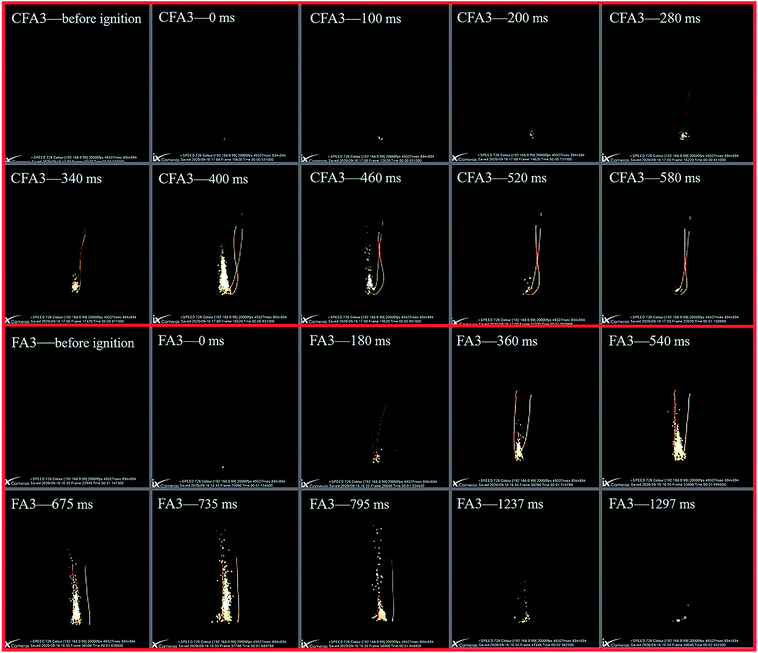
A high-speed camera can visually show the burning process of energetic materials. Fig. 8 is series of high-speed photographs which show the same amount (25 mg) of CFA3 and CF3 ignited by a fast-heating wire on a sample stage in the atmosphere. Take the first frame where the bright spot is found as the zero moment. Then the time of the most intense combustion and the time when the combustion basically ends were recorded. CFA3 (400 ms) takes less time to reach the most intense combustion than FA3 (735 ms). The entire burning time of CFA3 is only 520 ms, while FA3 is 1297 ms. This shows that CFA3 has a higher burning rate and higher reactivity. The maximum flame of CFA3 is also whiter and brighter than that of FA3, which indicates that the combustion temperature is higher. The flame of CFA3 is more concentrated while that of FA3 is more dispersed. Concentrating all the heat at one point is more conducive to the formation of shock waves. These phenomena are consistent with the results of the pressure cell combustion test, and the causes are also the same.
3.5 Catalytic performance for thermal decomposition of AP
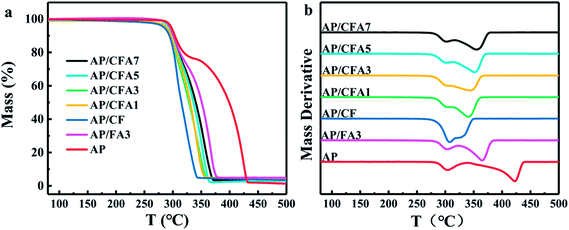
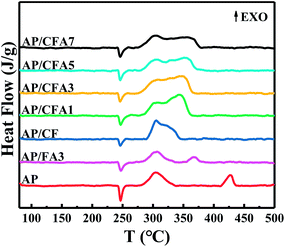
In addition to the characteristics of high combustion heat and large heat release, MICs also have excellent catalytic properties. MICs which contain transition metal oxide can be used to catalyze the thermal decomposition of AP which are usually used as the oxidizer of solid propellant. The effects of Al/copper ferrites to the thermal decomposition of AP were investigated by TG and DSC Technique.The TG and DTG curves of AP/Al/copper ferrites are shown in Fig. 9, the relevant parameters are listed in Table 4. In order to facilitate comparison, the data of pure AP and AP/FA3 are also presented in the above figures and tables. All the samples exhibit two weight losses, corresponding to the low-temperature decomposition (LTD) and high-temperature decomposition (HTD) of AP, respectively, which is consistent with the results which have been reported.31 The addition of MICs has not changed the thermal decomposition process of AP but affected the temperature at which each decomposition steps occur. The temperature of the LTD maximum decomposition rate (TLmax) of pure AP is 304.0 °C. With the addition of MICs, the TLmax of the samples changes in a small range (from 301.2 °C to 307.9 °C) which indicated that the MICs have little effect on the LTD of AP. In contrast, the temperature of the HTD maximum decomposition rate (THmax) of AP moved to the lower temperature by more than 50 °C after the addition of MICs. This is because Fe2O3 and copper ferrites have high catalytic efficiency for the HTD of AP, but have little effect on its LTD.32,33 In the LTD stage, ammonium perchlorate is decomposed into ammonia gas and perchloric acid gas. Ammonia will be adsorbed on the surface of the AP causing decomposition to stop.32 The reaction at this stage is not significantly affected by the catalyst. As the temperature rises, the ammonia gas desorbs and the thermal decomposition of AP continues (HTD). At this stage, the catalyst plays a key role (see the explanation of the mechanism below). The thermal effects of different AP thermal decomposition processes are tested by DSC, and the results are shown in Fig. 10. The DSC parameters are listed in Table 4. One endothermic peak and two exothermic peaks are observed in all samples, which are similar with the literature report.34 The endothermic peaks at about 247.0 °C with no weight loss are due to the phase transition of AP from orthorhombic to cubic.29,35 The phase transition temperature of all the samples is basically the same, indicating that the MICs did not affect the phase transition of AP. The first exothermic peak (TLEXO) at ∼302.2–312.3 °C is attributed to the LTD of AP, and the second exothermic peak (THEXO) at ∼333.2–426.6 °C is due to the HTD of AP. The exothermic peaks of pure AP are found at 304.9 °C (TLEXO) and 426.6 °C (THEXO). The TLEXO of AP makes no obvious changes but the THEXO is different after the addition of MICs, which is consistent with the thermogravimetric test results.
| Samples | TLmax (°C) | THmax (°C) | ΔT (°C) | TLEXO (°C) | THEXO (°C) | HeatEXO (J g−1) |
|---|---|---|---|---|---|---|
| a ΔT is the temperature difference between the THmax of sample and that of pure AP. | ||||||
| APCF | 307.9 | 331.6 | 90.9 | 305.2 | 327.6 | 1422.0 |
| APCFA1 | 304.4 | 340.9 | 81.6 | 304.7 | 343.9 | 1214.2 |
| APCFA3 | 303.3 | 343.9 | 78.6 | 304.6 | 354.4 | 1112.2 |
| APCFA5 | 302.1 | 351.9 | 70.6 | 304.4 | 358.4 | 837.6 |
| APCFA7 | 302.1 | 354.8 | 67.7 | 303.7 | 361.5 | 828.6 |
| APFA3 | 303.4 | 364.8 | 57.7 | 304.7 | 368.9 | 734.1 |
| AP | 304.0 | 422.5 | — | 304.9 | 428.4 | 617.9 |
Through TG and DSC data, it can be found that the addition of the MICs has a greater impact on the HTD of AP, which greatly reduces the temperature at which HTD occurs. It can be found from Fig. 9, 10, and Table 4 that, HTD temperature of AP with MICs has a slight rise when the content of Al in the MICs increased. It is to say, their catalytic efficiency for the HTD of AP decreases slightly with the increase of Al content. The reason is that Al has “dilution” and heat conduction effects, which will slow down the self-heating thermal decomposition process of energetic materials.36 The effect of dilution will make the relative content of the effective catalyst (copper ferrites) lower, and heat conduction will make it difficult to form “hot spots” in the material. When the Al content is the same, the HTD temperature of AP/CFA3 is lower than that of AP/FA3, which indicates that Al/copper ferrites MICs have a better catalytic effect than Al/Fe2O3 MICs. That is because copper ferrites have a better catalytic performance for AP thermal decomposition than Fe2O3. The synergistic effect of Cu–Fe oxides results in the better catalytic performance of their composite.10
The sum of the heat release (HeatEXO) during the thermal decomposition of AP obtained by the DSC curve integration of the two thermal decomposition stages increases with the addition of MICs (Table 4), suggesting a certain correlation between the activity of the catalyst and the amount of heat release. The overall trend is that the catalyst with higher activity causes higher heat release, consistent with the conclusions reported in the literature.37 The reason is that different catalysts affect the gas phase reaction of AP thermal decomposition differently, and thus the final gas products of AP thermal decomposition are different. However, the thermal decomposition of AP is essentially complex, because the compound AP is composed of four elements and the decomposition process is related to the full oxidation stages of nitrogen and chlorine.14 The HeatEXO decreases with the increase of Al content in the MICs, indicating that the larger the Al content in the same kind of MICs, the weaker the catalytic performance, which is consistent with the above. The data of HeatEXO confirmed the above conclusion that Al/copper ferrites MICs have a better catalytic effect.
The higher the activity of the catalyst, the lower the decomposition temperature of AP. In addition, if the catalyst has a stronger catalytic effect on a decomposition stage of AP, the relative mass loss and heat release in this stage will be larger. The synergistic effect of Cu–Fe oxides can be studied by the thermal decomposition mechanism of AP. According to the electron transfer mechanism,11,38 the decomposition of AP is initiated by the electron transfer from anion (ClO4−) to cation (NH4+), which results in the ammonium radical (NH04) and ClO4 radical (ClO04) species (eqn (1)). The probability of electron transfer is higher between the ions with smaller distances. Therefore, any ions around the ammonium ion within the interstices can act as an effective electron acceptor. The ammonium radical decomposes into ammonia and hydrogen atom (eqn (2)). The atomic hydrogen and ClO4 radical interact with each other to form HClO4 that further react with H as shown in eqn (3). The ClO3 radical traps an electron to form ClO3− that then reacts with NH3 in the gas phase to produce O2, N2O, Cl2, NO, H2O, and other species.39,40
| NH4+ + ClO4− → NH04 + ClO04 | (1) |
| NH04 → NH3 + H | (2) |
| HClO4 + H → H2O + ClO04 | (3) |
During the decomposition of AP, copper ferrites can provide a bridge for the electron transfer from the perchlorate ion to the ammonium ion, which lowers the activation energy of the thermal decomposition of AP. Consequently, the decomposition temperature of AP is lowered, and the decomposition rate of AP is increased. Specifically, the Cu2+ and Fe3+ act as the “other ions” during this process, and the catalytic process can be depicted as follows.16
| Cu2+ + ClO4− → Cu+ + ClO04 | (4) |
| Fe3+ + ClO4− → Fe2+ + ClO04 | (5) |
| Cu+ + NH4+ → Cu2+ + NH04 | (6) |
| Fe2+ + NH4+ → Fe3+ + NH04 | (7) |
There are partially filled 3d orbits in Fe2O3 and copper ferrites. Compared with the half-filled Fe3+ 3d5, Cu2+ 3d9 is easier to accept electrons from ClO4− to form a stable and fully filled Cu2+ 3d10. Therefore, the catalytic activity of copper ferrites for the thermal decomposition of AP is higher than that of Fe2O3.35 As our previous research results, there are more lattice defects in the prepared copper ferrites than in Fe2O3 (see Section 3.1). Such defects can promote the electron transfer ability of copper ferrites, which explains its better catalytic performance than those of Fe2O3. The large specific surface area of the prepared copper ferrites is also an important factor affecting its catalytic activity. As described above, the specific surface areas of Al/copper ferrites MICs are equivalent to those of Al/Fe2O3 MICs. Larger specific surface areas can provide more catalytically active sites and are thus are conducive to the catalytic performance. In addition, Cu is uniformly distributed in the copper ferrites structure, which keeps the active sites separated, and thus also improve its activity and stability.41
Compared with Fe2O3, copper ferrites have Cu2+ 3d9 orbits and more crystal defects; compared with CuO, copper ferrites have larger specific surface area (see Table S1 ESI†) and more crystal defects, so the catalytic activity of copper ferrites is higher than that of Fe2O3 or CuO, which explains the mechanism of Cu–Fe–O synergistic effect.
4. Conclusion
A kind of novel Al/copper ferrites metastable intermolecular energetic nanocomposite were prepared by a simple and mild sol–gel method followed by low temperature calcination. Due to the low calcination temperature, the calcination effect can be ensured while the oxidation of n-Al can be avoided. The XRD analysis suggests that the products contain crystal forms of aluminum and spinel-type ferrite crystal (CuFe2O4). The SEM images show that n-Al is evenly distributed in the matrix. That shows that the preparation was successful. In this work, dozens of grams of product can be obtained at one time to meet the requirements of propellant up to several kilograms. The SEM and nitrogen adsorption–desorption analyses reveal that the prepared Al/copper ferrites are mesoporous structures with large specific surface areas and the specific surface area increases sharply with the addition of n-Al then decrease slowly with the content of n-Al continues to increase. The change of specific surface area with n-Al content can be explained by the ink bottle model. Al/copper ferrites have better exothermic properties and lower thermal sensitivity than Al/Fe2O3 prepared by the same method. Pressure cell combustion test and high-speed photographs indicate that Al/copper ferrites MICs have higher energy output efficiency, faster burning rate, and higher reactivity than Al/Fe2O3 MICs. Al/copper ferrites have a better catalytic effect on AP thermal decomposition than Al/Fe2O3. It can be explained by the synergistic catalytic effect of Cu–Fe oxides which is discussed based on the electron transfer and proton transfer theories for the thermal decomposition of AP.In a word, Al/copper ferrites have the potential of high energy and catalytic combustion function and will exert the main good characteristics of MIC for the application in solid propellants.
Conflicts of interest
There are no conflicts to declare.Acknowledgements
This work was financially supported by NSFC and State Administration of Science, Technology and Industry for National Defense of China (HYZ2018001).References
- W. He, P. J. Liu, G. Q. He, M. Gozin and Q. L. Yan, Adv. Mater., 2018, 30, e1706293 CrossRef.
- Z. Song, M. Jin, M. Xian and C. Wang, Chem. Eng. J., 2020, 388, 124225 CrossRef CAS.
- K. Gao, G. Li, Y. Luo, L. Wang, L. Shen and G. Wang, J. Therm. Anal. Calorim., 2014, 118, 43–49 CrossRef CAS.
- C. Farley and M. Pantoya, J. Therm. Anal. Calorim., 2010, 102, 609–613 CrossRef CAS.
- M. L. Pantoya and J. J. Granier, J. Therm. Anal. Calorim., 2006, 85, 37–43 CrossRef CAS.
- J. Sun, M. L. Pantoya and S. L. Simon, Thermochim. Acta, 2006, 444, 117–127 CrossRef CAS.
- V. S. Parimi, S. Huang and X. Zheng, Proc. Combust. Inst., 2017, 36, 2317–2324 CrossRef CAS.
- R. Thiruvengadathan, C. Staley, J. M. Geeson, S. Chung, K. E. Raymond, K. Gangopadhyay and S. Gangopadhyay, Propellants, Explos., Pyrotech., 2015, 40, 729–734 CrossRef CAS.
- S. B. Kim, K. J. Kim, M. H. Cho, J. H. Kim, K. T. Kim and S. H. Kim, ACS Appl. Mater. Interfaces, 2016, 8, 9405–9412 CrossRef CAS.
- Y. Wang, X. Xia, J. Zhu, Y. Li, X. Wang and X. Hu, Combust. Sci. Technol., 2011, 183, 154–162 CrossRef CAS.
- S. Chaturvedi and P. N. Dave, J. Exp. Nanosci., 2012, 7, 205–231 CrossRef CAS.
- X. Li, Z. Ge, Q. Li, D. Li, Y. Zuo, B. Yan and Y. Luo, Chin. J. Energ. Mater., 2016, 24, 1102–1107 CAS.
- W. L. Hong, J. H. Liu, D. Y. Tian, F. Q. Zhao and F. Wang, J. Propul. Technol., 2003, 24, 560–562 CAS.
- V. V. Boldyrev, Thermochim. Acta, 2006, 443, 1–36 CrossRef CAS.
- L. Chen, L. Li and G. Li, J. Alloys Compd., 2008, 464, 532–536 CrossRef CAS.
- T. Liu, L. Wang, P. Yang and B. Hu, Mater. Lett., 2008, 62, 4056–4058 CrossRef CAS.
- A. Gayen, T. Baidya, K. Biswas, S. Roy and M. S. Hegde, Appl. Catal., A, 2006, 315, 135–146 CrossRef CAS.
- G. Singh, I. P. S. Kapoor, S. Dubey and P. F. Siril, Propellants, Explos., Pyrotech., 2009, 34, 72–77 CrossRef CAS.
- M. Ristic, B. Hannoyer, S. Popovic, S. Music and N. Bajraktaraj, Mater. Sci. Eng., B, 2000, 77, 73–82 CrossRef.
- E. Lafontaine and M. Comet, Methods for Preparing Nanothermites, 2016 Search PubMed.
- B. Mehendale, R. Shende, S. Subramanian, S. Gangopadhyay, P. Redner, D. Kapoor and S. Nicolich, J. Energ. Mater., 2007, 24, 341–360 CrossRef.
- Y. Liu, H. Zhang, H. Li and H. Li, J. Phys.: Conf. Ser., 2020, 1549, 032038 CrossRef CAS.
- J. E. Tasca, C. E. Quincoces, A. Lavat, A. M. Alvarez and M. G. Gonzalez, Ceram. Int., 2011, 37, 803–812 CrossRef CAS.
- Q. L. Yan, F. Q. Zhao, K. K. Kuo, X. H. Zhang, S. Zeman and L. T. Deluca, Prog. Energy Combust. Sci., 2016, 57, 75–136 CrossRef.
- S. J. Gregg and K. S. W. Sing, Adsorption, Surface Area and Porosity, 2nd edn, 1982 Search PubMed.
- M. Comet, B. Siegert, V. Pichot and D. Spitzer, J. Therm. Anal. Calorim., 2013, 111, 431–436 CrossRef CAS.
- N. H. Yen and L. Y. Wang, Propellants, Explos., Pyrotech., 2012, 37, 143–155 CrossRef CAS.
- M. S. Shin, J. K. Kim, J. W. Kim, C. A. M. Moraes, H. S. Kim and K. K. Koo, J. Ind. Eng. Chem., 2012, 18, 1768–1773 CrossRef CAS.
- S. H. Fischer and M. C. Grubelich, Proceedings of the 24th International Pyrotechnics Seminar, SAND98-1176C, 1998, pp. 231–286 Search PubMed.
- A. Prakash, A. Mccormick and M. Zachariah, Adv. Mater., 2005, 17, 900–903 CrossRef CAS.
- V. V. Boldyrev, V. V. Alexandrov, A. V. Boldyreva, V. I. Gritsan and E. F. Khairetdinov, Combust. Flame, 1970, 15, 71–77 CrossRef CAS.
- Z. Zhou, S. Tian, D. Zeng, G. Tang and C. Xie, J. Alloys Compd., 2012, 513, 213–219 CrossRef CAS.
- W. Wang and D. Zhang, RSC Adv., 2018, 8, 32221–32230 RSC.
- Z. Ma, R. Wu, J. Song, C. Li, R. Chen and L. Zhang, Propellants, Explos., Pyrotech., 2012, 37, 183–190 CrossRef CAS.
- E. A. Campos, M. T. Fernandes, E. Y. Kawachi, J. I. Sampaio de Oliveira and R. de Cássia Lazzarini Dutra, Propellants, Explos., Pyrotech., 2015, 40, 860–866 CrossRef CAS.
- Z. R. Liu, Thermal analyses for energetic materials, 2008 Search PubMed.
- S. Paulose, R. Raghavan and B. K. George, J. Ind. Eng. Chem., 2017, 53, 155–163 CrossRef CAS.
- Y. Wang, X. Yang, L. Lu and X. Wang, Thermochim. Acta, 2006, 443, 225–230 CrossRef CAS.
- A. Eslami, S. G. Hosseini and M. Bazrgary, J. Therm. Anal. Calorim., 2013, 113, 721–730 CrossRef CAS.
- A. Eslami, N. M. Juibari and S. G. Hosseini, Mater. Chem. Phys., 2016, 181, 12–20 CrossRef CAS.
- G. Pantaleo, L. F. Liotta, A. M. Venezia, G. Deganello, E. M. Ezzo, M. A. El Kherbawi and H. Atia, Mater. Chem. Phys., 2009, 114, 604–611 CrossRef CAS.
Footnote |
| † Electronic supplementary information (ESI) available: TG and DTG curves of AP/copper ferrites; DSC curves of AP/copper ferrites; X-ray diffraction patterns of CFA3 before and after calcination; TG curves of CFA3 before and after calcination; SEM image of pure n-Al. See DOI: 10.1039/d0ra10591k |
| This journal is © The Royal Society of Chemistry 2021 |

