
 Open Access Article
 This Open Access Article is licensed under a Creative Commons Attribution-Non Commercial 3.0 Unported Licence
Knecorticosanones C–H from the fruits of Knema globularia (Lam.) warb†
Chindawadee Chuenbana,
Aonnicha Sombatsria,
Thurdpong Sribuhoma,
Chanakan Pornchoob,
Auemduan Prawan b,
Sarawut Tontaphac,
Vittaya Amornkitbamrungc and
Chavi Yenjai*a
b,
Sarawut Tontaphac,
Vittaya Amornkitbamrungc and
Chavi Yenjai*a
aNatural Products Research Unit, Department of Chemistry and Center of Excellence for Innovation in Chemistry, Faculty of Science, Khon Kaen University, Khon Kaen 40002, Thailand. E-mail: chayen@kku.ac.th; Tel: +66-4320-2222-41 ext. 12243
bDepartment of Pharmacology, Faculty of Medicine, Khon Kaen University, Khon Kaen 40002, Thailand
cIntegrated Nanotechnology Research Centre, Department of Physics, Faculty of Science, Khon Kaen University, Khon Kaen 40002, Thailand
First published on 20th January 2021
Abstract
Six undescribed polyketides, 1–6, were discovered from the fruits of Knema globularia (Lam.) warb. Two known polyketides and three known lignans were also isolated. Cytotoxicities against HepG2 and KKU-M156 cells of all polyketides were evaluated. Compound 1 displayed the most cytotoxic activity against HepG2 and KKU-M156 cell lines with IC50 values of 1.57 ± 0.37 and 1.78 ± 0.14 μg mL−1, respectively. The structure of all isolates was identified using spectroscopic methods including NMR, IR, MS and ECD.
1. Introduction
The plant Knema genus (Myristicaceae) comprises over 60 species, and they are located in tropical Asia, Africa and Australia.1 At least 12 species have been found distributed throughout Thailand.2 Some Knema plants have been used to treat sore mouths and throats, pimples and skin diseases.3 There are many reports on biological activities of Knema species such as antimicrobial,4 antioxidant,5,6 anticancer,7–10 antidiabetic,11 and antimalarial12 activities.Knema globularia or Lueat Raet in Thai, is a traditional medicine. An ingredient of external preparation for skin diseases and scabies is made from the oil of the seeds of this plant2,13 while the bark is used as a blood tonic. The chemical components of this plant are flavonoids, polyketides and steroids.8,10,14,15 Herein, the chemical constituents from the fruits of this plant are reported, as well as their cytotoxicity against cholangiocarcinoma, KKU-156, and liver cancer cells, HepG2, evaluated using the SRB assay.
2. Discussion
Chemical investigation of the fruits of Knema globularia (Lam.) warb using a chromatographic method led to the isolation of eight polyketides (1–8) and three lignans (9–11). Six new compounds, knecorticosanones C–H (1–6) were discovered, and in addition, five known compounds including, knecorticosanones A and B (7 and 8),10 8,8′-cis-cubebin (9),16 (−)-α-cubebin (10)17 and (−)-β-cubebin (11)18 were also found (Fig. 1).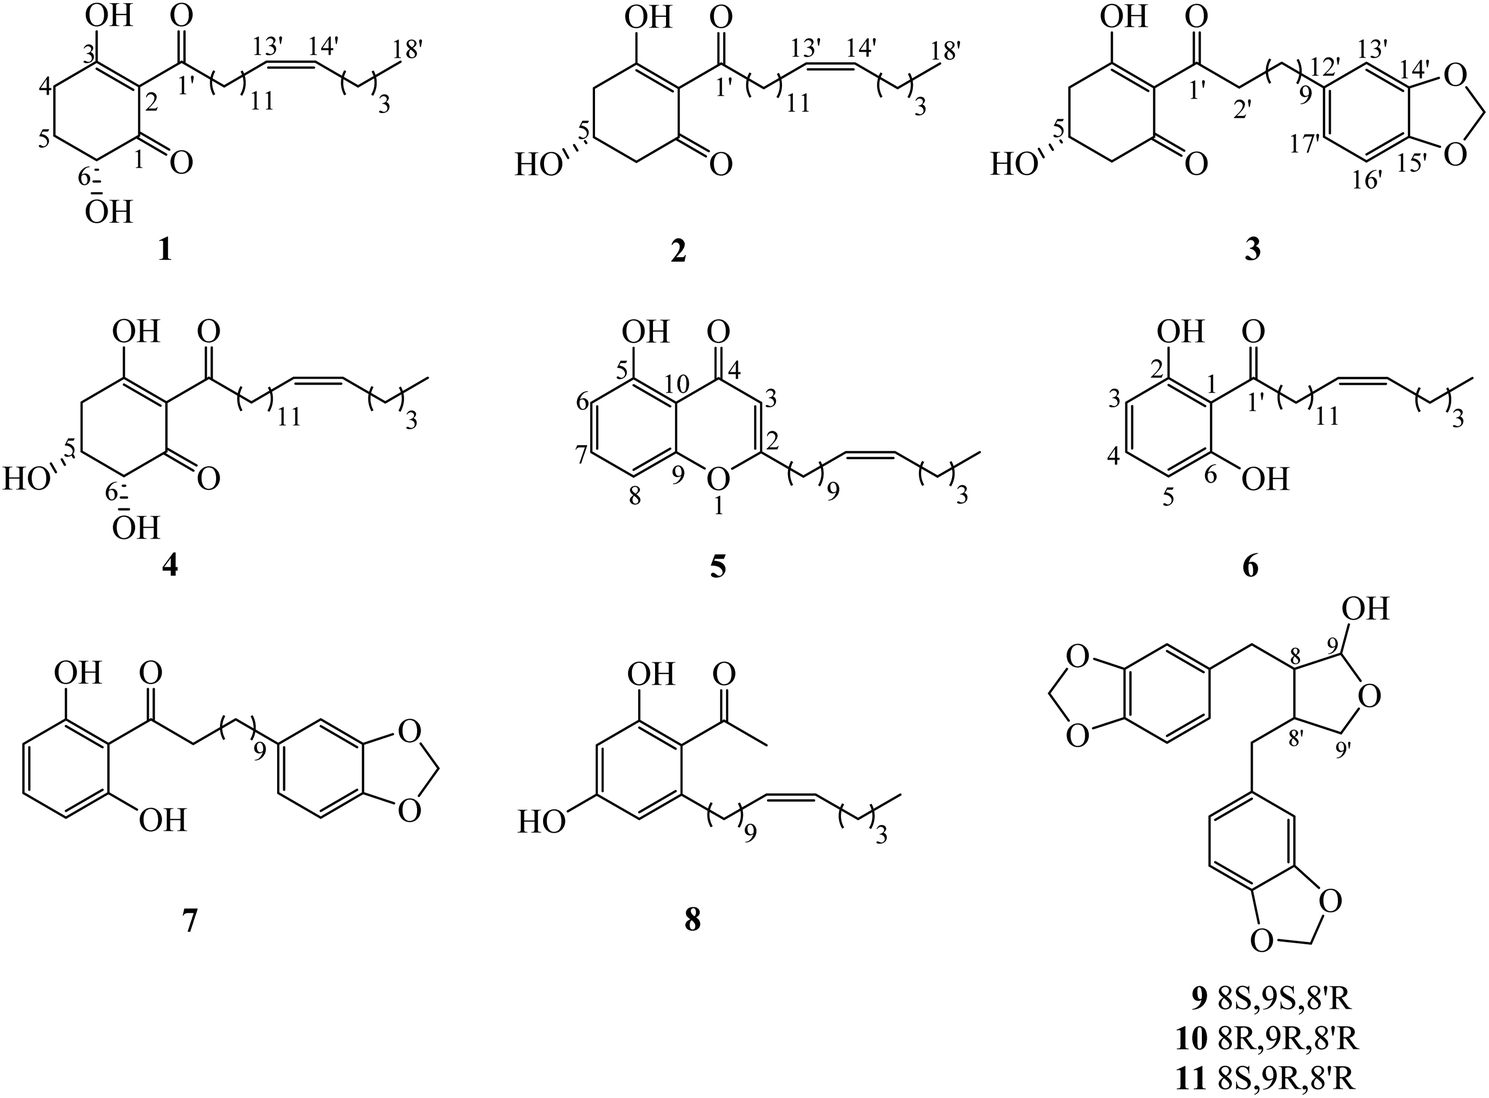 | ||
| Fig. 1 The structures of all isolated compounds 1–11. | ||
Compound 1 showed a molecular ion at m/z 393.3013 [M + H]+ corresponding to the molecular formula C24H40O4. The IR spectrum showed absorption bands of a hydroxyl group (3466 cm−1) and carbonyl groups (1664 cm−1). The 13C NMR spectrum displayed three carbonyl carbons at δC 195.6 (C-1), 197.9 (C-3) and 206.1 (C-1′) of a 2-acylcyclohex-2-en-1-one moiety. The low field signal at δH 18.2 indicated an intramolecular hydrogen bonding (Table 1). The doublet of doublet signal at δH 4.03 (J = 13.0, 5.3 Hz) was assigned as H-6, located on the oxygenated carbon at δC 71.3. The large coupling constant (J = 13.0 Hz) indicates the axial orientation of this proton, and the hydroxyl group was located at the equatorial position (Fig. 3). The multiplet signals of methylene protons H-5 showed at δH 2.32 and δH 1.77, while that of H-4 showed at δH 2.74, while these protons were located on the carbons at δC 26.9 and δH 31.3, respectively (Table 2). Cross peaks between H-4 and C-2 (δC 110.3), C-3 (δC 197.9) and C-6 (δC 71.3) were evident (Fig. 2). Long range coupling between H-6 and C-1 (195.6), C-4 (31.3) and C-5 (26.9) were observed. The 1H–1H COSY spectrum showed the connection of H-4/H-5/H-6. The 1H NMR spectrum displayed two olefinic protons at δH 5.29 (t, J = 5.0 Hz, H-13′ and H-14′). The 13C NMR data exhibited fourteen methylene carbons around δC ∼ 40.3–22.4 (C-2′ to C-12′ and C-15′ to C-17′). Long range correlations between a terminal methyl proton (δH 0.84, t, J = 7.0 Hz, H-18′) and C-16′ (δC 32.0) and C-17′ (δC 22.4) were evident. Correlations of H-17′ (1.28) to C-15′ (δC 27.2), of H-14′ to C-15′ (δC 27.2) and C-16′ (δC 32.0), and of H-13′ to C-12′ (δC 27.2) indicated the assignment of a double bond at the C-13′/C-14′ position. Cis geometry of double bond was confirmed on the basis of the typical shielded signals of α-olefinic carbons at δC ∼ 26–27 while trans geometry showed around δC ∼ 32–33.19 The multiplet signal at δH 2.96 (H-2′) correlated to the carbonyl carbon at δH 206.1 (C-1′) in the HMBC experiment. The specific rotation of this compound was [α]20.8D = +37.1 (c 0.1, MeOH) with the same sign as (+)-trineurone E.19 The experimental ECD spectrum displayed a negative Cotton effect at 220 nm (Δε − 41.33) and positive Cotton effect at 237 (Δε + 7.13) and 288 (Δε + 11.00) which appropriately matched the calculated spectrum for the (6R) configuration. Thus the structure of 1 was identified as 3,6-dihydroxy-2-(octadec-13′Z-enoyl)cyclohex-2-en-1-one which was named knecorticosanone C.
| Position | 1 | 2 | 3 | 4 | 5 | 6 |
|---|---|---|---|---|---|---|
| a Overlapping signals. | ||||||
| 3 | — | — | — | — | 6.00, s | 6.38, d (8.2) |
| 4 | 2.74, m | 2.94, dd (18.0, 3.8) | 2.94, dd (18.0, 4.0) | 3.05, dd (10.0, 2.7) | — | 7.21, t (8.2) |
| 2.78, dd (18.0, 6.0) | 2.76, dd (18.0, 3.5) | 2.97, dd (10.0, 2.7) | ||||
| 5 | 2.32, m | 4.39, m | 4.40, m | 4.43, q (2.8) | — | 6.38, d (8.2) |
| 1.77, m | ||||||
| 6 | 4.03, dd (13.0, 5.3) | 2.76, dd (16.5, 4.0) | 2.79, dd (16.2, 5.4) | 4.17, d (2.8) | 6.75, d (8.4) | — |
| 2.63, dd (16.5, 6.7) | 2.63, dd (16.2, 6.5) | |||||
| 7 | — | — | — | — | 7.38, t (8.4) | — |
| 8 | — | — | — | — | 6.65, d (8.4) | — |
| 1′ | — | — | — | — | 2.50, t (8.0) | — |
| 2′ | 2.96, m | 3.01, t (7.6) | 3.01, t (7.0) | 2.99, m | 1.63, p (7.0) | 3.12, t (7.3) |
| 3′ | 1.57, m | 1.60, p (7.0) | 1.26, m | 1.62, m | 1.20, m | 1.69, p |
| 4′–8′ | 1.25, m | 1.30, m | 1.26, m | 1.29, m | 1.20, m | 1.29, m |
| 9′ | 1.25, m | 1.30, m | 1.26, m | 1.29, m | 1.92, m | 1.29, m |
| 10′ | 1.25, m | 1.30, m | 1.26, m | 1.29, m | 5.25, t (5.4) | 1.29, m |
| 11′ | 1.25, m | 1.30, m | 2.50, t (7.6) | 1.29, m | 5.25, t (5.4) | 1.29, m |
| 12′ | 1.97, m | 2.01, m | — | 2.01, m | 1.92, m | 2.01, m |
| 13′ | 5.29, t (5.0) | 5.34, t (4.6) | 6.66, s | 5.34, t (4.7) | 1.20, ma | 5.34, t (4.6) |
| 14′ | 5.29, t (5.0) | 5.34, t (4.6) | — | 5.34, t (4.7) | 1.20, ma | 5.34, t (4.6) |
| 15′ | 1.97, m | 2.01, m | — | 2.01, m | 0.80, t (6.5) | 2.01, m |
| 16′ | 1.28, ma | 1.31, ma | 6.71, d (7.5) | 1.30, ma | 1.30, ma | |
| 17′ | 1.28, ma | 1.31, ma | 6.61, d (7.5) | 1.30, ma | 1.30, ma | |
| 18′ | 0.84, t (7.0) | 0.89, t (7.0) | 0.89, t (7.0) | 0.89, t (7.0) | ||
| OH | 18.2, s | 18.2, s | 18.2, s | 18.3, s | 12.4, br s | 9.62, br s |
| OCH2O | — | — | 5.90, s | — | — | — |
| Position | 1 | 2 | 3 | 4 | 5 | 6 |
|---|---|---|---|---|---|---|
| 1 | 195.6 | 193.2 | 192.6 | 193.8 | — | 110.1 |
| 2 | 110.3 | 113.3 | 112.7 | 110.7 | 171.3 | 161.2 |
| 3 | 197.9 | 196.5 | 195.8 | 196.3 | 108.4 | 108.4 |
| 4 | 31.3 | 42.0 | 41.4 | 38.4 | 183.6 | 135.6 |
| 5 | 26.9 | 63.9 | 63.3 | 67.0 | 160.8 | 108.4 |
| 6 | 71.3 | 47.7 | 47.0 | 74.7 | 111.1 | 161.2 |
| 7 | — | — | — | — | 135.0 | — |
| 8 | — | — | — | — | 106.9 | — |
| 9 | — | — | — | — | 156.8 | — |
| 10 | — | — | — | — | 110.6 | — |
| 1′ | 206.1 | 206.1 | 205.4 | 205.4 | 34.4 | 208.0 |
| 2′ | 40.3 | 40.8 | 40.1 | 40.2 | 26.8 | 44.8 |
| 3′ | 24.6 | 25.1 | 31.6–29.2 | 25.1 | 29.8–29.0 | 24.4 |
| 4′–8′ | 29.8–29.3 | 30.2–29.8 | 31.6–29.2 | 30.2–29.8 | 29.8–29.0 | 29.8–29.3 |
| 9′ | 29.8–29.3 | 30.2–29.8 | 31.6–29.2 | 30.2–29.8 | 27.2 | 29.8–29.3 |
| 10′ | 29.8–29.3 | 30.2–29.8 | 31.6–29.2 | 30.2–29.8 | 129.9 | 29.8–29.3 |
| 11′ | 29.8–29.3 | 30.2–29.8 | 35.5 | 30.2–29.8 | 129.9 | 29.8–29.3 |
| 12′ | 27.2 | 27.7 | 136.7 | 27.7 | 27.2 | 27.2 |
| 13′ | 129.9 | 130.4 | 108.7 | 130.4 | 32.0 | 129.9 |
| 14′ | 129.9 | 130.4 | 147.2 | 130.4 | 22.4 | 129.9 |
| 15′ | 27.2 | 27.4 | 145.2 | 27.4 | 14.1 | 26.9 |
| 16′ | 32.0 | 32.4 | 107.8 | 32.4 | — | 32.0 |
| 17′ | 22.4 | 22.8 | 120.8 | 22.8 | — | 22.4 |
| 18′ | 14.0 | 14.5 | — | 14.5 | — | 14.0 |
| OCH2O | — | — | 100.5 | — | — | — |
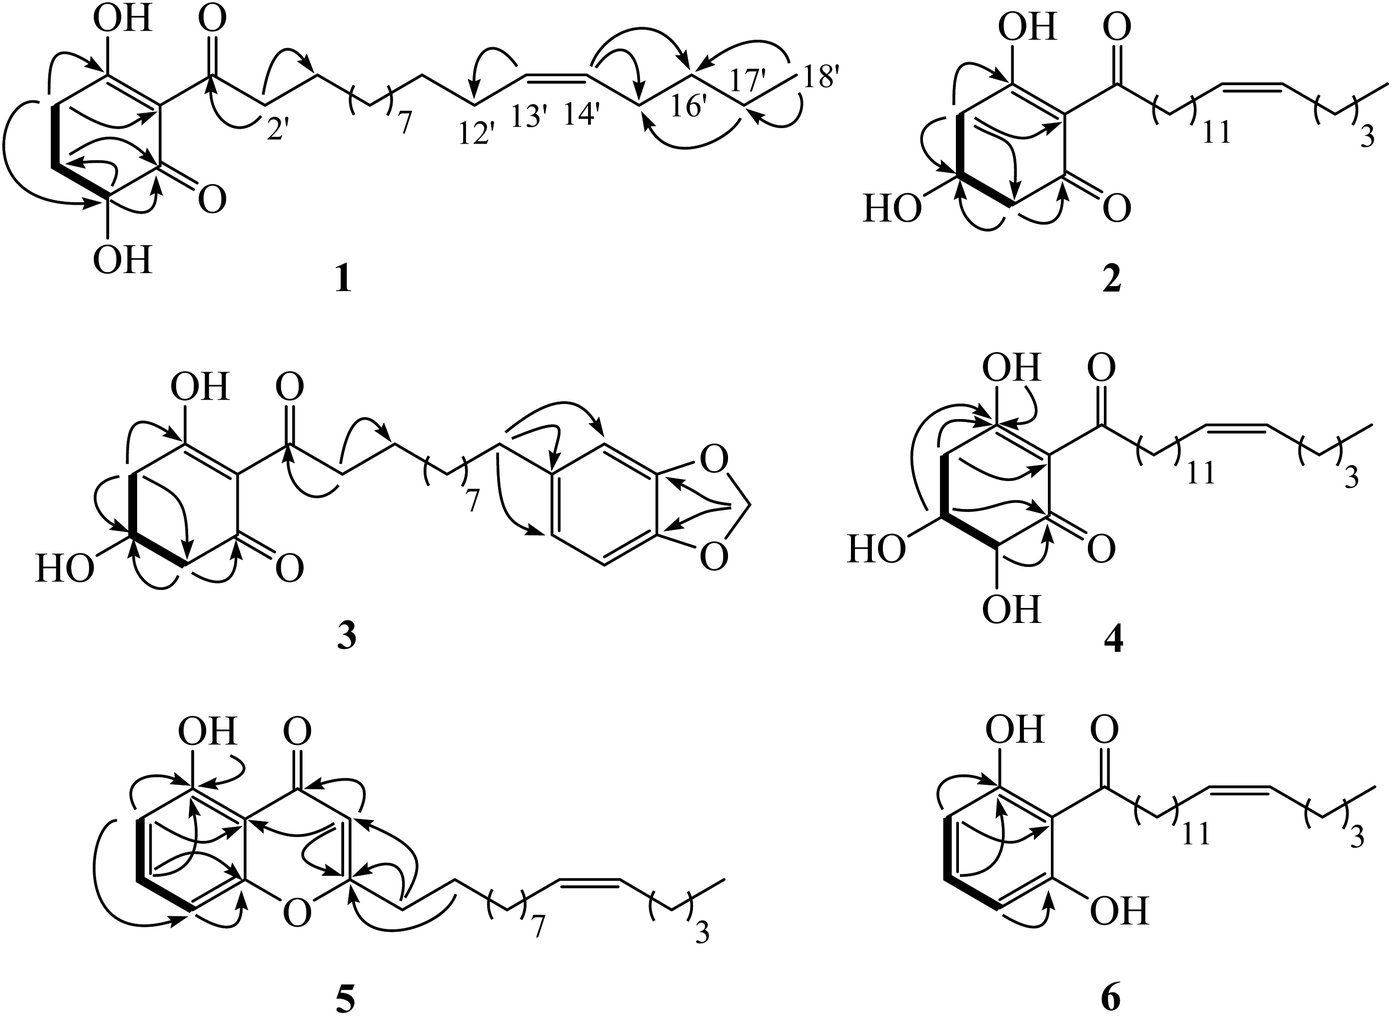 | ||
| Fig. 2 Key HMBC correlations of compounds 1–6. | ||
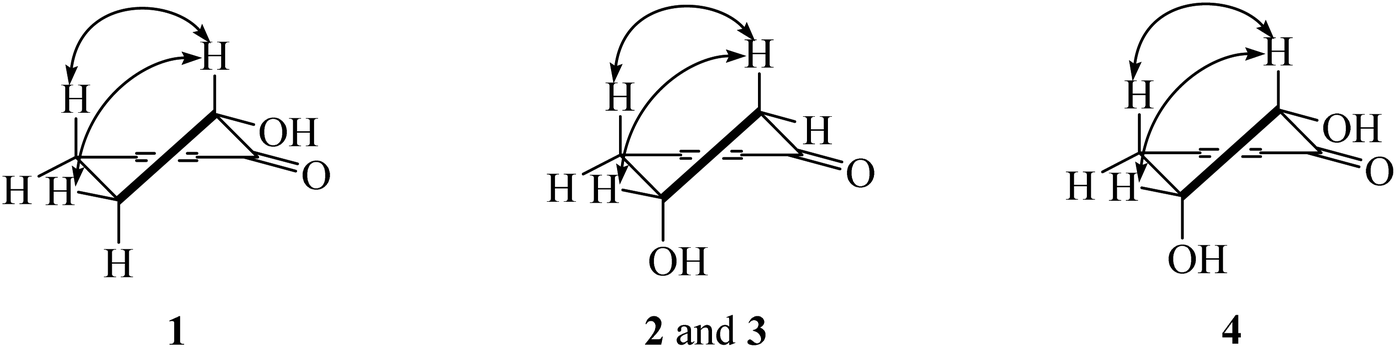 | ||
| Fig. 3 NOESY correlations of compounds 1–4. | ||
Compound 2, a yellowish oil, had the molecular formula C24H40O4, determined from m/z 393.2988 [M + H]+ in the HRESIMS data. The low field singlet signal at δH 18.2 (1H, s, OH) indicated intramolecular H-bonding of the enone part. The 13C NMR spectra showed three carbonyl carbons at δC 193.2 (C-1), 196.5 (C-3) and 206.1 (C-1′) of the 2-acylcyclohex-2-en-1-one part. A multiplet signal at δH 4.39 (H-5) showed correlation with carbon at δC 63.9 in the HMQC spectrum, indicating the presence of the hydroxyl group in this position. Two methylene protons displayed at δH 2.94 (1H, dd, J = 18.0, 3.8 Hz, H-4a), 2.78 (1H, dd, J = 18.0, 6.0 Hz, H-4b), 2.76 (1H, dd, J = 16.5, 4.0 Hz, H-6a) and 2.63 (1H, dd, J = 16.5, 6.7 Hz, H-6b). The HMBC experiment displayed correlations between H-4 and C-3 (δC 196.5), C-5 (δC 63.9) and C-6 (δC 47.7), in addition, between H-6 and C-1 (δC 193.2), C-4 (δC 42.0) and C-5 (δC 63.9). In the 1H–1H COSY spectrum, the connection of H-4/H-5/H-6 was observed. This information confirmed the presence of the 5-hydroxycyclohex-2-en-1-one moiety. The small coupling constants between H-4 and H-5 (J = 3.8 and 6.0 Hz) as well as H-5 and H-6 (J = 4.0 and 6.7 Hz) indicate the equatorial orientation of H-5 (Fig. 3). The remaining signals in the 1H, 13C NMR and also the HMBC spectra of acylhydrocarbon side chain showed the same as compound 1. The specific rotation of this compound was [α]18.5D = −50.7 (c 0.1, MeOH). The experimental ECD spectrum displayed a positive Cotton effect at 191 nm (Δε + 8.91) and negative Cotton effect at 198 (Δε − 3.88) which appropriately matched the calculated spectrum for the (6R) configuration. All data confirmed that the structure of 2 was 3,5-dihydroxy-2-(octadec-13′Z-enoyl)cyclohex-2-en-1-one which was named knecorticosanone D.
Compound 3 was obtained as a yellowish oil and showed the molecular ion peak at m/z 439.2124 [M + Na]+ in HRESIMS, consistent with the molecular formula C24H32O6. The IR spectrum displayed absorption bands of a hydroxyl group (3360 cm−1) and carbonyl groups (1716 and 1633 cm−1). The low field singlet signal at δH 18.2 (1H, s, OH) indicated intramolecular H-bonding of the enone part. The 13C NMR spectra showed carbonyl carbons at δC 192.6 (C-1), 195.8 (C-3) and 205.4 (C-1′) of the 2-acylcyclohex-2-en-1-one moiety. The 1H NMR spectrum showed the ABX pattern of 1,3,4-trisubstituted benzene at δH 6.66 (1H, s, H-13′), 6.71 (1H, d, J = 7.5 Hz, H-16′) and 6.61 (1H, d, J = 7.5 Hz, H-17′) and these protons were attached to carbons at δC 108.7 (C-13′), 107.8 (C-16′) and 120.8 (C-17′), respectively. The 13C NMR experiment showed signals at δC 147.2 and 145.2 of C-14′ and C-15′, respectively. The signal at δH/δC 5.90/100.5 was assigned as a methylenedioxy group. The correlations between methylenedioxy protons and carbons C-14′ and C-15′ were evident in the HMBC experiment. The multiplet signal at δH 4.40 was assigned as an oxymethine proton at C-5 (δC 63.3). The doublet of doublet signals at δH 2.94 (1H, J = 18.0, 4.0 Hz) and δH 2.76 (1H, J = 18.0, 3.5 Hz) belonged to H-4 and was located on the carbon at δC 41.4. The methylene protons at δH 2.79 (1H, J = 16.2, 5.4 Hz) and δH 2.63 (1H, J = 16.2, 6.5 Hz) were assigned as H-6 and attached to the carbon at δC 47.0. The equatorial orientation of H-5 was determined by the small coupling constant between H-4 and H-5 (J = 4.0 and 3.5 Hz) and between H-5 and H-6 (J = 6.5 and 5.4 Hz). The HMBC experiment displayed the correlations between H-4 and C-3 (δC 195.8), C-5 (δC 63.3) and C-6 (δC 47.0), in addition, between H-6 and C-1 (δC 192.6), C-4 (δC 41.4) and C-5 (δC 63.3). The rest of the 13C NMR signals also showed ten methylene carbons around δC 40.1 to 29.2. The signals at δC 40.1 and 35.5 were assigned as C-2′ and C-11′, respectively. Cross peaks in the HMBC spectrum showed correlations of H-2′ and C-1′, C-3′ and C-4′ while those of H-11′ were C-12′, C-13′ and C-17′. The specific rotation of this compound was [α]18.5D = −52.1 (c 0.1, MeOH). The experimental ECD spectrum displayed a positive Cotton effect at 210 nm (Δε + 11.48) and negative Cotton effect at 218 nm (Δε − 1.97). Thus, the structure of compound 3 was 3,5-dihydroxy-2-(11′-phenyl-14′-methylenedioxy-undecanoyl)cyclohex-2-en-1-one, named knecorticosanone E, established as shown.
Compound 4 was found as brown oil and showed the molecular formula of C24H40O5 determined from the molecular ion peak m/z 409.2947 [M + H]+. The 1H NMR spectrum showed a low field shift signal the same as compounds 1–3 at δH 18.3. The 13C NMR data displayed carbonyl carbons at δC 205.4 (C-1′), 193.8 (C-1) and 196.3 (C-3) and olefinic carbons at δC 110.7 (C-2). This information indicates the 3-hydroxycyclohex-2-en-1-one moiety and acyl side chain. The 1H NMR experiment displayed methine oxygenated protons at δH 4.43 (q, J = 2.8 Hz) and 4.17 (d, J = 2.8 Hz) which were assigned as H-5 and H-6, respectively. The small coupling constant (J = 2.8 Hz) of H-6 indicated the axial-equatorial coupling of H-6 and H-5. The quartet signal of H-5 (J = 2.8 Hz) was observed in the 1H NMR spectrum and indicated the equatorial axis of H-5. The HMQC data insisted that these two protons were located on oxygenated carbons at δC 67.0 (C-5) and 74.7 (C-6). The doublet of doublet signals at δH 2.97 and 3.05 (each 1H, J = 10.0, 2.7 Hz) of H-4 attached to a carbon at δC 38.4. The 1H–1H COSY showed the connection of the H-4/H-5/H-6 system. Cross peaks between H-4 and C-2 (110.7) and C-3 (196.3), between H-5 and C-1 (193.8) and C-3 (196.3), and between H-6 and C-1 (193.8) were evident. The rest of 1H and 13C NMR signals showed an alkenoyl side chain which was the same as compounds 1 and 2. Thus, the structure of 4 was determined as 3,5,6-trihydroxy-2-(octadec-13′Z-enoyl)cyclohex-2-en-1-one, named knecorticosanone F, as shown in Fig. 1.
The HRESIMS data of compound 5 indicated a molecular formula of C24H34O3 (m/z 371.2578 [M + H]+). An intramolecular hydrogen bond of a hydroxyl proton displayed low field shift at δH 12.4. The HMBC experiment displayed correlation between hydroxy proton and carbon at δC 160.8 (C-5). The 1H NMR showed two doublet signals (J = 8.4 Hz) at δH 6.75 and δH 6.65 which were assigned as H-6 and H-8, respectively. These protons correlated with aromatic carbons at δC 111.1 (C-6) and δC 106.9 (C-8), respectively, in the HMQC experiment. The proton H-7 exhibited a triplet signal at δH 7.38 and was located on an aromatic carbon at δC 135.0. Cross peaks between H-6 and C-5 (δC 160.8), C-10 (δC 110.6) and C-8 (δC 106.9), between H-7 and C-5 (δC 160.8) and C-9 (δC 156.8) and between H-8 and C-6 (δC 111.1), C-9 (δC 156.8) and C-10 (δC 110.6) were observed in the HMBC spectrum. The 13C NMR signals of C-2 and C-4 appeared at δC 171.3 and δC 183.6, respectively. The signals at δH/δC 6.00/108.4 of methine proton H-3 showed long range coupling with C-2 (δC 171.3), C-4 (δC 183.6) and C-10 (δC 110.6). The long chain hydrocarbon at the C-2 position was confirmed by the correlation of H-1′ (δH/δC 2.50/34.4) and C-2 (δC 171.3) and C-3 (δC 108.4), in addition, correlation between H-2′ (δH/δC 1.63/26.8) and C-2 was observed. The cis double bond was confirmed by the typical shielded signals of carbon C-9′ and C-12′ at δC 27.2. All data confirmed the structure of 5 was 5-hydroxy-2-(10′Z-pentadecenyl)-4H-chromen-4-one, named knecorticosanone G, as shown.
The molecular formula of compound 6, C24H38O3, was confirmed on the basis of the molecular ion peak m/z 397.2710 [M + Na]+. The broad singlet signal at δH 9.62 was assigned to the intramolecular hydrogen bond of a hydroxyl group. Three aromatic protons at δH 7.21 (1H, t, J = 8.2 Hz, H-4) and δH 6.38 (2H, d, J = 8.2 Hz, H-3 and H-5) were observed in the 1H NMR spectrum. Correlations between H-3 and C-1 (δC 110.1) and C-2 (δC 161.2), between H-4 and C-2 (δC 161.2) were evident. The 13C NMR spectrum displayed an acylalkenyl side chain by showing a carbonyl ketone at δC 208.0 and cis double bond (C-13′ and C-14′) at δC 129.9, in addition, α-olefinic C-12′ and C-15′ showed at δC 27.2 and 26.9, respectively. Correlations in the HMBC spectrum of protons and carbons at C-14′ to C-18′ were the same as compound 1. Thus, the structure of compound 6 was 1,3-dihydroxy-2-(octadec-13′Z-enoyl)benzene, named knecorticosanone H, established as shown.
Biological activity
Compounds 1–8 were evaluated for cytotoxicity against HepG2 and KKU-M156 cells by using the sulforhodamine B assay and the results are shown in Table 3. Compound 1 exhibited the most cytotoxic activity against HepG2 and KKU-M156 cell lines with IC50 values of 1.57 ± 0.37 and 1.78 ± 0.14 μg mL−1, respectively. Compound 2 showed an IC50 value around 50 μg mL−1 against these two cell lines. Comparing the activity between compounds 2 and 1, it seems that the hydroxyl group at the C-6 position is important for the cytotoxic activity. Compound 3 exhibited cytotoxicity with IC50 values of 6.81 ± 1.15 and 8.83 ± 1.76 μg mL−1 against HepG2 and KKU-M156 cell lines, respectively, which was stronger than compound 2. These results indicate that the aryl moiety is necessary for the cytotoxicity. In the case of compound 6, it showed stronger activity than 2. Hence, it was concluded that the 1,3-dihydroxybenzene moiety was important for the activity. In the case of compounds 6 and 7, the results support that the aryl moiety appeared to increase the activity. Chromone 5 displayed cytotoxicity against these two cell lines with IC50 values of 8.17 ± 2.47 and 15.92 ± 3.68 μg mL−1. These results suggest that compound 5 was selective to the HepG2 cell line.| Compound | HepG2 | KKU-M156 |
|---|---|---|
| a Inactive at IC50 > 50 μg mL−1. | ||
| 1 | 1.57 ± 0.37 | 1.78 ± 0.14 |
| 3 | 6.81 ± 1.15 | 8.83 ± 1.76 |
| 5 | 8.17 ± 2.47 | 15.92 ± 3.68 |
| 6 | 25.26 ± 7.37 | 23.14 ± 3.79 |
| 7 | 10.50 ± 3.48 | 18.66 ± 4.36 |
| 8 | 18.39 ± 6.31 | 34.19 ± 12.53 |
| The other | Inactive | Inactive |
| Cisplatin | 4.67 ± 1.63 | 30.09 ± 15.11 |
3. Experimental section
General experimental procedures
Melting points were detected by a Sanyo Gallenkamp melting point apparatus. A JASCO P-1020 digital polarimeter was used to determine optical rotations. The UV spectra were obtained using an Agilent 8453 UV-visible spectrophotometer. A PerkinElmer Spectrum One FT-IR spectrophotometer was used to acquire the IR spectra. A Varian Mercury Plus spectrometer (400 MHz) was used to measure the NMR spectra. HRESIMS was performed on a Micromass Q-TOF 2 hybrid quadrupole time-of-flight (Q-TOF) mass spectrometer. Flash column chromatography (FCC) was performed by using silica gel less than 0.063 mm. Analytical thin-layer chromatography (TLC) was accomplished on Merck Si gel 60 F254 plates.Plant material
The fruits of K. globularia were collected from Ban Thawat Buri, Thawat Buri District, Roi-Et Province, Thailand (16°06′00.8′′N, 103°49′06.2′′E) in April 2019. The plant was identified by Asst. Prof. Dr Suppachai Tiyaworanant, Faculty of Pharmaceutical Sciences, Khon Kaen University. A voucher sample (KKU022019) was deposited in the Natural Product Research Unit, Khon Kaen University, Khon Kaen.Extraction and isolation
The dried powdered fruits of K. globularia (1.25 kg) were soaked in hexane (3 L × 3), EtOAc (3 L × 3), and MeOH (3 L × 3). Solvent removal was done in vacuo to produce crude hexane (126 g), EtOAc (89 g), and MeOH (73 g) extracts. The crude hexane extract (126 g) was subjected to column chromatography, eluted with a gradient system of hexane, hexane–EtOAc and EtOAc–MeOH. On the basis of their TLC characteristics, the fractions which contained the same major compounds were combined to give eight fractions (H1–H8). Fraction H3 was subjected to silica gel column chromatography and eluted with a gradient system of hexane, hexane–EtOAc and EtOAc–MeOH to give 9 subfractions. Subfraction H3.3 was purified by RP-C18 column chromatography and eluted with MeOH to give 5 (38.0 mg, 0.0302%). Gel filtration (sephadex LH-20) was carried out on subfraction H3.8 eluting with MeOH and afforded 6 (52.6 mg, 0.0418%). Subfraction H3.9 was further purified by column chromatography, eluting with 100% CH2Cl2 and afforded 3 (10.3 mg, 0.0082%). Moreover, fraction 4 was purified by silica gel CC using 20% EtOAc/hexane to yield 10 subfractions. Further purification of subfraction H4.4 (silica gel CC, 20% EtOAc/hexane) gave 8 subfractions. Subfraction H4.4.4 was purified by silica gel FCC and eluted with 50% CH2Cl2/hexane to yield 8 (16.0 mg, 0.0127%). Compound 7 (8.8 mg, 0.0070%) was obtained from fraction H5 (silica gel CC, 20% EtOAc/hexane).The crude EtOAc extract (89 g) was subjected to column chromatography and afforded 10 fractions. Fraction E3 was purified by silica gel FCC and eluted with 50% CH2Cl2/hexane to give 6 subfractions. Subfraction E3.4 was further purified by preparative TLC using pure CH2Cl2 to yield 9 (5.2 mg, 0.0058%). Moreover, fraction E6 was further purified by column chromatography, eluting with 100% CH2Cl2 and afforded 8 subfractions. Subfraction E6.2 was further purified by sephadex LH-20 to give 4 subfractions. A mixture of compounds 10 and 11 (10.1 mg, 0.0114%) was obtained from the recrystallization of subfraction E6.2.3.
The crude MeOH extract (73 g) was subjected to column chromatography and afforded 5 fractions. Fraction M2 was purified by silica gel CC and eluted with 10% EtOAc/hexane to give 1 (35.6 mg, 0.0488%). Fraction M3 was purified by RP-C18 column chromatography eluted with MeOH to yield 4 subfractions. Moreover, subfraction M3.2 was purified by preperative TLC with 100% CH2Cl2 to yield 2 (30.2 mg, 0.0414%). Fraction 4 was further purified by sephadex LH-20 to give 4 subfractions. Subfraction M4.3 was purified by RP-C18 column chromatography eluted with MeOH to give 5 subfractions. Subfraction 4.3.3 was further purified by preparative TLC using pure CH2Cl2 to yield 4 (10.8 mg, 0.0302%).
Compound (1): yellowish oil; [α]20.8D + 37.1 (c 0.1, CH3OH); UV (CH3OH) λmax (log![[thin space (1/6-em)]](https://www.rsc.org/images/entities/char_2009.gif) ε) 234 (4.11), 272 (4.27) nm; IR (neat) νmax 3466, 2922, 2853, 1664, 1553, 1457 cm−1; 1H NMR (400 MHz, CDCl3) and 13C NMR (100 MHz, CDCl3) data, see Tables 1 and 2; HRESIMS m/z 393.3013 [M + H]+ (calcd for C24H41O4, 393.3005).
ε) 234 (4.11), 272 (4.27) nm; IR (neat) νmax 3466, 2922, 2853, 1664, 1553, 1457 cm−1; 1H NMR (400 MHz, CDCl3) and 13C NMR (100 MHz, CDCl3) data, see Tables 1 and 2; HRESIMS m/z 393.3013 [M + H]+ (calcd for C24H41O4, 393.3005).
Compound (2): yellowish oil; [α]18.5D −50.7 (c 0.1, CH3OH); UV (CH3OH) λmax (logε) 237 (4.07), 269 (4.34) nm; IR (neat) νmax 3494, 2923, 2854, 1659, 1555, 1452 cm−1; 1H NMR (400 MHz, CDCl3) and 13C NMR (100 MHz, CDCl3) data, see Tables 1 and 2; HRESIMS m/z 393.2988 [M + H]+ (calcd for C24H41O4, 393.3005).
Compound (3): yellowish oil; [α]18.5D −52.1 (c 0.1, CH3OH); UV (CH3OH) λmax (logε) 226 (4.26), 274 (4.14) nm; IR (neat) νmax 3360, 2924, 2853, 1633, 1578, 1445 cm−1; 1H NMR (400 MHz, CDCl3) and 13C NMR (100 MHz, CDCl3) data, see Tables 1 and 2; HRESIMS m/z 439.2124 [M + Na]+ (calcd for C24H32O6Na, 439.2097).
Compound (4): brown oil; [α]20.8D + 122.2 (c 0.1, CH3OH); UV (CH3OH) λmax (logε) 232 (3.97), 273 (4.07) nm; IR (neat) νmax 3433, 2921, 2853, 1725, 1661, 1543, 1462 cm−1; 1H NMR (400 MHz, CDCl3) and 13C NMR (100 MHz, CDCl3) data, see Tables 1 and 2; HRESIMS m/z 409.2947 [M + H]+ (calcd for C24H41O5, 409.2954).
Compound (5): orange oil; UV (CH3OH) λmax (logε) 234 (4.28), 326 (3.58) nm; IR (neat) νmax 3290, 2922, 2853, 1650, 1615, 1467, 1411, 1236 cm−1; 1H NMR (400 MHz, CDCl3) and 13C NMR (100 MHz, CDCl3) data, see Tables 1 and 2; HRESIMS m/z 371.2578 [M + H]+ (calcd for C24H35O3, 371.2586).
Compound (6): yellowish oil; UV (CH3OH) λmax (logε) 224 (3.86), 269 (3.78), 344 (3.19) nm; IR (neat) νmax 3328, 2923, 2853, 1628, 1590, 1509, 1451 cm−1; 1H NMR (400 MHz, CDCl3) and 13C NMR (100 MHz, CDCl3) data, see Tables 1 and 2; HRESIMS m/z 397.2710 [M + Na]+ (calcd for C24H38O3Na, 397.2719).
Cytotoxicity assays
A sulforhodamine B assay was performed as formerly described.20 KKU-M156 and HepG2 cells were placed into 96-well culture plates. The isolated compounds were added into cultured cells and incubated for 24 h. The cytotoxicity was calculated as the percentage absorbance of controls. The IC50 value was calculated by a non-linear curve-fitting program from triplicate assay of three separate experiments.21 The positive control was a cisplatin standard and showed IC50 values of 10.0 ± 4.8 and 2.2 ± 0.7 μM against KKU-M156 and HepG2 cell lines, respectively.ECD calculations
Preliminary conformational analyses were carried out using HyperChem software. These dominant conformers were developed at the B3LYP/6-311g(d,p) basis set by density functional theory.22 The Gaussian 09 program was used to calculate ECD spectra.23 The single point energy calculations were computed using time-dependent density functional theory (TD-DFT)24 at the CAM-B3LYP/6-311++g(d,p) level of theory.25 The bulk solvent effects were examined using the CPCM polarizable conductor calculation model.264. Conclusions
Chemical investigation of the fruits of Knema globularia (Lam.) warb led to the isolation of six new compounds, knecorticosanones C–H (1–6), in addition, three known lignans were also isolated. All isolated polyketides were evaluated for cytotoxicity against HepG2 and KKU-M156 cell lines. Compound 1 exhibited the most cytotoxicity against these two cell lines with IC50 values of 1.57 ± 0.37 and 1.78 ± 0.14 μg mL−1, respectively. Cytotoxicity results of compounds 1 and 2 indicate that the hydroxyl group at the C-6 position are important for the activity.Conflicts of interest
There are no conflicts to declare.Acknowledgements
We thank the Thailand Research Fund and Khon Kaen University (RSA6280050) for financial support. The Post-Doctoral Training Program from the Research Affairs and Graduate School, Khon Kaen University for T. Sribuhom is acknowledged (Grant no. 591471). We are indebted to The Center of Excellence for Innovation in Chemistry, Ministry of Higher Education, Science, Research and Innovation (Implementation Unit, Khon Kaen), Thailand.References
- W. Salleh and F. Ahmad, Pharm. Sci., 2017, 23(4), 249–255 CrossRef.
- T. Smitinand, Thai Plant Names, Bangkok, revised edn, 2001 Search PubMed.
- L. M. Perry and J. Metzger, Medicinal plants of East and Southeast Asia: Attributed properties and uses, Cambridge, 1st edn, 1980 Search PubMed.
- A. Zahir, A. Jossang, B. Bodo, H. A. Hadi, H. Schaller and T. Sevenet, J. Nat. Prod., 1993, 56(9), 1634–1637 CrossRef CAS.
- Vinayachandra and K. R. Chandrashekar, J. Herbs, Spices Med. Plants, 2014, 20(2), 183–195 CrossRef CAS.
- N. Ismail, M. N. Akhtar, M. Ismail, S. Zareen, S. A. A. Shah, N. H. Lajis and S. N. Tajuddin, Nat. Prod. Res., 2015, 29(16), 1571–1574 CrossRef CAS.
- J. Z. Deng, S. R. Starck, S. Li and S. M. Hecht, J. Nat. Prod., 2005, 68(11), 1625–1628 CrossRef CAS.
- U. Sriphana, C. Yenjai and M. Koatthada, Phytochem. Lett., 2016, 16, 129–133 CrossRef CAS.
- T. H. Giap, P. M. Duc, N. V. The, M. Popova, V. Bankova, C. T. Hue, V. T. K. Oanh, N. T. M. Hang, N. V. Hung and N. L. Thanh, Nat. Prod. Res., 2019, 8, 1–10 Search PubMed.
- T. V. Pham, H. K. T. Bach, D. V. Ho and B. C. Nguyen, Nat. Prod. Res., 2020, 1–7, DOI:10.1080/14786419.2020.1777416.
- F. M. Jaafar, M. J. M. Ridhwan, N. M. A. Mustapha, A. Alias and N. H. Ismail, Journal Teknologi (Science & engineering), 2016, 78(5–3), 103–108 Search PubMed.
- N. Rangkaew, R. Suttisri, M. Moriyasu and K. Kawanishi, Fitoterapia, 2009, 80(6), 377–379 CrossRef CAS.
- C. Wiart, Medicinal plants of Asia and the Pacific, Boca Raton, 2006 Search PubMed.
- M. Wenli, Y. Yong, N. Wei and C. Changxiang, Acta Bot. Yunnanica, 2000, 22, 358–360 Search PubMed.
- U. Sriphana, C. Yenjai, J. Suthiwong and K. Poopasit, Nat. Prod. Res., 2020, 1–8, DOI:10.1080/14786419.2020.1815736.
- G. B. Messiano, L. Vieira, M. B. Machado, L. M. X. Lopes, S. A. D. Bortoli and J. Zukerman-Schpector, J. Agric. Food Chem., 2008, 56, 2655–2659 CrossRef CAS.
- D. Pascoli, C. Inara, N. R. Isabele and L. M. X. Lucia, Phytochemistry, 2006, 67(7), 735–742 CrossRef.
- A. O. Pereira, J. M. Avilab, G. D. Carmob, F. S. Siqueirac, M. M. A. Camposc, D. F. Backb, A. F. Morelb and I. I. Dalcola, Ind. Crops Prod., 2018, 121, 461–467 CrossRef CAS.
- E. A. Ferreira, J. B. Reigada, M. V. Correia, M. C. M. Young, E. F. Guimarães, G. C. Franchi Jr, A. E. Nowill, J. H. G. Lago, L. F. Yamaguchi and M. J. Kato, J. Nat. Prod., 2014, 77, 1377–1382 CrossRef CAS.
- T. Sribuhom, Y. Thummanant, S. Phusrisom, V. Kukongviriyapan, S. Tontapha, V. Amornkitbamrung and C. Yenjai, J. Nat. Prod., 2019, 82, 2246–2251 CrossRef CAS.
- P. Samatiwat, A. Prawan, L. Senggunprai, U. Kukongviriyapan and V. Kukongviriyapan, Tumor Biol., 2016, 37, 11495–11507 CrossRef CAS.
- R. G. Parr and W. Yang, Density Functional Theory of Atoms and Molecules, Oxford University Press, Oxford, UK, 1989 Search PubMed.
- M. J. Frisch, G. W. Trucks, H. B. Schlegel, G. E. Scuseria, M. A. Robb, et al., Gaussian 09, Revision B.01, Gaussian, Inc., Wallingford, CT, 2010 Search PubMed.
- G. Pescitelli and T. Bruhn, Chirality, 2016, 28, 466–474 CrossRef CAS.
- T. Yanai, D. P. Tew and N. C. Handy, Chem. Phys. Lett., 2004, 393, 51–57 CrossRef CAS.
- A. Mándi, I. W. Mudianta, T. Kurtán and M. J. Garson, J. Nat. Prod., 2015, 78, 2051–2056 CrossRef.
Footnote |
| † Electronic supplementary information (ESI) available. See DOI: 10.1039/d0ra10498a |
| This journal is © The Royal Society of Chemistry 2021 |