 Open Access Article
A bio-analytically validated HPLC-UV method for simultaneous determination of doripenem and ertapenem in pharmaceutical dosage forms and human plasma: a dual carbapenem regimen for treatment of drug-resistant strain of Klebsiella pneumoniae
Marwa F. B.
Ali
 a,
Mostafa A.
Marzouq
b,
Samiha A.
Hussein
a and
Baher I.
Salman
 *b
*b
aPharmaceutical Analytical Chemistry Department, Faculty of Pharmacy, Assiut University, Assiut, 71526, Egypt
bPharmaceutical Analytical Chemistry Department, Faculty of Pharmacy, Al-Azhar University, Assiut Branch, Assiut, 71524, Egypt. E-mail: bahersalman2013@yahoo.com; bahersalman@azhar.edu.eg; Tel: +20 1099031345
First published on 14th January 2021
Abstract
The emergence of strains resistant to certain antibiotics is turning into an important issue worldwide that threatens global health with the increasing incidence of carbapenemase-producing Klebsiella pneumoniae (KPC). Thus, successful doripenem–ertapenem (DOR–ERTA) combination is highly recommended in treatment of bacteremic ventilator-associated pneumonia due to Klebsiella pneumoniae. Hence, a fast and highly-sensitive HPLC-UV method was developed for the estimation of the cited drugs simultaneously in their pure form, pharmaceutical dosage forms and in simulated synthetic mixtures. The DOR–ERTA mixture was successfully separated within 6 min on a reversed-phase ODS column using an isocratic elution; a mobile phase mixture consists of 0.05 M phosphate buffer (pH 3.0 adjusted by 85% ortho-phosphoric acid)![[thin space (1/6-em)]](https://www.rsc.org/images/entities/char_2009.gif) :
:![[thin space (1/6-em)]](https://www.rsc.org/images/entities/char_2009.gif) acetonitrile
acetonitrile![[thin space (1/6-em)]](https://www.rsc.org/images/entities/char_2009.gif) :
:![[thin space (1/6-em)]](https://www.rsc.org/images/entities/char_2009.gif) methanol (86
methanol (86![[thin space (1/6-em)]](https://www.rsc.org/images/entities/char_2009.gif) :
:![[thin space (1/6-em)]](https://www.rsc.org/images/entities/char_2009.gif) 12
12![[thin space (1/6-em)]](https://www.rsc.org/images/entities/char_2009.gif) :
:![[thin space (1/6-em)]](https://www.rsc.org/images/entities/char_2009.gif) 2; % v/v/v). The proposed method was optimized and validated according to ICH guidelines, where the calibration graph was constructed from 0.04 to 50 μg mL−1 and from 0.05 to 50 μg mL−1 with low detection limits reached 1.7 and 1.4 ng mL−1 for DOR and ERTA respectively. The proposed method showed higher sensitivity than several previous methods, which allowed an effective estimation of the DOR and ERTA in human plasma after a simple extraction method with high recovery results ranged from 96.30% ± 1.55 to 97.90% ± 1.45 and without any interference from plasma components.
2; % v/v/v). The proposed method was optimized and validated according to ICH guidelines, where the calibration graph was constructed from 0.04 to 50 μg mL−1 and from 0.05 to 50 μg mL−1 with low detection limits reached 1.7 and 1.4 ng mL−1 for DOR and ERTA respectively. The proposed method showed higher sensitivity than several previous methods, which allowed an effective estimation of the DOR and ERTA in human plasma after a simple extraction method with high recovery results ranged from 96.30% ± 1.55 to 97.90% ± 1.45 and without any interference from plasma components.
1. Introduction
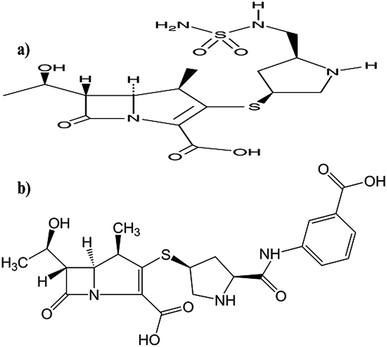
Doripenem (DOR, Fig. 1a) and ertapenem (ERTA, Fig. 1b) are β-lactam antibiotics which belong to carbapenem subclass. The cited drugs inhibit bacterial cell wall synthesis by inactivating essential penicillin-binding proteins (PBPs) which ultimately causes cell death. Carbapenem antibiotics play an extremely important role in the treatment of severe infections such as pneumonia and urinary tract infections.1 However, with the extensive application of carbapenem antibiotics, carbapenemases have been increasingly found in Gram-negative bacteria. Carbapenemases accompanied with drug resistance will limit the use of carbapenem antibiotics and consequently threat the global health. From these Gram-negative bacteria, Klebsiella pneumoniae, one of the most common and severe pathogen. Carbapenem-resistant Klebsiella pneumonaiae strains have caused numerous outbreaks of hospital infections in many countries and become a serious clinical issue.2–6 Double-carbapenem therapy (DCT) is highly recommended and its clinical effectiveness is attributed to the inactivation of carbapenemases by one carbapenem mainly ERTA. Hence, DOR is recommended to be co-administrated with ERTA as a dual-carbapenem therapy against carbapenemase-producing Klebsiella pneumoniae (KPC).3–6The synergistic activity and enhanced efficacy of the combination between the studied drugs in the treatment of pneumonia attributed to KPC strains is attributed to the interaction between ERTA and carbapenemase enzyme itself.2–6 As previously reported, utilization of the recommended carbapenem mixture treatment against KPC strains led to an enhancement in the antibacterial activity in vitro and in vivo.2–7
Based on our survey, many analytical methods have been reported for analysis of DOR and ERTA such as spectrophotometric,8–11 spectrofluorimetric,12–14 HPLC,15–18 HPTLC19 and electrochemical20 methods.
High performance liquid chromatography (HPLC) technique considers the most suitable and highly sensitive analytical method for separation of various pharmaceutical drugs.21,22 Hence, the introduced work was designed to provide simple, low cost and highly sensitive HPLC-UV method for simultaneous determination of DOR and ERTA in their pure form, pharmaceutical products and simulated synthetic mixture. The presented work showed higher sensitivity when compared with previous reported methods.12,22 Moreover, the presented method considered selective when compared with other spectrometric8–13 methods. In addition, the proposed HPLC-UV method is rapid and don't consume long analysis time when compared with other methods.15–18,22
The pharmacokinetic parameters of the cited drugs were reported, where the maximum concentration of DOR (Cmax) was observed to be 32.03 ± 2.32 μg mL−1 with t1/2 1.12 h.13,14 On the other hand, the pharmacokinetic parameters of ERTA were found to be 56 and 150 μg mL−1 for subcutaneous and intravenous respectively.23
The presented method was utilized for bio-analytical validation study and applied for estimation of DOR and ERTA in human plasma after simple extraction method. The method showed high sensitivity and selectivity and considered suitable to be used in quality control and clinical laboratories.
2. Materials and methods
2.1. Instrumentation
All chromatographic separations were performed on Waters 717, plus autosampler with sample thermostat which contains Alltech, 426 LC pump, and UV/VIS (Waters Millipore, USA).The separation was achieved using on reversed-phase ODS column (25 cm × 4.6 mm id, 5 μm particle size) from GL Science (Japan). The mobile phase composed of a mixture of 0.05 M phosphate buffer (pH 3.0), acetonitrile and methanol (86![[thin space (1/6-em)]](https://www.rsc.org/images/entities/char_2009.gif) :
:![[thin space (1/6-em)]](https://www.rsc.org/images/entities/char_2009.gif) 12
12![[thin space (1/6-em)]](https://www.rsc.org/images/entities/char_2009.gif) :
:![[thin space (1/6-em)]](https://www.rsc.org/images/entities/char_2009.gif) 2% v/v/v). The flow rate was adjusted at 0.7 mL min−1 and UV detector was set at 298 nm. For data interpretation, Kromex (Estonia) software chromatography was used. UV-1601 A Shimadzu spectrophotometer (Tokyo, Japan) with a 2 cm quartz cell was used for obtaining UV spectra of the studied drugs.
2% v/v/v). The flow rate was adjusted at 0.7 mL min−1 and UV detector was set at 298 nm. For data interpretation, Kromex (Estonia) software chromatography was used. UV-1601 A Shimadzu spectrophotometer (Tokyo, Japan) with a 2 cm quartz cell was used for obtaining UV spectra of the studied drugs.
2.2. Chemical and reagents
Doripenem (DOR, purity 99.9%) was obtained from Janssen-Cilag CO., Egypt. Ertapenem (ERTA, purity 99.7%) was obtained from Merck Rahway, USA.Doripax® 500 mg and Invanz® 1 g vials were obtained from the local market of Egypt. Sodium phosphate, acetonitrile (ACN), methanol, 85% orthophosphoric acid were obtained from EL-Nasr Company, Egypt. All the solvents used in chromatographic separation were of HPLC grade.
2.3. Preparation of standard solutions for HPLC analysis
A stock solution of DOR and ERTA (1 mg mL−1 for each) were prepared by transferring 25 mg of each drug into 25 mL calibrated flask and dissolving with ultra-pure water. To obtain the working solution of the studied drugs the stock solutions were diluted using the mobile phase 0.05 M phosphate buffer (pH 3.0 with 85% ortho-phosphoric acid)![[thin space (1/6-em)]](https://www.rsc.org/images/entities/char_2009.gif) :
:![[thin space (1/6-em)]](https://www.rsc.org/images/entities/char_2009.gif) acetonitrile
acetonitrile![[thin space (1/6-em)]](https://www.rsc.org/images/entities/char_2009.gif) :
:![[thin space (1/6-em)]](https://www.rsc.org/images/entities/char_2009.gif) methanol (86
methanol (86![[thin space (1/6-em)]](https://www.rsc.org/images/entities/char_2009.gif) :
:![[thin space (1/6-em)]](https://www.rsc.org/images/entities/char_2009.gif) 12
12![[thin space (1/6-em)]](https://www.rsc.org/images/entities/char_2009.gif) :
:![[thin space (1/6-em)]](https://www.rsc.org/images/entities/char_2009.gif) 2, v/v/v) to obtain the required concentrations.
2, v/v/v) to obtain the required concentrations.
2.4. Chromatographic procedure
Twenty microliters of the working solution for DOR and ERTA in the concentration range (0.04–50 μg mL−1) and (0.05–50 μg mL−1) for DOR and ERTA respectively were injected into the HPLC-UV system after filtration through 0.45 μm cellulose acetate membrane filter. The chromatographic separation was carried out using ODS column (250 mm × 4.6 mm) with an isocratic elution. The mobile phase consists of a mixture consists of 0.05 M phosphate buffer (pH 3.0 with 85% ortho-phosphoric acid)![[thin space (1/6-em)]](https://www.rsc.org/images/entities/char_2009.gif) :
:![[thin space (1/6-em)]](https://www.rsc.org/images/entities/char_2009.gif) ACN
ACN![[thin space (1/6-em)]](https://www.rsc.org/images/entities/char_2009.gif) :
:![[thin space (1/6-em)]](https://www.rsc.org/images/entities/char_2009.gif) methanol (86
methanol (86![[thin space (1/6-em)]](https://www.rsc.org/images/entities/char_2009.gif) :
:![[thin space (1/6-em)]](https://www.rsc.org/images/entities/char_2009.gif) 12
12![[thin space (1/6-em)]](https://www.rsc.org/images/entities/char_2009.gif) :
:![[thin space (1/6-em)]](https://www.rsc.org/images/entities/char_2009.gif) 2, v/v/v), with flow rate set at 0.7 mL min−1 using UV detector set at 298 nm.
2, v/v/v), with flow rate set at 0.7 mL min−1 using UV detector set at 298 nm.
2.5. System suitability parameters
Various system suitability parameters as retention time (tR), number of theoretical plates (N), resolution (Rs), capacity factor (k′) and separation factor (α) were studied to check the system performance and the method repeatability using DOR and ERTA (30 μg mL−1 each). All the parameters of chromatographic system were calculated using different equations| k′ = (tR − t0)/t0 |
The separation factor was calculated using  .
.
Moreover, chromatographic peak resolution is given by
2.6. Application of the proposed HPLC-UV method
This study was conducted in accordance with the Declaration of Helsinki and approved by the Egyptian Network of Research Ethics Committees (ENREC) and informed consent was obtained for any experiments with human volunteers.
3. Results and discussion
The increased rate of mortality and long durations of hospitalization due to bacterial resistance is considered a global issue. Carbapenem-resistant Klebsiella pneumonaiae strains have caused numerous outbreaks of hospital infections in many countries and become a serious clinical issue.2–6 The resistance of these Klebsiella to the current antimicrobials, resulted in thinking of a combination therapy of two or three antimicrobial drugs. Based on previous studies, DOR–ERTA combination therapy showed a great effectiveness in treatment of pneumonia attributed to these KPC strains.2–7Hence, the presented method was designed to develop a fast, simple and highly sensitive HPLC-UV approach for simultaneous estimation of DOR and ERTA in their pure form, pharmaceutical vials, synthetic mixture and in human plasma. The synergistic effect of this dual-carbapenem regimen is highly recommended for certain medical cases in order to reduce the time of treatment.
The simultaneous separation of the investigated dual-regimen was achieved using a reversed-phase ODS column. The mobile phase was composed of a mixture of 0.05 M phosphate buffer (pH 3.0 with 85% ortho-phosphoric acid), acetonitrile and methanol (86![[thin space (1/6-em)]](https://www.rsc.org/images/entities/char_2009.gif) :
:![[thin space (1/6-em)]](https://www.rsc.org/images/entities/char_2009.gif) 12
12![[thin space (1/6-em)]](https://www.rsc.org/images/entities/char_2009.gif) :
:![[thin space (1/6-em)]](https://www.rsc.org/images/entities/char_2009.gif) 2% v
2% v![[thin space (1/6-em)]](https://www.rsc.org/images/entities/char_2009.gif) :
:![[thin space (1/6-em)]](https://www.rsc.org/images/entities/char_2009.gif) v
v![[thin space (1/6-em)]](https://www.rsc.org/images/entities/char_2009.gif) :
:![[thin space (1/6-em)]](https://www.rsc.org/images/entities/char_2009.gif) v). The flow rate adjusted at 0.7 mL min−1, and UV detection was set at 298 nm.
v). The flow rate adjusted at 0.7 mL min−1, and UV detection was set at 298 nm.
3.1. Optimization of different chromatographic conditions
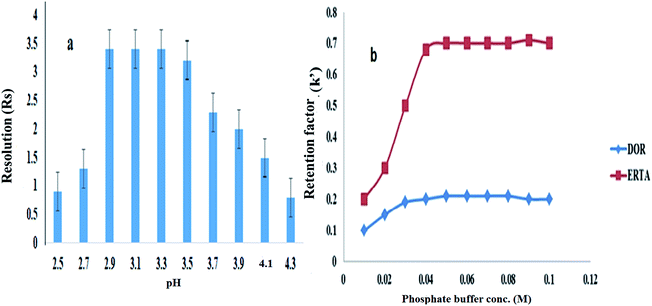
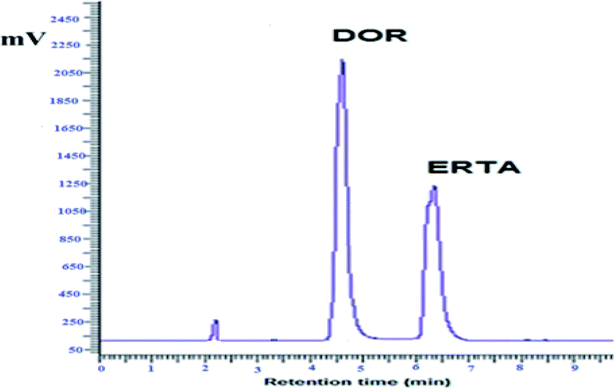
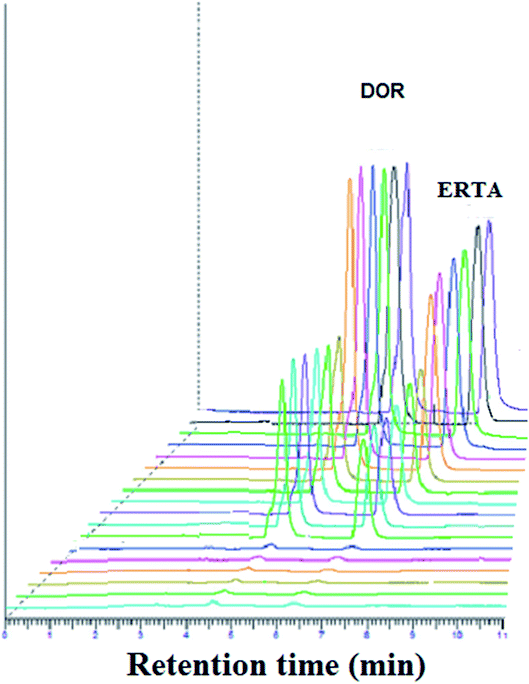
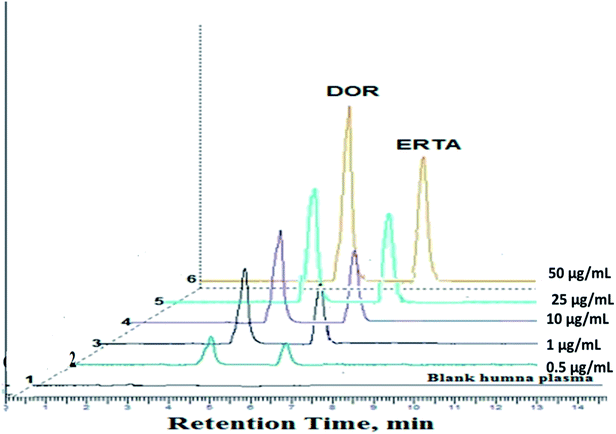
For achievement of good resolution within short analysis time and to obtain symmetric peaks of the studied drugs, various chromatographic conditions were investigated.As represented in Fig. 3, the investigated drugs were completely separated under the optimum chromatographic conditions without any interference or overlapping, DOR was detected at 4.7 min while ERTA was at 6.3 min. The time required for separation of DOR and ERTA was less than 7 min, hence the developed method considered a fast one when compared with various analytical methods used previously for determination of the cited drugs.10–12,15
3.2. System suitability parameters
Different system suitability parameters such as retention time (tR), capacity factor (k′), separation factor (α), resolution (Rs), number of theoretical plates (N) and height equivalent to theoretical plates (HETP) were studied to check the system performance and the method repeatability for separation of DOR and ERTA (30 μg mL−1 each). The results obtained using six replicate samples under the optimal chromatographic conditions as summarized in Table 1. The summarized results refer to good separation between the cited drugs; where DOR and ERTA were detected at 4.7 and 6.3 min respectively. The capacity factor (K′) was found to be 0.9 and 1.8 for DOR and ERTA respectively. Moreover, chromatographic peak resolution was calculated and it was found to be 3.4 ± 0.5 which ensures good separation between the studied drugs.| Parameters | DOR | ERTA |
|---|---|---|
| a The bold data are the standard deviation of three injections. | ||
| Retention time (min), tR | 4.7 ± 0.11 | 6.3 ± 0.20 |
| Void time (min) | 2.2 | 2.2 |
| Adjusted retention time (min), tR− | 2.5 | 4.1 |
| Capacity factor, K′ | 1.14 | 1.86 |
| Separation factor, α | 1.63 ± 0.2 | |
| Resolution, Rs | 3.4 ± 0.5 | |
| Column characters | 250 mm × 4.6 mm id, 5 μm particle size | |
| Number of theoretical plates (N, plates) | 3155 ± 1.16 | 4211 ± 1.16 |
| Height equivalent theoretical plate (HETP, cm per plate) | 0.079 | 0.059 |
3.3. Validation of the developed HPLC-UV method
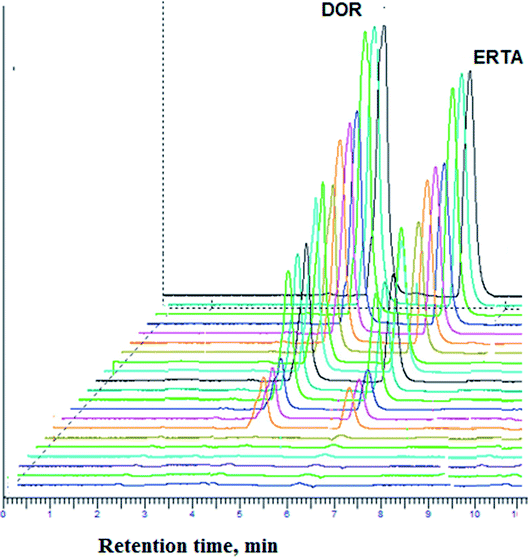
Linearity range of the method was obtained by plotting the peak area of the standard solutions of the studied drugs against their corresponding concentration range (0.04–50.0 μg mL−1) and (0.05–50.0 μg mL−1) for DOR and ERTA respectively, Fig. 4 represented chromatograms of the studied drugs in different concentrations (0.1, 0.5, 10.0, 25.0, 40.0 μg mL−1) within calibration range.
The limit of detection (LOD) was expressed as 3.3σ/S while limit of quantitation (LOQ) was expressed as 10σ/S, where (σ) is the standard deviation of intercept and (S) is the slope of calibration curve. It was observed that LOD values were found to be 1.7 and 1.4 ng mL−1, while LOQ values were found to be 5.0 and 4.2 ng mL−1 for DOR and ERTA respectively. The proposed method showed higher sensitivity over several previous methods.10–12 The ultra-sensitivity of the developed HPLC-UV method ensures its ability for trace monitoring of the studied drugs in biological samples. All statistical parameters were summarized in Table 2.
| Parameters | HPLC method | |
|---|---|---|
| DOR | ERTA | |
| a The data expressed are the mean of six replicates. | ||
| Mobile phase system | Phosphate buffer (pH = 3.0)![[thin space (1/6-em)]](https://www.rsc.org/images/entities/char_2009.gif) : :![[thin space (1/6-em)]](https://www.rsc.org/images/entities/char_2009.gif) ACN ACN![[thin space (1/6-em)]](https://www.rsc.org/images/entities/char_2009.gif) : :![[thin space (1/6-em)]](https://www.rsc.org/images/entities/char_2009.gif) methanol (86/12/2; v/v/v) methanol (86/12/2; v/v/v) |
|
| Wavelength (nm) | 298 | 298 |
| Flow rate (mL min−1) | 0.7 | 0.7 |
| Linearity range (μg mL−1) | 0.04–50.0 | 0.05–50.0 |
| Correlation coefficient (r) | 0.9998 | 0.9996 |
| Determination coefficient (r2) | 0.9997 | 0.9994 |
| Intercept ± SD | 8298 ± 33.56 | 68![[thin space (1/6-em)]](https://www.rsc.org/images/entities/char_2009.gif) 350 ± 20.22 350 ± 20.22 |
| Slope ± SD | 67 × 103 ± 2291.12 | 48 × 103 ± 1201.10 |
| LOD (ng mL−1) | 1.7 | 1.4 |
| LOQ (ng mL−1) | 5.0 | 4.2 |
| Sample no. | DOR | ERTA | ||||
|---|---|---|---|---|---|---|
| Taken (μg mL−1) | % Recovery* | % RSD | Taken (μg mL−1) | % Recovery* | % RSD | |
| a *: average of three determinations. RSD: relative standard deviation. | ||||||
| 1 | 0.5 | 99.57 | 0.49 | 0.5 | 100.02 | 1.20 |
| 2 | 25.0 | 101.32 | 0.63 | 25.0 | 100.70 | 1.51 |
| 3 | 40.0 | 100.94 | 1.41 | 40.0 | 101.05 | 0.87 |
On the other hand, the intra-day and inter-day precision study was performed using three concentrations 0.5, 25.0 and 40.0 μg mL−1. In case of the inter-day precision study, the analysis was repeated for three successive days. It was observed that the recovery results were ranged from 99.57 to 101.32% with % RSD values not exceeding 1.51.
| Parameters | DOR | ERTA |
|---|---|---|
| % Recovery ± SDa | % Recovery ± SDa | |
| a Average of three determinations. | ||
| No variations | 101.20 ± 0.34 | 101.07 ± 0.65 |
![[thin space (1/6-em)]](https://www.rsc.org/images/entities/char_2009.gif) |
||
| Mobile phase | ||
| 84/14/2 v/v/v | 99.04 ± 0.81 | 98.90 ± 0.39 |
| 88/10/2 v/v/v | 97.43 ± 0.65 | 98.61 ± 1.01 |
![[thin space (1/6-em)]](https://www.rsc.org/images/entities/char_2009.gif) |
||
| Wavelength (nm) | ||
| 296 | 99.65 ± 0.72 | 97.99 ± 0.90 |
| 300 | 98.51 ± 1.02 | 98.80 ± 0.73 |
![[thin space (1/6-em)]](https://www.rsc.org/images/entities/char_2009.gif) |
||
| Flow rate (mL min −1 ) | ||
| 0.6 | 98.11 ± 0.68 | 99.01 ± 0.94 |
| 0.8 | 97.90 ± 0.85 | 98.04 ± 0.53 |
![[thin space (1/6-em)]](https://www.rsc.org/images/entities/char_2009.gif) |
||
| Phosphate buffer pH | ||
| 2.9 | 99.48 ± 1.50 | 98.55 ± 0.85 |
| 3.1 | 99.30 ± 0.73 | 98.29 ± 1.21 |
![[thin space (1/6-em)]](https://www.rsc.org/images/entities/char_2009.gif) |
||
| Phosphate buffer conc. (M) | ||
| 0.04 | 99.80 ± 1.22 | 98.93 ± 0.43 |
| 0.06 | 99.88 ± 0.55 | 99.30 ± 0.32 |
3.4. Validation of the proposed method in human plasma
| Taken (μg mL−1) | Intra-day assay (n = 6) | Inter-day assay (n = 9) | ||
|---|---|---|---|---|
| Accuracy (% recovery) | Precision (% RSD) | Accuracy (% recovery) | Precision (% RSD) | |
| DOR | ||||
| 0.04 | 97.16 | 1.33 | 97.01 | 1.88 |
| 25 | 97.01 | 2.02 | 97.00 | 1.87 |
| 50 | 98.92 | 1.90 | 98.30 | 1.86 |
![[thin space (1/6-em)]](https://www.rsc.org/images/entities/char_2009.gif) |
||||
| ERTA | ||||
| 0.05 | 97.55 | 2.00 | 97.12 | 2.31 |
| 25 | 98.30 | 1.60 | 97.94 | 2.08 |
| 50 | 97.53 | 2.11 | 97.33 | 1.74 |
3.5. Applications of the proposed HPLC-UV method
| Dosage form | % Recovery ± SDa | t-Valuec | F-Valuec | |
|---|---|---|---|---|
| Proposed method | Reported methodb | |||
| a Mean of five determinations. b The reported methods ref. 9 and 18. c The tabulated t- and F-values at 95% confidence limit are 2.78 and 6.39, respectively. | ||||
| Doribax® (500 mg DOR/vial) | 101.77 ± 1.05 | 100.04 ± 1.80 | 1.52 | 2.90 |
| Invanz® (1 g ERTA/vial) | 101.52 ± 1.11 | 100.21 ± 1.54 | 1.50 | 3.01 |
4. Conclusion
Many combination therapies have shown better survival and mortality reduction for patients suffering from a drug-resistant strain of Klebsiella pneumoniae compared with monotherapy regimens. The dual-carbapenem based combination regimen exert good synergistic results and low resistance. Hence, a fast, sensitive and low-cost LC/UV approach was created for simultaneous investigation of DOR and ERTA in pure forms and pharmaceutical vials. The method was validated according to ICH guidelines under optimum chromatographic conditions, and good linearity was obtained in the range from 0.04 to 50.0 μg mL−1 and from 0.05 to 50.0 μg mL−1 with low detection limits reached 1.7 and 1.4 ng mL−1 for DOR and ERTA. The high efficiency of the developed method permits the determination of DOR in human plasma simultaneously with ERTA without matrix interference. The method was utilized to estimate DOR and ERTA in human plasma after a simple extraction method. The method is highly recommended to monitor DOR and ERTA in quality control and clinical laboratories.Conflicts of interest
There are no conflicts to declare.References
- S. C. Sweetman, Martindale: the complete drug reference, Royal Pharmaceutical Society of Great Britain, Pharmaceutical Press, London, 40th edn, 2020 Search PubMed.
- G. De Pascale, G. Martucci, L. Montini, G. Panarello, S. L. Cutuli, D. Di Carlo, V. Di Gravio, R. Di Stefano, G. Capitanio, M. S. Vallecoccia, P. Polidori, T. Spanu, A. Arcadipane and M. Antonelli, Crit. Care, 2017, 21, 173, DOI:10.1186/s13054-017-1769-z.
- O. Mashni, L. Nazer and J. Le, Ann. Pharmacother., 2018, 1–12, DOI:10.1177/10600280187905.
- A. Oliva, F. Gizzi, M. T. Mascellino, A. Cipolla, A. D'Abramo, C. D'Agostino, V. Trinchieri, G. Russo, F. Tierno, M. Iannetta, C. M. Mastroianni and V. Vullo, Clin. Microbiol. Infect., 2015, 22, 147–153 CrossRef PubMed.
- Y. Li, J. Wang, R. Wang and Y. Cai, BMC Infect. Dis., 2020, 20, 408, DOI:10.1186/s12879-020-05133-0.
- G. Ceccarelli, M. Falcone, A. Giordano, M. L. Mezzatesta, C. Caio, S. Stefani and M. Venditti, Antimicrob. Agents Chemother., 2013, 57, 2900–2901, DOI:10.1128/AAC.00188-13.
- H. Giamarellou, L. Galani, F. Baziaka and I. Karaiskos, Antimicrob. Agents Chemother., 2013, 57, 2388–2390, DOI:10.1128/AAC.02399-12.
- J. C. Piontek and A. Jelinska, Spectrochim. Acta, Part A, 2010, 77, 554–557, DOI:10.1016/j.saa.2010.06.019.
- K. R. Babu and N. A. Kumari, Pharma Chem., 2013, 5, 312–316 Search PubMed.
- K. R. Babu, N. A. Kumari and R. Vijaya Lakshmi, Int. J. Pharm. Sci. Drug Res., 2013, 5, 184–186 Search PubMed.
- A. M. Homoda, M. S. Kamel and E. Khaled, J. Taibah Univ. Sci., 2016, 10, 19–52, DOI:10.1016/j.jtusci.2015.03.005.
- E. S. Elzanfaly, R. M. Youssif, N. N. Salama, A. S. Fayed, H. A. M. Hendawy and M. Y. Salem, Luminescence, 2017, 32, 1517–1527, DOI:10.1002/bio.3353.
- B. I. Salman, S. A. Hussein, M. F. B. Ali and M. A. Marzouq, Microchem. J., 2019, 145, 959–965, DOI:10.1016/j.microc.2018.12.018.
- M. F. B. Ali, B. I. Salman, S. A. Hussein and M. A. Marzouq, RSC Adv., 2020, 10, 44058–44065, 10.1039/d0ra07960j.
- D. G. Musson, K. L. Birk, A. M. Cairns, A. K. Majumdar and J. D. Rogers, J. Chromatogr. B: Biomed. Sci. Appl., 1998, 720, 99–106, DOI:10.1016/S0378-4347(98)00437-X.
- P. Jayasekhar and J. Kurien, Int. J. Pharm. Sci. Rev. Res., 2013, 22, 41–45 Search PubMed.
- K. Ikeda, K. Ikawa, N. Morikawa, K. Kameda, N. Urakawa, H. Ohge and T. Sueda, J. Chromatogr. B: Anal. Technol. Biomed. Life Sci., 2008, 867, 20–25, DOI:10.1016/j.jchromb.2008.03.001.
- T. Legrand, S. Chhun, E. Rey, B. Blanchet, J. R. Zahar, F. Lanternier, G. Pons and V. Jullien, J. Chromatogr. B: Anal. Technol. Biomed. Life Sci., 2008, 875, 551–556, DOI:10.1016/j.jchromb.2008.09.020.
- J. Kurien, P. Jayasekhar and J. John, Int. J. Pharm. Sci. Rev. Res., 2014, 27, 317–321 CAS.
- N. H. Al-Shaalan, Am. J. Pharmacol. Toxicol., 2012, 7, 1–7 CrossRef CAS.
- A. Dogan and M. Tobiszewski, Microchem. J., 2020, 152, 104323, DOI:10.1016/j.microc.2019.104323.
- E. Dailly, R. Bouquié, G. Deslandes, P. Jolliet and R. Le Floch, J. Chromatogr. B: Anal. Technol. Biomed. Life Sci., 2011, 879, 1137–1142, DOI:10.1016/j.jchromb.2011.03.038.
- D. Frasca, S. Marchand, F. Petitpas, C. Dahyot-Fizelier, W. Couet and O. Mimoz, Antimicrob. Agents Chemother., 2010, 54, 924–926, DOI:10.1128/AAC.00836-09.
- International Conference on Harmonization, Topic Q2 (R1) Validation of Analytical Procedures: Text and Methodology, 2005 Search PubMed.
- D. Zimmer, Bioanalysis, 2014, 6, 13–19, DOI:10.4155/bio.13.298.
| This journal is © The Royal Society of Chemistry 2021 |

