DOI:
10.1039/D0RA10408F
(Paper)
RSC Adv., 2021,
11, 10747-10752
First-principles thermal transport in amorphous Ge2Sb2Te5 at the nanoscale†
Received
10th December 2020
, Accepted 1st March 2021
First published on 12th March 2021
Abstract
Achieving a precise understanding of nanoscale thermal transport in phase change materials (PCMs), such as Ge2Sb2Te5 (GST), is the key of thermal management in nanoelectronics, photonic and neuromorphic applications using non-volatile memories. By resorting to a first-principles approach to calculate the thermal conductivity of amorphous GST, we found that size effects and heat transport via propagative modes persist well beyond extended range order distances typical of disordered network-forming materials. Values obtained are in quantitative agreement with the experimental data, by revealing a strong size dependence of the thermal conductivity down to the 1.7–10 nm range, fully covering the scale of current PCMs-based devices. In particular, a reduction of thermal conductivity as large as 75% occurs for dimensions lying below 2 nm. These results provide a quantitative description of the thermal properties of amorphous GST at the nanoscale and are expected to underpin the development of PCM-based device applications.
1 Introduction
Computing with non-volatile memories (in-memory computing) is an efficient approach to reduce data transfer and optimize energy consumption within artificial intelligence schemes.1 To this purpose, the technology based on phase-change materials (PCMs) proved worth pursuing.2 PCMs are crucial for the development of emerging photonic and neuromorphic applications, ranging from non-volatile memory to optoelectronic systems suitable for nanophotonic devices and neuro-inspired computing.3,4 Thermal management of PCMs enables the optimization of the supplied energy needed to switch between crystalline and amorphous states. At the memory cell level, low power operation calls for minimization of the current required to promote phase change (SET/RESET) via a comprehensive thermal design involving both structural organizations of a PCM. However, despite the considerable gain in knowledge of thermal transport in crystals, transport modes and size effects in disordered materials have escaped a quantitative assessment. To date, amorphous silicon is the only disordered material for which a reduction of thermal conductivity at short scale has been reported experimentally.5 On the theoretical side, it appears that a depletion of thermal conductivity down to reduced dimensions could also occur in disordered chalcogenides.6,7 Yet, it has to be established whether or not this behavior is general and holds for materials characterized by reversible structural changes between ordered and disordered phases. Indeed, in the case of amorphous GeTe, the thermal conductivity calculated for a 8 nm-thick film8 is very close to the bulk value.9 These results were obtained within a description of the interatomic forces based on the neural-network extrapolation of density functional data. Interest in the ternary compound Ge2Sb2Te5 (GST), a chalcogenide featuring prototypical properties for phase-change memories, is due to its high recrystallization speed as well as melting and glass transition points compatible with high data retention.10–12 Thermal optimization of phase-change memories relies on the impact of nanoscale dimensions on the thermal conductivity κ. At the nanometer scale, a reduction of κ affects the operating of devices by slowing down heating and phase switching, with a direct consequence on the temporal response and energy consumption. This specific physical behavior requires reliable theoretical tools allowing for a quantitative description of thermal transport. On the side of chemical properties, it is of paramount importance to rely on predictive models providing indications on the nature of the interatomic interactions for disordered phase change materials in the nanoscale regime. This stems from the discovery of a new class of chemical bonding in ordered phases of PCMs, intermediate between covalent and metallic and termed “metavalent” since featuring some very peculiar electronic delocalization properties escaping any standard classification.13–15 The question arises on the validity of such arguments for the disordered state of PCMs from the bulk down to the nanoscale. So far, no quantitative models are available to address this issue, thereby limiting the application of this new bonding terminology to describe the chemical properties of solids, regardless of their intrinsic structural order or spatial extension.
In the present work, we study the thermal conductivity of amorphous Ge2Sb2Te5 (GST), investigate its dependence on size and quantify the short scale effects. We demonstrate that a sizeable reduction of thermal conductivity can arise in PCMs at small sizes. To this end, we have resorted to first-principles molecular dynamics (FPMD) to generate the disordered structure and to the approach-to-equilibrium molecular dynamics (AEMD) strategy16 to determine the thermal conductivity. Our methodology and the atomic models are given in Section 2. The structural properties are presented in Section 3 and the thermal transport is studied in Section 4. The results are discussed in Section 5 before a final Section 6 devoted to the conclusions.
2 Methodology
2.1 Computational framework
We adopted the Car–Parrinello17 framework as implemented in the CPMD code.18 For the exchange–correlation part of the Kohn–Sham energy expression within density functional theory (DFT), we selected the exchange functional of Becke19 and the correlation part of Lee, Yang and Parr20 (BLYP). We described the valence–core interaction by norm-conserving pseudopotentials as prescribed by Troullier and Martins.21 Valence electrons are represented by a plane-wave basis set with a cutoff of 30 Ry, and expanded at the Γ point only. The fictitious electron mass was set to 500 a.u. and the time step to 5 a.u. to achieve optimal conservation of the constants of motion. The ionic temperature was controlled with a Nosé–Hoover22–24 thermostat chain.25 In ref. 26 we pointed out that modelling glassy GST in the framework of FPMD requires the careful selection of the angular momentum components inherent in the Kleinman–Bylander construction of the pseudopotential,27 resulting in a very high sensitivity to the underlying electronic structure. This underscores the importance of studying chemical bonding of GST by critically comparing the performances of key features within DFT such us pseudopotentials and exchange–correlation functionals. Overall, our model of glassy GST stands out as a reference in terms of predictive power and reliable description of structural properties.
2.2 Atomic models
In ref. 26 this scheme was employed for N = 144 atoms (32 Ge, 32 Sb and 80 Te) in a cubic periodic simulation cell of side length 16.86 Å (model B hereafter, B standing as the initial of the first author of that paper). To assess the dependence of the thermal conductivity on the dimensions along and across the direction of thermal transport, we have created a new model D (D standing as the initial of the first author of the present paper) made of 252 atoms (56 Ge, 56 Sb and 140 Te) in a cubic simulation cell of 20.32 Å. Stable configurations were obtained from a canonical NVT (constant volume and temperature) trajectory with the following thermal cycle: T = 200 K (5 ps), 300 K (4 ps), 600 K (4 ps), 900 K (12 ps), 600 K (11 ps) and 300 K (15 ps). Then, model D was duplicated to obtain model D2, annealed for 5 ps at T = 600 K and 5 ps at 300 K. In a further step, model D2 (N = 504 atoms) was further duplicated to obtain model D4 (N = 1008 atoms), this latter being annealed for 10 ps at T = 300 K. Periodic boundary conditions are applied to D, D2 and D4. Cell dimensions of the four models are given in Table 1. We stress that our models have the dimensions of the most advanced nanometric phase-change memories.28 Also, it has to be underlined that the results obtained are not sensitive to the choices made of duplicating model D in a specific direction, since we are dealing with well equilibrated disordered systems having structural properties homogeneous in the three directions.
Table 1 Our four models of amorphous GST. L is the supercell length in the heat transport direction and S is its cross section
| Name |
N |
S (Å2) |
L (Å) |
| B |
144 |
16.86 × 16.86 |
16.86 |
| D |
252 |
20.32 × 20.32 |
20.32 |
| D2 |
504 |
20.32 × 20.32 |
40.65 |
| D4 |
1008 |
20.32 × 20.32 |
81.31 |
3 Structural properties of the models
Our strategy featuring four distinct annealing and relaxation runs is intended to meet the requirement of models statistically uncorrelated while having in common, in the case of D, D2 and D4, the same original simulation box. By referring to the D, D2 and D4 models described above, averages were taken at equilibrium on 5 ps at T = 300 K to allow for a comparison among four different samples of glassy GST. The four models considered yield very close structural descriptions of amorphous GST in terms of comparison with available experimental quantities and characteristic motifs of the network. For instance, the total neutron structure factors ST(k) of models B, D, D2 and D4 are reported in Fig. 1 and compared with experiments.29 They exhibit very similar patterns by substantiating the data of ref. 26. The intensities of all the peaks are well reproduced. Interestingly, ST(k) features a prominent bump at k ≈ 1 Å−1, indicative of intermediate range order extending up to distances in the range 6–8 Å. Partial pair correlation functions are also very similar (see Fig. 2) as well as the coordination numbers nGe, nSb, nTe for each species (Table 2). Small differences found among the four realizations have to be ascribed to statistical errors that are typically encountered when producing structures configurationally arrested over the time scales of molecular dynamics. The above pieces of evidence demonstrate unambiguously that the four samples of amorphous GST created by FPMD share the same essential topological features of the network, i.e. D, D2 and D4 do not introduce any relevant changes with respect to the description of ref. 26 based on model B. Therefore, we can safely rule out the presence of size effects in the bulk properties of calculated amorphous GST. Stringent evidence on the predictive power of our FPMD approach for chalcogenides with models ranging in between N ≈ 100 and N ≈ 500 is summarized in ref. 30.
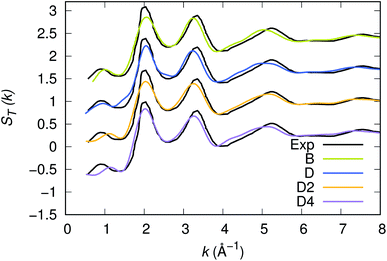 |
| | Fig. 1 Experimental and calculated neutrons structure factor ST(k) of amorphous GST. The calculated quantity has been obtained via integration in real space of the total pair correlation function. Note that this methodology smooths out the noise appearing when the calculation of the structure factors is performed directly in reciprocal space. | |
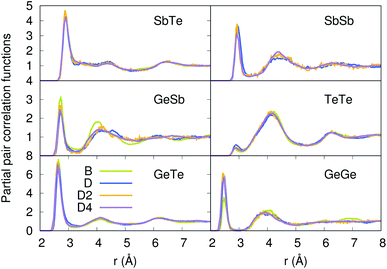 |
| | Fig. 2 Partial pair correlation functions of the four models of amorphous GST. | |
Table 2 Coordination numbers for Ge (nGe), Sb (nSb) and Te (nTe) in the four models. The coordination numbers are defined as the sum of the partial coordination numbers for each atomic species, namely nGe = nGeGe + nGeSb + nGeTe, nSb = nSbSb + nSbGe + nSbTe, nTe = nTeTe + nTeGe + nTeSb. The partial coordination numbers are obtained by integrating the corresponding partial pair correlation functions up to the first minimum. Note that for a given pair of atomic species, say A and B of concentrations cA and cB, one has nAA/cB = nBB/cA
| Model |
nGe |
nSb |
nTe |
| B |
4.03 |
3.99 |
2.58 |
| D |
4.13 |
3.81 |
2.66 |
| D2 |
4.07 |
3.98 |
2.63 |
| D4 |
3.98 |
4.03 |
2.63 |
4 Thermal transport
4.1 Method: the AEMD
Within the AEMD method16 we characterize a thermal process by relying on a thermal transient and, in particular, its decay time τ, this methodology being well established as both effective and affordable.6 The transient regime is obtained following two phases. During the first (phase 1), the system is divided in two blocks (see inset of Fig. 3). The hot block is kept at T = 400 K and the cold block at T = 200 K via two distinct thermostats maintained during 10 ps. At the end of phase 1, the temperature difference between the blocks is released, leading to a transient regime (phase 2) characterized by the decrease (increase) in temperature of the hot (cold) block.
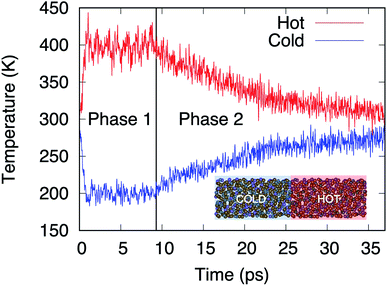 |
| | Fig. 3 Temperatures in the hot (red line) and cold (blue line) blocks during the two phases of AEMD. Model D4 (N = 1008 atoms) is presented in the inset with the hot and cold blocks identified. | |
4.2 Thermal features in the atomic models during the AEMD
Fig. 3 shows the time evolution of the process for the largest model, D4.
Fig. 4 shows the temperature profiles in the four models averaged during the whole duration of phase 2. The profiles are sinusoidal with a period equal to the extension of the simulation cell along the transport direction (L). This proves that for each L, the temperature profile has the sine form solution of the heat equation in a one-dimensional periodic system. Consequently, the decay time τ of the thermal transient observed during phase 2 of AEMD gives access to the thermal conductivity κ defined as:31
| |
 | (1) |
where
C is the heat capacity calculated from the variation of the total energy
versus temperature and
ρ is the system density. Since the temperature difference Δ
T(
t) during phase 2 evolves to a very good extent according to an exponential decay, a decay time
τ can be extracted for each model. It is important to realize that what happens at the interface between the cold and the hot block as a result of the application of the double thermostat has no impact on the decay time, this latter being calculated during phase 2 in the absence of any temperature control.
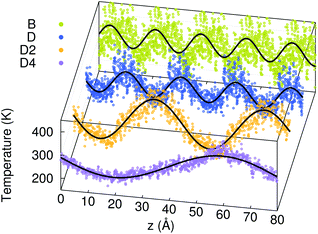 |
| | Fig. 4 Temperature profiles in the four amorphous GST models during phase 2 of AEMD (dots). The data for the smallest models (B, D and D2) are replicated via the periodic boundary conditions. The lines are sine functions fitted to the AEMD data. | |
4.3 Thermal conductivity versus length
The values of thermal conductivity presented in Fig. 5 feature a dependence on the dimension of the simulation cell along the transport direction (L). This behavior has been observed by AEMD in several other materials and nanostructures, and is related to nanoscale and non-local effects.32 This can be rationalized in terms of behavior of heat carriers. Heat carriers with mean free paths (MFP) smaller than L are those experiencing scattering events, while transport is ballistic for heat carriers with a higher MFP. When increasing L, the contribution of heat carriers of larger MFP increases until the bulk thermal conductivity is reached for L larger than the maximum MFP. For sizes larger than the maximum MFP, the thermal conductivity becomes independent on the system length.33,34
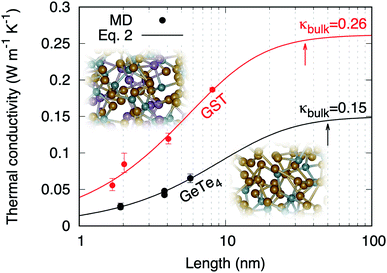 |
| | Fig. 5 Thermal conductivities of amorphous GST calculated by AEMD (red dots). The results obtained in ref. 6 for amorphous GeTe4 using AEMD are also reported (black dots). The lines are fits following Alvarez and Jou's analytical model of size dependence (eqn (2)). The arrows indicate the maximum MFPs. | |
The evolution from a mixed ballistic-diffusive to a purely diffusive regime has been described analytically by Alvarez and Jou:35
| |
 | (2) |
where
κbulk is the bulk thermal conductivity and
l is a parameter with the dimension of a length. Our results are consistent with
eqn (2), as shown in
Fig. 5. The resulting bulk thermal conductivity
κbulk equal to 0.26 ± 0.04 W K
−1 m
−1 agrees with the experimental data reported in
Table 3.
Table 3 Experimental values of the thermal conductivity of amorphous GST (from top to bottom in chronological order)
| Ref. |
κ (W K−1 m−1) |
Method |
Dimensions (nm) |
| 36 |
0.17 |
Laser-induced temperature distribution |
20–85 |
| 37 |
0.24 |
3ω |
98–200 |
| 38 |
0.24 |
3ω |
300 |
| 39 |
0.19 |
Time-domain thermoreflectance |
270 |
| 40 |
0.19 |
Photothermal radiometry |
100–840 |
| 41 |
0.25 ± 0.05 |
Time-domain thermoreflectance |
30–150 |
| 42 |
0.30 |
Scanning thermal microscopy |
100–200 |
5 Discussion
The existence of a length dependence in the heat transport direction means that propagative modes with a distribution of MFPs are responsible for heat transport in a way analogous to phonons in crystals. In our FPMD–AEMD results the persistence of such length dependence up to 8 nm (size of model D4) cannot be related to enhanced structural order in the glass. In fact, such extended form of structural organization does exist in prototypical disordered AX2 materials43 but it does not extend to distances larger than 6 nm. At the largest sizes, a plateau occurs in the behavior of κ(L) for L > 35 nm (Fig. 5). Below this value, a sizeable reduction of thermal conductivity is detectable. It is instructive to consider the thermal conductivity of amorphous GeTe4 as reported in Fig. 5, for which size effects persist up to even larger dimensions (≈50 nm).6 Taken together, these findings prove that propagative modes and size effects are a general feature in chalcogenide glasses and have profound consequences in those prone to nanotechnology applications. This is illustrated in Table 4 where we report the corresponding reductions of thermal conductivity values at 10, 5 and 2 nm. The design of phase-change devices should therefore account for such a reduction of thermal conductivity at smaller technological nodes, since this could lead to an increase of the switching time that would eclipse the benefits of downscaling.
Table 4 Reduction of thermal conductivity at short sizes
| |
10 nm |
5 nm |
2 nm |
| GST |
23% |
46% |
73% |
| gGeTe4 |
38% |
61% |
82% |
6 Conclusion
The thermal conductivity of amorphous Ge2Sb2Te5 has been obtained within a first-principles methodology allowing for an affordable treatment of system sizes (about 1000 atoms) and adequate simulation times. We obtained a quantitative agreement with experimental data, substantiated by a robust analytical extrapolation to macroscopic sizes. We found a length dependence of the thermal conductivity up to 35 nm, a clear indication that propagative carriers contribute to heat transport in spite of structural disorder. The reduction of the thermal conductivity manifests itself as a general feature in disordered chalcogenides, being quite significant (75%) in amorphous Ge2Sb2Te5 for sizes below 2 nm, bearing an unavoidable impact on the thermal management of phase-change memories.
Author contributions
Thuy-Quynh Duong: investigation, Assil Bouzid: investigation, Carlo Massobrio: methodology, Guido Ori: methodology, Mauro Boero: methodology, Evelyne Martin: supervision.
Conflicts of interest
The authors declare that they have no conflict of interest.
Acknowledgements
Sébastien Le Roux is acknowledged for constructive comments. Financial support of the French ANR via the project no. ANR-17-CE09-0039-02 “SIRENA” is gratefully acknowledged. Calculations were performed by using resources from GENCI (Grand Equipement National de Calcul Intensif) (Grants No. 0910296 and 095071).
Notes and references
- D. Ielmini and H.-S. P. Wong, Nat. Electron., 2018, 1, 333–343 CrossRef.
- V. Joshi, M. Le Gallo, S. Haefeli, I. Boybat, S. R. Nandakumar, C. Piveteau, M. Dazzi, B. Rajendran, A. Sebastian and E. Eleftheriou, Nat. Commun., 2020, 11, 2473 CrossRef CAS PubMed.
- M. Wuttig, H. Bhaskaran and T. Taubner, Nat. Photonics, 2017, 11, 465 CrossRef CAS.
- W. Zhang, R. Mazzarello, M. Wuttig and E. Ma, Nat. Rev. Mater., 2019, 4, 150–168 CrossRef CAS.
- M. C. Wingert, J. Zheng, S. Kwon and R. Chen, Semicond. Sci. Technol., 2016, 31, 113003 CrossRef.
- T.-Q. Duong, C. Massobrio, G. Ori, M. Boero and E. Martin, Phys. Rev. Mater., 2019, 3, 105401 CrossRef CAS.
- T.-Q. Duong, C. Massobrio, M. Boero, G. Ori and E. Martin, Comput. Mater. Sci., 2020, 177, 109607 CrossRef CAS.
- D. Campi, D. Donadio, G. C. Sosso, J. Behler and M. Bernasconi, J. Appl. Phys., 2015, 117, 015304 CrossRef.
- G. C. Sosso, D. Donadio, S. Caravati, J. Behler and M. Bernasconi, Phys. Rev. B: Condens. Matter Mater. Phys., 2012, 86, 104301 CrossRef.
- M. Wuttig and N. Yamada, Nat. Mater., 2007, 6, 824–832 CrossRef CAS PubMed.
- G. W. Burr, M. J. Breitwisch, M. Franceschini, D. Garetto, K. Gopalakrishnan, B. Jackson, B. Kurdi, C. Lam, L. A. Lastras, A. Padilla, B. Rajendran, S. Raoux and R. S. Shenoy, J. Vac. Sci. Technol., B: Nanotechnol. Microelectron.: Mater., Process., Meas., Phenom., 2010, 28, 223 CAS.
- P. Noé, C. Vallée, F. Hippert, F. Fillot and J.-Y. Raty, Semicond. Sci. Technol., 2017, 33, 013002 CrossRef.
- V. L. Deringer, W. Zhang, M. Lumeij, S. Maintz, M. Wuttig, R. Mazzarello and R. Dronskowski, Angew. Chem., Int. Ed., 2014, 53, 10817–10820 CrossRef CAS PubMed.
- M. Zhu, O. Cojocaru-Mirédin, A. M. Mio, J. Keutgen, M. Küpers, Y. Yu, J.-Y. Cho, R. Dronskowski and M. Wuttig, Adv. Mater., 2018, 30, 1706735 CrossRef PubMed.
- Y. Yu, M. Cagnoni, O. Cojocaru-Mirédin and M. Wuttig, Adv. Funct. Mater., 2020, 30, 1904862 CrossRef CAS.
- E. Lampin, P. L. Palla, P.-A. Francioso and F. Cleri, J. Appl. Phys., 2013, 114, 033525 CrossRef.
- R. Car and M. Parrinello, Phys. Rev. Lett., 1985, 55, 2471–2474 CrossRef CAS PubMed.
- Jointly by IBM Corporation and by Max Planck Institute, Stuttgart, CPMD code, 2019, http://www.cpmd.org Search PubMed.
- A. D. Becke, Phys. Rev. A: At., Mol., Opt. Phys., 1988, 38, 3098–3100 CrossRef CAS PubMed.
- C. Lee, W. Yang and R. G. Parr, Phys. Rev. B: Condens. Matter Mater. Phys., 1988, 37, 785–789 CrossRef CAS PubMed.
- N. Troullier and J. L. Martins, Phys. Rev. B: Condens. Matter Mater. Phys., 1991, 43, 1993–2006 CrossRef CAS PubMed.
- S. Nosé, Mol. Phys., 1984, 52, 255–268 CrossRef.
- S. Nosé, J. Chem. Phys., 1984, 81, 511–519 CrossRef.
- W. G. Hoover, Phys. Rev. A: At., Mol., Opt. Phys., 1985, 31, 1695–1697 CrossRef PubMed.
- G. J. Martyna, M. L. Klein and M. Tuckerman, J. Chem. Phys., 1992, 97, 2635–2643 CrossRef.
- A. Bouzid, G. Ori, M. Boero, E. Lampin and C. Massobrio, Phys. Rev. B, 2017, 96, 224204 CrossRef.
- L. Kleinman and D. M. Bylander, Phys. Rev. Lett., 1982, 48, 1425–1428 CrossRef CAS.
- B. Kersting and M. Salinga, Faraday Discuss., 2019, 213, 357–370 RSC.
- P. Jóvári, I. Kaban, J. Steiner, B. Beuneu, A. Schöps and M. A. Webb, Phys. Rev. B: Condens. Matter Mater. Phys., 2008, 77, 035202 CrossRef.
- A. Bouzid, S. L. Roux, G. Ori, C. Tugène, M. Boero and C. Massobrio, in Molecular Dynamics Simulations of Disordered Materials: From Network Glasses to Phase-Change Memory Alloys, ed. C. Massobrio, J. Du, M. Bernasconi and P. S. Salmon, Springer International Publishing, Cham, 2015, pp. 313–344 Search PubMed.
- A. Bouzid, H. Zaoui, P. L. Palla, G. Ori, M. Boero, C. Massobrio, F. Cleri and E. Lampin, Phys. Chem. Chem. Phys., 2017, 19, 9729–9732 RSC.
- P. L. Palla, S. Zampa, E. Martin and F. Cleri, Int. J. Heat Mass Transfer, 2019, 131, 932–943 CrossRef CAS.
- H. Zaoui, P. L. Palla, F. Cleri and E. Lampin, Phys. Rev. B, 2017, 95, 104309 CrossRef.
- H. Zaoui, P. L. Palla, S. Giordano, F. Cleri, M. Verdier, D. Lacroix, J.-F. Robillard, K. Termentzidis and E. Martin, Int. J. Heat Mass Transfer, 2018, 126, 830–835 CrossRef CAS.
- F. X. Alvarez and D. Jou, Appl. Phys. Lett., 2007, 90, 083109 CrossRef.
- C. Peng, L. Cheng and M. Mansuripur, J. Appl. Phys., 1997, 82, 4183–4191 CrossRef CAS.
- E.-K. Kim, S.-I. Kwun, S.-M. Lee, H. Seo and J.-G. Yoon, Appl. Phys. Lett., 2000, 76, 3864–3866 CrossRef CAS.
- V. Giraud, J. Cluzel, V. Sousa, A. Jacquot, A. Dauscher, B. Lenoir, H. Scherrer and S. Romer, J. Appl. Phys., 2005, 98, 013520 CrossRef.
- H.-K. Lyeo, D. G. Cahill, B.-S. Lee, J. R. Abelson, M.-H. Kwon, K.-B. Kim, S. G. Bishop and B.-k. Cheong, Appl. Phys. Lett., 2006, 89, 151904 CrossRef.
- J.-L. Battaglia, A. Kusiak, V. Schick, A. Cappella, C. Wiemer, M. Longo and E. Varesi, J. Appl. Phys., 2010, 107, 044314 CrossRef.
- J. Lee, E. Bozorg-Grayeli, S. Kim, M. Asheghi, H.-S. Philip Wong and K. E. Goodson, Appl. Phys. Lett., 2013, 102, 191911 CrossRef.
- J. L. Bosse, M. Timofeeva, P. D. Tovee, B. J. Robinson, B. D. Huey and O. V. Kolosov, J. Appl. Phys., 2014, 116, 134904 CrossRef.
- P. S. Salmon, R. A. Martin, P. E. Mason and G. J. Cuello, Nature, 2005, 435, 75–78 CrossRef CAS PubMed.
Footnotes |
| † Electronic supplementary information (ESI) available. See DOI: 10.1039/d0ra10408f |
| ‡ Present address: Université de Strasbourg, CNRS, ICube UMR 7357, F-67400 Illkirch, France. |
|
| This journal is © The Royal Society of Chemistry 2021 |
Click here to see how this site uses Cookies. View our privacy policy here.  Open Access Article
 b,
Carlo Massobrioc,
Guido Ori
 c,
Mauro Boero
 c and
Evelyne Martin‡
 *a
*a


