 Open Access Article
Enhancing room-temperature NO2 gas sensing performance based on a metal phthalocyanine/graphene quantum dot hybrid material†
Wenkai Jiang,
Xinwei Chen,
Tao Wang,
Bolong Li,
Min Zeng,
Jianhua Yang,
Nantao Hu ,
Yanjie Su
 ,
Zhihua Zhou and
Zhi Yang
 *
*
Key Laboratory of Thin Film and Microfabrication (Ministry of Education), Department of Micro/Nano Electronics, School of Electronic Information and Electrical Engineering, Shanghai Jiao Tong University, Shanghai 200240, P. R. China. E-mail: zhiyang@sjtu.edu.cn
First published on 2nd February 2021
Abstract
Metal phthalocyanine (MPc) has a great saturation response value, but its low conductivity and slow response speed limit its practical application. A novel hybrid material composed of graphene quantum dots (GQDs) and metal phthalocyanine derivatives has been obtained. GQDs can be anchored onto the surface of MPc nanofibers through π–π stacking. The response to NO2 can be significantly enhanced under certain component proportion matching, which is much better than their respective response to NO2. The introduction of GQDs greatly increases the conductivity of phthalocyanine fibers, leading to a faster response of the hybrid material. In addition, the reproducibility, selectivity and stability of the hybrid materials are excellent, and the minimum response concentration can reach 50 ppb. Ultra-low-power laser irradiation was used to solve the problem of slow recovery of metal phthalocyanine. Overall, we present the advantages of combining MPc nanofibers with GQDs and pave a new avenue for the application of MPc–GQD hybrids in the gas sensing field.
1. Introduction
Nowadays, with the rapid increase of industrial and automobile exhaust emissions, nitrogen dioxide (NO2) has become one of the major air pollutants, and has been considered to be an important factor in acid rain. Furthermore, small amounts of NO2 are sufficient to damage the human respiratory system and lung tissues. The U.S. Environmental Protection Agency (EPA) has set air quality standards for NO2 at 53 ppb, which poses a high challenge to relevant research.1So far, numerous sensors based on different materials have been made to detect NO2 to achieve the goal of high sensitivity and low detection limit.2 Metal oxide semiconductors (MOS) such as ZnO, SnO2, WO3, In2O3, CuO and TiO2, are the most widely studied materials for NO2 sensors because of their high sensitivity, low detection limit, and easy synthesis.3,4 The drawbacks of MOS are also obvious. MOS-based NO2 sensors cannot operate at room temperature, usually above 100 °C. This leads to inconvenience and high energy consumption in use. Carbon nanomaterials such as graphene, graphene oxide, and carbon nanotubes, owing to their low-cost and eco-friendly features as well as their unique mechanical, chemical, and superior electronic properties, have been widely studied in recent years.5,6 As a NO2 sensor, carbon materials can be operated at room temperature, but the sensing performance is poor and the recovery time is long. They are more suitable as components to combine with other materials to form hybrids for the detection of NO2 gas.7,8 Furthermore, metal phthalocyanine (MPc) is the main derivative of Pc with metal at the center of the molecular.9–11 With the in-depth studies of the physicochemical properties of MPc, except for the application in dyes, the wider applications are being explored.12–14 Moreover, as a p-type organic semiconductor, MPc is applied as sensitive material to gas molecules in the environment. MPc has therefore attracted enormous interest for gas detection at low temperatures in recent years.15–18 However, the MPc-based sensors could not be applied on a large scale because of their long response and recovery time.19–21 In this research, we will explore a new combination method to solve the problems.
In this study, MPc–GQD based gas sensor will be prepared using the excellent performance of both MPc and graphene quantum dots (GQDs) for the detection of NO2. The composite material exhibits a better stacking structure due to the similar molecule size of GQDs and MPc, which shows better gas sensitivity. As the newest member of the graphene family, graphene quantum dots (GQDs) not only have excellent properties from graphene, but also exhibit a series of new features, such as semiconductor and fluorescence properties, due to quantum confinement effect and boundary effect.22 GQDs have attracted wide attention from scientists in the fields of electronics, chemistry, physics, materials and biology.23–26 In recent years, the research on this new type of zero-dimensional material has made great progress in both experiment and theory.27,28 Since the size of GQDs is below 10 nm, there are stronger quantum confinement effects and boundary effects, which has found many attractive applications in the fields of gas sensing, energy storage, photoelectric conversion, ion detection, cell imaging, and drug transportation.29–31 GQDs is used as a gas sensitive material to avoid stacking because of its nanometer level size.32,33 Pure GQDs humidity sensor and NH3 sensor have been reported.34–36 Researchers on composites of GQDs with Fe2O3 or polyaniline (PANI) used in gas sensing have been studied.37,38 The results demonstrate that GQDs not only have certain gas sensing performance, but also can improve the performance for other gas-sensitive materials, showing a great research space in gas sensing. However, there are few reports on the high sensitivity detection of GQD-based gas sensor and its sensing mechanism. The gas-sensitive mechanism of GQDs is very important for the preparation of high performance GQD-based gas sensor and the promotion of its commercial application.
To the best of our knowledge, this is the first report on the employment of MPc–GQD composite as gas sensor material.39 Our study has shed new light on the rational design of high-performance nanomaterials gas sensors by harnessing the synergetic effects of different materials.
2. Experimental section
2.1. Synthesis of graphene oxide (GO)
GO has been prepared with the modified Hummers method.40,41 The procedure was as follows. 2 g of graphite (500 meshes) and 1.25 g of NaNO3 were added into a 250 mL of flask in an ice-water bath under vigorous stirring. 50 mL of concentrated H2SO4 was then added to the flask. After keeping stirring for 0.5 h, 7.3 g of KMnO4 was added in small portions during 1 h. The temperature was adjusted to 35 °C. The reaction was allowed to keep for 2 h. Subsequently, the reaction was quenched by adding 55 mL of ice water and 7 mL of H2O2 (30%). The products were filtered and washed with plenty of aqueous HCl (3%). The resultant suspension was dialysed for 7 days. Finally, the GO was dried at 40 °C for 24 h in a vacuum oven, producing bright yellow sheets.2.2. Synthesis of graphene quantum dots (GQDs)
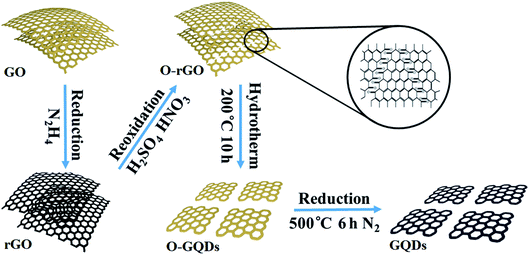
GQDs were obtained by cutting GO sheets.42 The schematic diagrams of the synthetic process for GQDs are shown in Fig. 1. 100 mg of GO sheets were dissolved into 100 mL of deionized (DI) water, and stirred with ultrasonic. Then 100 μL of hydrazine was added, and the mixture was heated to 100 °C for 3 h. The products were reduced graphene oxide (rGO) sheets. 50 mg of rGO sheets were oxidized in 10 mL of concentrated H2SO4 and 30 mL of HNO3 under mild ultrasonication (200 W, 40 kHz) for 12 h. The solution was diluted with deionized water and filtered through a microporous membrane to remove the acids. The purified oxidized rGO sheets (O-rGO) were re-dispersed in deionized water (40 mL) and the pH value of the solution was tuned to 8 with NaOH (1.0 M). The suspension was transferred to a Teflon-lined autoclave (50 mL) and heated at 200 °C for 10 h. The resulting suspension was filtered and further dialyzed in a dialysis bag (retained molecular weight: 5000 Da) for 7 days. The graphene quantum dots outside the dialysis bag containing rich oxide groups (O-GQDs) were further treated. O-GQDs were heated in a tube furnace at 500 °C for 6 h, with a heating rate of 5 °C min−1 in a N2 atmosphere. The products were graphene quantum dots (GQDs) associated with few oxygen-containing groups.2.3. Synthesis of metal phthalocyanine
The synthesis method of metal phthalocyanine was modified according to the procedure previously reported by Wang et al.43 The synthetic path of 2,9,16,23-tetracarboxylic cobalt phthalocyanine (CoPc–COOH) is described as below. 0.08 mol (15.37 g) of 1,2,4-benzenetricarboxylic anhydride (C9H4O5), 0.5 mol (30.0 g) of urea (H2NCONH2), 0.03 mol (7.1379 g) of cobalt chloride hexahydrate (CoCl2·6H2O) and 2.0 × 10⁻⁴ mol (0.2472 g) of ammonium molybdate tetrahydrate ((NH4)6Mo7O24·4H2O) were added into a mortar successively and grounded for about 10 min until they were powdered. Then, the powder was transferred into a flask, which was heated to 250 ± 5 °C in the heat installation with a protective jacket under vigorous stirring for 8 h. The obtained black products were soaked in HCl (300 mL, 1.0 M) for 14 h. The resulting products were filtered and washed several times with deionized water until the pH was close to 7. Next, the obtained filter cake was transferred to a flask equipped with NaOH solution (300 mL, 1.0 M), and boiled for 0.5 h. After that, the solid was separated by a centrifuge (8000 rpm for 5 min), and dried at 30 ± 1 °C in a vacuum oven for 14 h. The blue-black solid removed from the oven was 2,9,16,23-tetracarboxamide cobalt phthalocyanine (CoPc–CONH2).CoPc–CONH2 was transferred into a flask, and then 300 mL of saturated NaCl solution with 2 M NaOH was added into the flask. Next, the mixture was heated to 100 °C for 8 h under the condition of the backflow. After the solution was cooled, it was poured into 1500 mL of deionized water, and the insoluble was filtered out. Then, the pH of the filter liquor was adjusted to less than 2 with HCl (1.0 M), and the product precipitated completely for 14 h. The obtained solid at the bottom was filtered and washed for several times with methanol and deionized water until pH was neutral. After vacuum drying, the purple solid was 2,9,16,23-tetracarboxylic cobalt phthalocyanine (CoPc–COOH). The preparation of the other three types of MPc (NiPc–COOH, CuPc–COOH, ZnPc–COOH) needs to change the metal chloride precursor in the synthetic materials only.
2.4. Fabrication of MPc–GQD hybridized sensing devices
MPc was soluble in DMF, and GQDs were soluble in DI water. The concentration of the above solutions was 1 mg mL−1. The MPc solution was slowly dropped into the GQD solution in different volume proportions (1![[thin space (1/6-em)]](https://www.rsc.org/images/entities/char_2009.gif) :
:![[thin space (1/6-em)]](https://www.rsc.org/images/entities/char_2009.gif) 9, 1
9, 1![[thin space (1/6-em)]](https://www.rsc.org/images/entities/char_2009.gif) :
:![[thin space (1/6-em)]](https://www.rsc.org/images/entities/char_2009.gif) 4, 1
4, 1![[thin space (1/6-em)]](https://www.rsc.org/images/entities/char_2009.gif) :
:![[thin space (1/6-em)]](https://www.rsc.org/images/entities/char_2009.gif) 1, 4
1, 4![[thin space (1/6-em)]](https://www.rsc.org/images/entities/char_2009.gif) :
:![[thin space (1/6-em)]](https://www.rsc.org/images/entities/char_2009.gif) 1, 9
1, 9![[thin space (1/6-em)]](https://www.rsc.org/images/entities/char_2009.gif) :
:![[thin space (1/6-em)]](https://www.rsc.org/images/entities/char_2009.gif) 1). The mixed solution was ultrasonicated for 1 h, so as to make sure the hybrids had been dispersed evenly. Subsequently, the above solution was dropped onto interdigital electrodes, which were dried in an oven at 60 °C for 2 h. A network of MPc–GQD hybrids bridging each electrode gap could be formed. The interdigital electrodes were obtained by standard fabrication procedures, which have been previously reported by our group.40 The devices based on CoPc–COOH without GQDs, with O-GQDs, and with GQDs at a mass ratio of 4
1). The mixed solution was ultrasonicated for 1 h, so as to make sure the hybrids had been dispersed evenly. Subsequently, the above solution was dropped onto interdigital electrodes, which were dried in an oven at 60 °C for 2 h. A network of MPc–GQD hybrids bridging each electrode gap could be formed. The interdigital electrodes were obtained by standard fabrication procedures, which have been previously reported by our group.40 The devices based on CoPc–COOH without GQDs, with O-GQDs, and with GQDs at a mass ratio of 4![[thin space (1/6-em)]](https://www.rsc.org/images/entities/char_2009.gif) :
:![[thin space (1/6-em)]](https://www.rsc.org/images/entities/char_2009.gif) 1 are denoted as CoPc, CoPc-OG and CoPc-G-500, respectively.
1 are denoted as CoPc, CoPc-OG and CoPc-G-500, respectively.
2.5. Characterization
The morphologies of the samples were characterized using a Carl Zeiss Ultra Plus Field Emission Scanning Electron Microscope (FE-SEM, Germany) and transmission electron microscopy (TEM, JEM-2100, JEOL, Japan). Fourier transform infrared spectroscopy (FTIR) spectra were obtained on a Bruker VERTEC 70 instrument (Germany) at a resolution of 1 cm−1 and a spectral range of 4000–400 cm−1. The ultraviolet-visible (UV-Vis) absorption spectra were recorded by a Perkin-Elmer Lambda 950 UV-Vis-NIR spectrophotometer (USA). The photoluminescence (PL) and photoluminescence emission (PLE) spectra were obtained using a Hitachi F-4600 fluorescence spectrophotometer (Japan).2.6. Gas sensing measurement
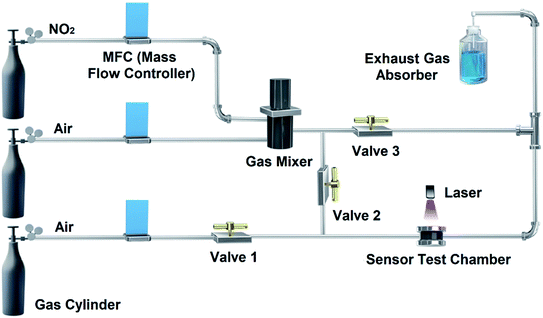
The gas sensors were placed in the test chamber and measured by an Agilent 4156C semiconductor parameter analyzer with a constant voltage of 500 mV at room temperature. A homemade gas-control system improved by the previously reported work44 is shown in Fig. 2. A certain concentration of the target gas can be controlled by mixing dry compressed air and commercial standard NO2 gas (Weichuang, China). Mass flow controllers (MFC, Beijing Qixing Co., Ltd, China) were used to monitor the flow rate of target gas and air into the gas mixer. The target gas with a certain concentration was continuously introduced into the test chamber for gas sensing measurement (Valves 2 open, Valves 1 and 3 closed). The recovery of electrical performances of the devices relies on the dry compressed air and laser irradiation provided by a commercial laser pen with 405 ± 10 nm of purple laser less than 50 mW (Valves 2 closed, Valves 1 and 3 open). When NO2 stops passing through the test chamber, laser-assisted irradiation should be performed during the recovery period, because NO2 is difficult to be removed on CoPc-G-500 in the presence of only air, as shown in Fig. S1.† Besides, water vapor and other gases are prepared under the saturated vapor pressure. The concentration of the mixed gases is also controlled by mixing standard compressed air.The response value (R) was defined as Ra/Rg, where Ra and Rg were the resistance of the devices in air and the target gas, respectively. For the gas response performance of CoPc-G-500 as shown in Fig. S2,† it was difficult to reach a saturation state in a short time. We thus unified the response time to be 100 s in each test. The recovery time of the sensors was defined as the time needed to reach 90% of the original resistance.
3. Results and discussion
3.1. Structure and morphology
Fluorescence performance is a characteristic property of graphene quantum dots (GQDs). The PLE spectrum with the detection wavelength of 450 nm and the excitation–emission spectra of the GQDs in aqueous solution are shown in Fig. S3a and b,† respectively. The PLE spectrum recorded with the strongest luminescence shows two sharp peaks at 254 and 331 nm. Like most luminescent carbon nanoparticles, the GQDs also exhibit an excitation-dependent PL behavior.45 As the excitation wavelength increases in the range of 300 to 390 nm, the wavelength of emission peak redshifts. Through the analysis of the fluorescence phenomenon, the GQDs with small sizes were obtained.The ultraviolet-visible (UV-Vis) absorption spectra analysis of GQDs is shown in Fig. 3a. For the GQDs, a typical absorption peak at below 300 nm was observed, which is assigned to the π–π* transition of aromatic sp2 domains.46 For the O-GQDs, however, besides the strong π–π* absorption peak, a new absorption band in the range of 300–350 nm was also observed. The O-GQDs curve shows the absorption bands at 335 nm which can be attributed to the n–π* transition of the C–O bond.47
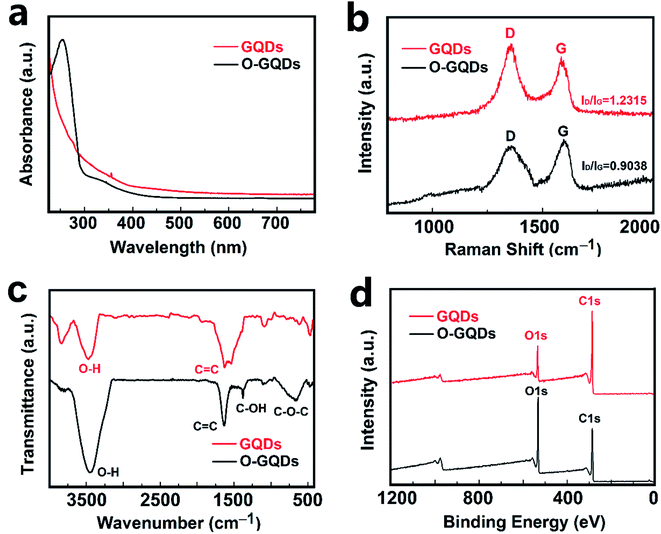 | ||
| Fig. 3 (a) The UV-Vis absorption spectrum, (b) Raman spectra, (c) FT-IR spectra, and (d) XPS survey scan spectra of GQDs and O-GQDs. | ||
The structures of the GQDs were further characterized by Raman, Fourier transform infrared (FT-IR) spectroscopy, and X-ray photoemission spectroscopy (XPS) analyses. The high graphitization is also shown in their Raman spectrum (Fig. 3b), where the ordered G band at 1582 cm−1 is stronger than the disordered D band at 1372 cm−1 with a large G band to D band intensity ratio of 1.2. Fig. 3c shows the FT-IR spectrum of the dried O-GQDs. A strong vibration at 1590 cm−1 is ascribed to the C![[double bond, length as m-dash]](https://www.rsc.org/images/entities/char_e001.gif) C bonds, and a strong, rather broad vibration at 3400 cm−1 belongs to the O–H bonds.48 Given that the sample has been fully dried just before the FT-IR test, the O–H signal is mainly ascribed to the hydroxyl functionalization of the GQDs, which is further confirmed by the vibration of C–OH at 1270 cm−1 in the FT-IR spectrum.49 The OH-functionalization of the GQDs is also revealed in the XPS spectra (Fig. 3d). The survey XPS spectrum shows strong signals of C 1s and O 1s as well as a weak signal from impurity. There is a negligible N 1s signal at 400 eV. The high-resolution C 1s spectrum displays the strong signal of C at 284.8 eV and the distinguishable C–OH peak at 288.2 eV. The high-resolution O 1s spectrum reveals the presence of O–H at 531.4 eV.50 Overall, the XPS analysis demonstrates that 1,3,6-trinitropyrene is fused into O-GQDs by total removal of the NO2 group under the strongly alkaline hydrothermal conditions. The hydroxyl group is bonded with the single-crystalline GQD lattice most likely at the edge sites rather than at the basal plane sites. This unique edge-site functionalization could not induce any sp3 defects within the graphene basal plane, which is different from the random functionalization commonly observed in graphene oxide and highly defective GQDs cut from carbon materials.48
C bonds, and a strong, rather broad vibration at 3400 cm−1 belongs to the O–H bonds.48 Given that the sample has been fully dried just before the FT-IR test, the O–H signal is mainly ascribed to the hydroxyl functionalization of the GQDs, which is further confirmed by the vibration of C–OH at 1270 cm−1 in the FT-IR spectrum.49 The OH-functionalization of the GQDs is also revealed in the XPS spectra (Fig. 3d). The survey XPS spectrum shows strong signals of C 1s and O 1s as well as a weak signal from impurity. There is a negligible N 1s signal at 400 eV. The high-resolution C 1s spectrum displays the strong signal of C at 284.8 eV and the distinguishable C–OH peak at 288.2 eV. The high-resolution O 1s spectrum reveals the presence of O–H at 531.4 eV.50 Overall, the XPS analysis demonstrates that 1,3,6-trinitropyrene is fused into O-GQDs by total removal of the NO2 group under the strongly alkaline hydrothermal conditions. The hydroxyl group is bonded with the single-crystalline GQD lattice most likely at the edge sites rather than at the basal plane sites. This unique edge-site functionalization could not induce any sp3 defects within the graphene basal plane, which is different from the random functionalization commonly observed in graphene oxide and highly defective GQDs cut from carbon materials.48
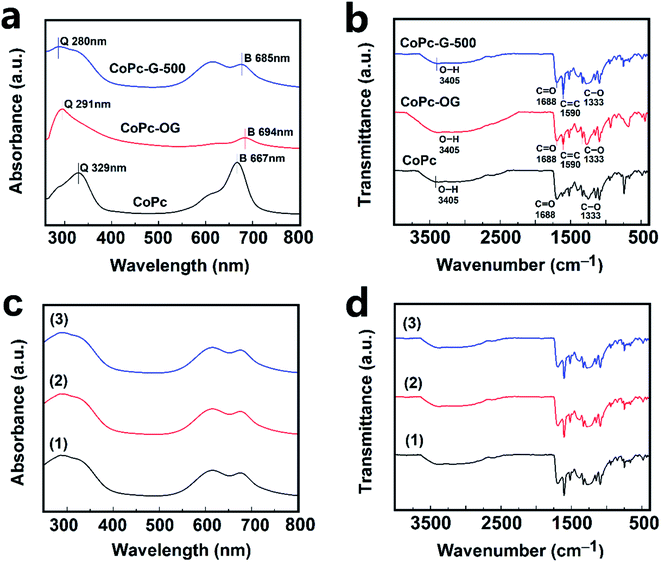
The UV-Vis absorption spectra of CoPc, CoPc-OG and CoPc-G-500 are shown in Fig. 4a. There are two characteristic absorption peaks in the spectrum corresponding to two main absorption bands of CoPc. One is the Q band located at 600–700 nm and the other band is the B band located at 300–400 nm with the strongest peaks located at 667 and 329 nm, respectively.51 In the spectra of CoPc-OG and CoPc-G-500, the two characteristic peaks were significantly weakened or even disappeared due to the interaction between CoPc and GQDs, thereby reducing ΔE (energy level difference between the HOMO and LUMO) corresponding to the B band and the Q band of CoPc, resulting in the redshift of the absorption wavelength.52,53 The FT-IR spectra of CoPc, CoPc-OG and CoPc-G-500 are given in Fig. 4b. The intense bands at 1245, 1148, 1090, 947, 847 and 735 cm−1 are the skeleton peaks of CoPc.19 The broadband around 3405 cm−1 is ascribed to the O–H stretching vibration of the carboxyl group (–COOH). The characteristic peaks of C![[double bond, length as m-dash]](https://www.rsc.org/images/entities/char_e001.gif) O and C–O are located at 1688 and 1333 cm−1, respectively. In the spectra of CoPc-OG and CoPc-G-500, a strong vibration at 1590 cm−1 is ascribed to the C bonds from GQDs. The O–H stretching vibration peak is stronger in CoPc-OG spectrum, which is attributed to its access to many oxygen-containing groups.54
O and C–O are located at 1688 and 1333 cm−1, respectively. In the spectra of CoPc-OG and CoPc-G-500, a strong vibration at 1590 cm−1 is ascribed to the C bonds from GQDs. The O–H stretching vibration peak is stronger in CoPc-OG spectrum, which is attributed to its access to many oxygen-containing groups.54
In our study, laser irradiation was used as an aid to favor the desorption of NO2 from the samples. The change of UV-Vis and FT-IR spectra for CoPc-G-500 before and after adsorption NO2 is negligible (Fig. 4c and d). There is no detectable change of the UV-Vis and FT-IR spectra upon the light irradiation of laser. The UV-Vis and FT-IR spectra together suggest that the molecular structure of the CoPc-G-500 is well kept.
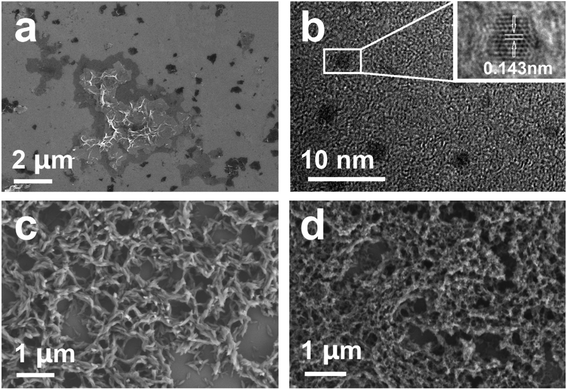
The morphology of the materials is characterized and observed by SEM and TEM. As shown from Fig. 5a, the graphene prepared by the Hummers method has an ultrathin structure, scattered in the observation area, and the size varies from 0.1 to 10 μm. TEM image of the GQDs is shown in Fig. 5b. The size of the GQDs is ca. 1–3 nm. In the enlarged figure, the lattice morphology can be clearly observed. The atomic spacing of the graphene quantum dots is 0.143 nm, which is consistent with the theoretical value.48 As shown in Fig. 5c, the morphology of CoPc–COOH displays a fibrous shape formed by particles. By combining with GQDs, the morphology of the hybrid complex is flocculent and the granularity is obviously reduced (Fig. 5d), which might be ascribed to the addition of quantum dots that hinders the crystallinity of phthalocyanine.
3.2. Evaluation of gas sensing devices
Fig. S4† shows the gas sensitivity tests of O-GQDs and GQDs. The gas sensitivity of GQDs before and after the reduction treatment is rather low, and they can hardly be used in practical applications. The reason might be that the GQDs are too small to form an effective conductive network. When the dose of GQDs is increased, the stack can cause a sharp decline in graphene's conductivity.55Fig. S5† displays the response performances of 50 ppm NO2 on MPc and GQDs under different conditions. As can be seen from Fig. S5a,† when the heating temperature of O-GQDs rises from 100 to 700 °C, the response values of CoPc–GQD hybridized sensing devices increase gradually. As the heating temperatures are at 500 and 700 °C, the performance of the devices is similar. From the perspective of saving time and energy, we choose 500 °C as the best heating temperature for O-GQDs. Similarly, the condition of 500 °C for 6 h was selected as the optimal choice, as shown in Fig. S5b.† The mass ratio of MPc and GQDs is also one of the main factors affecting gas sensitivity performance. It can be seen from Fig. S5c† that the mass ratio of 4![[thin space (1/6-em)]](https://www.rsc.org/images/entities/char_2009.gif) :
:![[thin space (1/6-em)]](https://www.rsc.org/images/entities/char_2009.gif) 1 is optimal. Fig. S5d† shows a specific comparison for the detection of the gas sensitivity performances from different metal phthalocyanines with GQDs. The difference in gas sensitivity between the different metal phthalocyanines with GQDs is negligible. The sensitivity of CoPc–COOH upon combining GQDs is slightly better than that of other metal phthalocyanines. Because of the comparison of the above experiments, we finally chose to mix the CoPc–COOH with GQDs at 500 °C for 6 h with a mass ratio of 4
1 is optimal. Fig. S5d† shows a specific comparison for the detection of the gas sensitivity performances from different metal phthalocyanines with GQDs. The difference in gas sensitivity between the different metal phthalocyanines with GQDs is negligible. The sensitivity of CoPc–COOH upon combining GQDs is slightly better than that of other metal phthalocyanines. Because of the comparison of the above experiments, we finally chose to mix the CoPc–COOH with GQDs at 500 °C for 6 h with a mass ratio of 4![[thin space (1/6-em)]](https://www.rsc.org/images/entities/char_2009.gif) :
:![[thin space (1/6-em)]](https://www.rsc.org/images/entities/char_2009.gif) 1, the one denoted as CoPc-G-500.
1, the one denoted as CoPc-G-500.
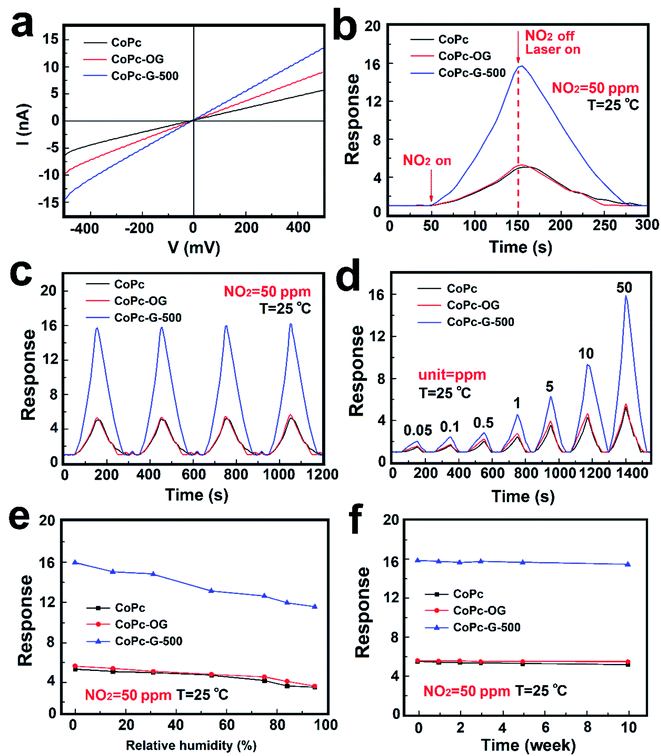
In order to show the enhanced gas sensitivity properties of CoPc–GQD hybridized material, CoPc and CoPc-OG are used to comparatively test the gas sensitivity performance in the study. Fig. 6a exhibits the gas sensing I–V curves of CoPc, CoPc-OG and CoPc-G-500 sensors at room temperature. At a voltage of 500 millivolts, the currents of the three samples are 6.5, 10 and 14.5 nA respectively. The corresponding resistance value is 76.9, 50.0 and 34.5 MΩ approximately. The results strongly suggest that the electrical conductivity of the MPc–GQD composites is significantly improved by doping GQDs. A comparison between the single sensing curves of the three devices towards 50 ppm NO2 is shown in Fig. 6b. The response value in 100 s for CoPc-G-500 towards 50 ppm NO2 is nearly 16 times, which is much higher than that of CoPc and CoPc-OG. Each recovery curve reaches the baseline in 125 s with laser exposure. By combining with O-GQDs, the recovery time of CoPc-OG takes only about 100 s, which is faster than that of CoPc. The decrease in the recovery time indicates that the electron transfer rate has been effectively increased. The recovery speed of CoPc-G-500 is slower than that of CoPc-OG. This is possible because the response value is too high and it takes longer to desorb NO2 from the material surface. It is hard to possess both excellent response and recovery performance for MPc-based or GQDs-based materials. Fig. 6c demonstrates the reversibility tests for CoPc, CoPc-OG and CoPc-G-500 to 50 ppm NO2 over 4 cycles with laser-assisted recovery. The repeatable results clearly indicate that the three devices have great reversibility for NO2 with the laser-assisted irradiation method. However, as the number of repetitions increases, the baseline slightly shifts upward, which may be due to the fact that upon each laser exposure, some gas molecules are remained on the surface of the devices and cannot be completely removed. The response of the sensing devices-based on CoPc, CoPc-OG and CoPc-G-500 towards different concentrations of NO2 ranging from 0.05 to 50 ppm were also studied, as shown in Fig. 6d. The response values improve with the increase of the concentration of NO2 in 100 s. The response values can be fully recovered to their initial values with laser assistance. In comparison with the test concentration of 50 ppm, the gas absorption at other concentrations is poor. The limit values of the three devices are measured to be 50 ppb, which is below the threshold exposure limit of 53 ppb proposed by EPA, implying that the materials synthesized by us have great application potential for NO2 gas sensing.56,57 The response value of CoPc-G-500 was also significantly improved at low concentration. The influence of the relative humidity (RH) on the sensor must be taken into consideration because the water vapor in the air often interferes with the sensor sensitivity and becomes a huge obstacle for practical application. Devices used in the humidity tests with saturated salt solutions of LiCl, CaCl2, Mg(NO3)2, NaCl, KCl and KNO3, the corresponding humidity is 15% RH, 31% RH, 54% RH, 75% RH, 84% RH and 95% RH respectively.58 Fig. 6e shows the influence of humidity on gas sensing performance of CoPc, CoPc-OG and CoPc-G-500. It can be seen from the results that the humidity has a negligible effect on gas sensing performance for the three devices. At normal humidity levels (30–60% RH), the response values of each device change less than 20%, indicating that the gas sensing materials can be applied to the actual environment without concerns on humidity interference. Fig. 6f exhibits the long-term stability of CoPc, CoPc-OG and CoPc-G-500, which have been measured at different times over 10 weeks. It can be clearly seen that the responses of the sensors did not show any significant changes with the operation time and have reliable long-term stability.
Table 1 lists the comparisons of CoPc-G-500 sensor with previously reported MPc sensors for NO2 detection. Remarkably, CoPc-G-500 sensor presents prominent advantages of response value and recovery time at room temperature with laser exposure. These comparisons fully prove that the study can promote the application of phthalocyanine in gas sensors, especially in the detection of NO2.
| Materials | T (°C) | NO2 (ppm) | R | τres/τrec (min) | Ref. |
|---|---|---|---|---|---|
| a T (°C): temperature. R: response value (Ra/Rg), where Ra and Rg were the resistance of the devices in air and the target gas, respectively. τres: response time. τrec: recovery time. Ref.: references. RT: room temperature (25 °C). | |||||
| ZnPc with liquid crystalline properties | 60 | 10 | 5.3 | <1/150 | 13 |
| CoPc nanofibers | RT | 50 | 5.2 | 1.67/1.67 | 43 |
| CuPc thin films | 100 | 3 | 8.0 | <2/50 | 59 |
| TiPc films | 180 | 50 | 3.8 | 3.83/4.67 | 60 |
| CuPc LB films | 100 | 500 | 3.6 | 3.5/35 | 61 |
| CoPc with GQDs | RT | 50 | 15.8 | 1.67/1.67 | This work |
Selectivity is an important criterion for evaluating the quality of gas sensing devices.59 Response results of CoPc, CoPc-OG and CoPc-G-500 upon exposure to different gases at room temperature for 100 s are shown in Fig. 7. The concentration of NO2 is maintained at 50 ppm, and the concentration of other gases is raised to 100 ppm to better reflect good selectivity. We use Ra/Rg to measure the response of gas sensors upon exposure to NO2, and Rg/Ra as the measurement of the response of gas sensors to other gases. The comparison results are less than 2 times for each device, suggesting that the three devices all can be considered as potential candidates for practical use in the detection of NO2. In particular, for CoPc-G-500, the difference in response values between NO2 and other gases is more obvious.
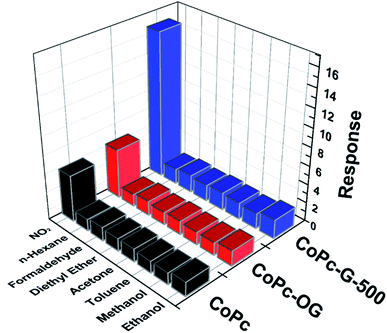 | ||
| Fig. 7 The selectivity of CoPc, CoPc-OG and CoPc-G-500 towards 50 ppm NO2 compared to other 100 ppm analytes. | ||
3.3. Gas sensing mechanism
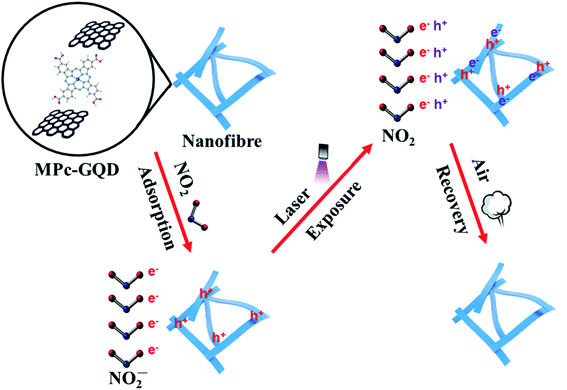
The mechanisms of adsorption and desorption of NO2 on CoPc-G-500 are shown in Fig. 8. GQDs can be anchored onto the surface of MPc nanofibers through π–π stacking. As a result, a charge transfer conjugate can be formed. Metallic phthalocyanine is a typical p-type semiconductor and has good gas sensitivity to NO2. The improved conductivity of GQDs promotes the response speed of metal phthalocyanine. NO2 is a kind of strong electron acceptor. After the reaction with the complex, the electron is trapped by NO2, producing NO2− ions. Rich holes are therefore produced in the nanofibre surface, significantly changing the conductivity of the sensors. High energy beams, such as ultraviolet and laser light, have been widely used to facilitate gas removal in the field of carbon nanomaterials.62–64 In this study, a purple laser was used to shorten the recovery time of the sensing materials. The photodesorption of NO2 from the sensing materials might result from the thermal and non-thermal effects of light irradiation. Since the energy of the laser source is quite low (less than 50 mW) and the irradiation time is short (about 100 s), and the gas sensor can be reused, the explanation of the thermal effect that causes the desorption of NO2 can be ruled out. The non-thermal effect is considered to be the most suitable mechanism to explain the desorption of NO2.65,66 Electron (e−) and hole (h+) pairs are excited by laser on metal phthalocyanine fibers.65 Subsequently, the adsorbed NO2 molecules undergo transitions from NO2− to NO2 by taking one hole and leaving the nanofibre surface along with continuous dry air flow.4. Conclusions
In summary, we have prepared the MPc–GQD-based NO2 sensors. The gas sensitivity performance has been significantly enhanced at room temperature. GQDs can be anchored onto the surface of MPc nanofibers through π–π stacking to form a charge transfer conjugate. The gas-sensitive response of the hybrid materials to NO2 is much better than that of a separate material at room temperature. In addition, the reproducibility, selectivity and stability of the hybrid materials are greatly improved. The minimum response concentration can be as low as 50 ppb. Ultra-low-power laser irradiation was used to solve the problem of slow recovery for metal phthalocyanine. The excellent achievement of MPc–GQD derivative hybrid sensors is expected to pave a new avenue for gas sensing applications with the advantages of low cost, low power, and portable properties.Conflicts of interest
There are no conflicts to declare.Acknowledgements
The authors gratefully acknowledge financial supports by the National Natural Science Foundation of China (61671299, 61971284 and 21703267), the Oceanic Interdisciplinary Program of Shanghai Jiao Tong University (SL2020ZD203 and SL2020MS031) and Scientific Research Fund of Second Institute of Oceanography, MNR (SL2003), and Startup Fund for Youngman Research at SJTU. We also acknowledge analysis support from the Instrumental Analysis Center of Shanghai Jiao Tong University and the Center for Advanced Electronic Materials and Devices of Shanghai Jiao Tong University.References
- Z. Dai, C. S. Lee, Y. Tian, I. D. Kim and J. H. Lee, J. Mater. Chem. A, 2015, 3, 3372–3381 RSC
.
- M. Shaik, V. K. Rao, M. Gupta, K. S. R. C. Murthy and R. Jain, RSC Adv., 2016, 6, 1527–1534 RSC
.
- J. Liu, S. Li, B. Zhang, Y. Xiao, Y. Gao, Q. Yang, Y. Wang and G. Lu, Sens. Actuators, B, 2017, 249, 715–724 CrossRef CAS
.
- Z. Wang, P. Sun, T. Yang, Y. Gao, X. Li, G. Lu and Y. Du, Sens. Actuators, B, 2013, 186, 734–740 CrossRef CAS
.
- M. Xu, T. Liang, M. Shi and H. Chen, Chem. Rev., 2013, 113, 3766–3798 CrossRef CAS
.
- J. Zhang, X. H. Liu, G. Neri and N. Pinna, Adv. Mater., 2016, 28, 795–831 CrossRef CAS
.
- B. Liu, K. Vikrant, K. H. Kim, V. Kumar and S. K. Kailasa, Environ. Sci.: Nano, 2020, 7, 1319–1347 RSC
.
- E. Llobet, Sens. Actuators, B, 2013, 179, 32–45 CrossRef CAS
.
- A. A. Esenpınar, M. Durmuş and M. Bulut, J. Photochem. Photobiol., A, 2010, 213, 171–179 CrossRef
.
- T. Ikeuchi, H. Nomoto, N. Masaki, M. J. Griffith, S. Mori and M. Kimura, Chem. Commun., 2014, 50, 1941–1943 RSC
.
- S. Makhseed, M. Machacek, W. Alfadly, A. Tuhl, M. Vinodh, T. Simunek, V. Novakova, P. Kubat, E. Rudolf and P. Zimcik, Chem. Commun., 2013, 49, 11149–11151 RSC
.
- R. G. Cao, R. Thapa, H. Kim, X. D. Xu, M. G. Kim, Q. Li, N. Park, M. L. Liu and J. Cho, Nat. Commun., 2013, 4, 3076–3082 Search PubMed
.
- J. W. Shi, L. Q. Luan, W. J. Fang, T. Y. Zhao, W. Liu and D. L. Cui, Sens. Actuators, B, 2014, 204, 218–223 CrossRef CAS
.
- N. Kılınç, S. Öztürk, D. Atilla, A. G. Gürek, V. Ahsen and Z. Z. Öztürk, Sens. Actuators, B, 2012, 173, 203–210 CrossRef
.
- F. I. Bohrer, C. N. Colesniuc, J. Park, M. E. Ruidiaz, I. K. Schuller, A. C. Kummel and W. C. Trogler, J. Am. Chem. Soc., 2009, 131, 478–485 CrossRef CAS
.
- K. Vikrant, S. K. Kailasa, D. C. W. Tsang, S. S. Lee, P. Kumar, B. S. Giri, R. S. Singh and K. H. Kim, J. Cleaner Prod., 2018, 187, 131–147 CrossRef CAS
.
- X. Zhang, Z. S. Wu, X. Zhang, L. W. Li, Y. Y. Li, H. M. Xu, X. X. Li, X. L. Yu, Z. S. Zhang, Y. Y. Liang and H. L. Wang, Nat. Commun., 2017, 8, 14675–14682 CrossRef
.
- G. Bottari, O. Trukhina, M. Ince and T. Torres, Coord. Chem. Rev., 2012, 256, 2453–2477 CrossRef CAS
.
- Y. Wang, N. Hu, Z. Zhou, D. Xu, Z. Wang, Z. Yang, H. Wei, E. S. Kong and Y. Zhang, J. Mater. Chem., 2011, 21, 3779–3787 RSC
.
- X. Q. Zhou, X. L. Wang, B. Wang, Z. M. Chen, C. Y. He and Y. Q. Wu, Sens. Actuators, B, 2014, 193, 340–348 CrossRef CAS
.
- X. H. Liang, Z. M. Chen, H. Wu, L. X. Guo, C. Y. He, B. Wang and Y. Q. Wu, Carbon, 2014, 80, 268–278 CrossRef CAS
.
- K. A. Ritter and J. W. Lyding, Nat. Mater., 2009, 8, 235–242 CrossRef CAS
.
- J. Shen, Y. Zhu, X. Yang and C. Li, Chem. Commun., 2012, 48, 3686–3699 RSC
.
- L. Tang, R. Ji, X. Cao, J. Lin, H. Jiang, X. Li, K. S. Teng, C. M. Luk, S. Zeng, J. Hao and S. P. Lau, ACS Nano, 2012, 6, 5102–5110 CrossRef CAS
.
- Y. Li, Y. Zhao, H. Cheng, Y. Hu, G. Shi, L. Dai and L. Qu, J. Am. Chem. Soc., 2012, 134, 15–18 CrossRef CAS
.
- J. Peng, W. Gao, B. K. Gupta, Z. Liu, R. R. Aburto, L. Ge, L. Song, L. B. Alemany, X. Zhan, G. Gao, S. A. Vithayathil, B. A. Kaipparettu, A. A. Marti, T. Hayashi, J. J. Zhu and P. M. Ajayan, Nano Lett., 2012, 12, 844–849 CrossRef CAS
.
- S. K. Kailasa, J. R. Koduru, K. Vikrant, Y. F. Tsang, R. K. Singhai, C. M. Hussain and K. H. Kim, J. Mol. Liq., 2020, 297, 111886 CrossRef CAS
.
- W. Liu, X. Yan, J. Chen, Y. Fenga and Q. Xue, Nanoscale, 2013, 5, 6053–6062 RSC
.
- W. Yuan and G. Shi, J. Mater. Chem. A, 2013, 1, 10078–10091 RSC
.
- T. S. Sreeprasad, A. A. Rodriguez, J. Colston, A. Graham, E. Shishkin, V. Pallem and V. Berry, Nano Lett., 2013, 13, 1757–1763 CrossRef CAS
.
- L. Tang, R. Ji, X. Li, G. Bai, C. P. Liu, J. Hao, J. Lin, H. Jiang, K. S. Teng, Z. Yang and S. P. Lau, ACS Nano, 2014, 8, 6312–6320 CrossRef CAS
.
- S. Syama and P. V. Mohanan, Nano-Micro Lett., 2019, 11, 1–31 CrossRef
.
- X. Li, M. Rui, J. Song, Z. Shen and H. Zeng, Adv. Funct. Mater., 2015, 25, 4929–4947 CrossRef CAS
.
- N. Li, X. D. Chen, X. P. Chen, X. Ding and X. Y. Li, IEEE Electron Device Lett., 2015, 36, 615–617 CAS
.
- V. Ruiz, I. Fernández, P. Carrasco, G. Cabanero, H. J. Grande and J. Herrán, Sens. Actuators, B, 2015, 218, 73–77 CrossRef CAS
.
- W. Chen, F. Li, P. C. Ooi, Y. Ye, T. W. Kim and T. Guo, Sens. Actuators, B, 2016, 222, 763–768 CrossRef CAS
.
- A. Ananthanarayanan, X. Wang, P. Routh, B. Sana, S. Lim, D. H. Kim, K. H. Lim, J. Li and P. Chen, Adv. Funct. Mater., 2014, 24, 3021–3026 CrossRef CAS
.
- J. N. Gavgani, A. Hasani, M. Nouri, M. Mahyari and A. Salehi, Sens. Actuators, B, 2016, 229, 239–248 CrossRef CAS
.
- S. Mao, A. G. Lub and J. Chen, J. Mater. Chem. A, 2014, 2, 5573–5579 RSC
.
- N. Hu, Y. Wang, J. Chai, R. Gao, Z. Yang, E. S. Kong and Y. Zhang, Sens. Actuators, B, 2012, 163, 107–114 CrossRef CAS
.
- Y. Sun, F. Yu, C. Li, X. Dai and J. Ma, Nano-Micro Lett., 2020, 12, 1–14 CrossRef CAS
.
- D. Pan, J. Zhang, Z. Li and M. Wu, Adv. Mater., 2010, 22, 734–738 CrossRef CAS
.
- W. Jiang, T. Wang, X. Wei, B. Li, M. Zeng, N. Hu, Y. Su, Z. Zhou, Y. Zhang and Z. Yang, Phys. Chem. Chem. Phys., 2020, 22, 18499–18506 RSC
.
- D. Huang, X. Li, S. Wang, G. He, W. Jiang, J. Hu, Y. Wang, N. Hu, Y. Zhang and Z. Yang, Sens. Actuators, B, 2017, 252, 956–964 CrossRef CAS
.
- T. Alizadeh and M. Shokri, Sens. Actuators, B, 2016, 222, 728–734 CrossRef CAS
.
- J. Hu, C. Zou, Y. Su, M. Li, N. Hu, H. Ni, Z. Yang and Y. Zhang, J. Mater. Chem. C, 2017, 5, 6862–6871 RSC
.
- G. He, D. Huang, Z. Yang, Y. Han, J. Hu, N. Hu, Y. Su, Z. Zhou, Y. Zhang and Y. Zhang, Phys. Chem. Chem. Phys., 2018, 20, 4083–4091 RSC
.
- V. Gupta, N. Chaudhary, R. Srivastava, G. D. Sharma, R. Bhardwaj and S. Chand, J. Am. Chem. Soc., 2011, 133, 9960–9963 CrossRef CAS
.
- X. Huang, N. Hu, R. Gao, Y. Yu, Y. Wang, Z. Yang, E. S. Kong, H. Wei and Y. Zhang, J. Mater. Chem., 2012, 22, 22488–22495 RSC
.
- J. Li, Y. J. Lu, Q. Ye, M. Cinke, J. Han and M. Meyyappan, Nano Lett., 2003, 3, 929–933 CrossRef CAS
.
- Z. Yang, H. Pu and J. Yuan, Chem. Phys. Lett., 2008, 465, 73–77 CrossRef CAS
.
- T. Mugadza and T. Nyokong, Electrochim. Acta, 2010, 55, 6049–6057 CrossRef CAS
.
- X. Wang, Y. Liu and W. Qiu, J. Mater. Chem., 2002, 12, 1636–1639 RSC
.
- L. Cao, H. Z. Chen and H. B. Zhou, Adv. Mater., 2003, 15, 909–913 CrossRef CAS
.
- L. Wibmer, A. Leandro, M. O. Lourenço, A. Roth, G. Katsukis, M. G. P. M. S. Neves, J. A. S. Cavaleiro, J. P. C. Tomé, T. Torres and D. M. Guldi, Nanoscale, 2015, 7, 5674–5682 RSC
.
- J. H. Park, J. E. Royer, E. Chagarov, T. Kaufman-Osborn, M. Edmonds, T. Kent, S. Lee, W. C. Trogler and A. C. Kummel, J. Am. Chem. Soc., 2013, 135, 14600–14609 CrossRef CAS
.
- J. H. Park, P. Choudhury and A. C. Kummel, J. Phys. Chem. C, 2014, 118, 10076–10082 CrossRef CAS
.
- S. Wang, D. Huang, S. Xu, W. Jiang, T. Wang, J. Hu, N. Hu, Y. Su, Y. Zhang and Z. Yang, Phys. Chem. Chem. Phys., 2017, 19, 19043–19049 RSC
.
- N. Padma, A. Joshi, A. Singh, S. K. Deshpande, D. K. Aswal, S. K. Gupta and J. V. Yakhmi, Sens. Actuators, B, 2009, 143, 246–252 CrossRef
.
- C. Liu, C. Pen, Y. Ju and J. Hsieh, Sens. Actuators, B, 1998, 52, 264–269 CrossRef CAS
.
- S. Capone, S. Mongelli, R. Rella, P. Sicilian and L. Valli, Langmuir, 1999, 15, 1748–1753 CrossRef CAS
.
- R. J. Chen, N. R. Franklin, J. Kong, J. Cao, T. W. Tombler, Y. G. Zhang and H. J. Dai, Appl. Phys. Lett., 2001, 79, 2258–2260 CrossRef CAS
.
- C. Li, D. H. Zhang, X. L. Liu, S. Han, T. Tang, J. Han and C. W. Zhou, Appl. Phys. Lett., 2003, 82, 1613–1615 CrossRef CAS
.
- V. Dua, S. P. Surwade, S. Ammu, X. Zhang, S. Jain and S. K. Manohar, Macromolecules, 2009, 42, 5414–5415 CrossRef CAS
.
- A. V. Zasedatelev, T. V. Dubinina, D. M. Krichevsky, V. I. Krasovskii, V. Y. Gak, V. E. Pushkarev, L. G. Tomilova and A. A. Chistyakov, J. Phys. Chem. C, 2016, 120, 1816–1823 CrossRef CAS
.
- T. Basova, A. Tsargorodskaya, A. Nabok, A. K. Hassan, A. G. Gürek, G. Gümüş and V. Ahsen, Mater. Sci. Eng., C, 2009, 29, 814–818 CrossRef CAS
.
Footnote |
| † Electronic supplementary information (ESI) available. See DOI: 10.1039/d0ra10310a |
| This journal is © The Royal Society of Chemistry 2021 |

