
 Open Access Article
 This Open Access Article is licensed under a Creative Commons Attribution-Non Commercial 3.0 Unported Licence
Construction of a ratio fluorescence assay of 5-aminosalicylic acid based on its aggregation induced emission with blue emitting N/P-codoped carbon dots†
Yingying Hua,
Yongping Wanga,
Rentian Guana,
Cong Zhanga,
Xiaodong Shaob and
Qiaoli Yue *a
*a
aShandong Provincial Key Laboratory of Chemical Energy Storage and Novel Cell Technology, School of Chemistry and Chemical Engineering, Liaocheng University, Liaocheng 252059, China. E-mail: yueqiaoli@yahoo.com
bState Key Laboratory for Performance and Structure Safety of Petroleum Tubular Goods and Equipment Materials, Tubular Goods Research Institute, Xian 710077, China
First published on 10th February 2021
Abstract
Herein, a novel ratio fluorescence method based on N/P-doped carbon dots (NPCDs) for detecting 5-aminosalicylic acid (5-ASA) in mesalazine enteric coated tablets and blood were reported for the first time. NPCDs were successfully prepared through a simple one-step hydrothermal strategy by employing adenosine triphosphate (ATP) and p-toluidine as raw materials. NPCDs exhibit bright blue emissions with excitation/emission peaks at 340/423 nm with moderate quantum yield (20.75%). In addition, 5-ASA has a certain weak fluorescence emission peak at 487 nm. Adding 5-ASA into NPCDs significantly enhanced the fluorescence intensity, which may result from aggregation induced emission (AIE) of 5-ASA on the surface of NPCDs. Therefore, NPCDs only provide self-calibration signals, and their fluorescence remains almost unchanged when co-existing with 5-ASA. Therefore, the ratio of fluorescence at F487/F423 was used for detection of 5-ASA. For the fluorometric determination assay, there was a good linear relationship between F487/F423 and 5-ASA concentration between 0.50 and 130 μM (R2 = 0.9979). The detection limit was about 0.13 μM. Therefore, this method is simple, sensitive and low cost, and will be successfully applied to the detection of 5-ASA in drugs.
Introduction
5-Aminosalicylic acid (5-ASA) is one of the most important active substances in the pharmaceutical field for the treatment of various diseases.1,2 5-ASA can inhibit natural killer cell activity induced by bacterial peptide, cyclooxygenase and lipoxygenase pathways, and impair neutrophil chemotaxis and adenosine induced secretion.3 In addition, 5-ASA can restrain the cellular damage of the swollen mucosa by removing active oxygen substances, thereby inhibiting its toxicity.4 When administered orally, the drug is quickly assimilated by the small intestine. So, decorated release agents are designed for drug delivery at the terminal ileum and colon.5At present, the generally recognized methods for studying the structure and performance of 5-ASA include spectrophotometry,6,7 high-performance liquid chromatographic,8 electronic chemistry3 and liquid chromatography-mass spectrometry,9,10 etc. However, there is a little means for the detection of 5-ASA in drug and biological samples, due to the complexity of 5-ASA derivatization process, cumbersome extraction process and expensive instruments, and low detection capacity. Therefore, it is desirable to develop a sensitive method that can easily determine 5-ASA in pharmaceutical preparation directly.
Carbon quantum dots (CQDs) was firstly reported in 2004.11 CQDs have attracted extensive attention in various fields due to their unique water solubility, flexibility surface modification, excellent chemical stability, good photoluminescence,12,13 etc. Generally, CQDs contains many oxygen-containing groups on its surface. The functional groups are considered as a significant basis for constructing optical sensors for quantitative analysis.14 Currently, CQDs are widely used in bioimaging,13 nanomedical,15 photocatalysis,16 and sensors17,18 etc. CQDs are considered as a promising nanomaterial because of their unique properties.
For traditional fluorescent dyes, such as fluorescein, due to its own quenching effect, it will experience aggregation-induced quenching (ACQ). However, a type of fluorophore (luminophore) with aggregation-induced emission (AIE) characteristic, is a strong fluorescent even in its their aggregate or solid states.19 AIE fluoride displays faint or no emission in the state of molecular dissolution, but owing to the restriction of intramolecular motions (RIMs), it shows strong emission in the state of aggregation.20 So far, this type of fluorophore has been successfully used in many fields. AIE luminogens ascribed from salicylaldehyde hydrazone were used in targeted cell imaging based on the RIMs of in silica nanoparticles.19 In addition, as a signal unit, tetraphenylethene was also used as a typical AIE fluorogen for sensing PPi.20 However, the AIE of 5-ASA was not reported.
At present, there are many fluorescence sensing methods such as “turn-on”, “turn-off” and ratio fluorescence and so on. The ratio fluorescence method is of great interest in determining analytes based on the relationship between the ratio of two or more emission intensities and the concentration of the analyte. Compared with other fluorescence methods for intensity-based measurements, ratio fluorescence exhibits obvious advantages. Ratio fluorescence method can effectively eliminate ambient interference due to its reliable built-in correction.21 In addition, the interferences by the fluctuation of excitation laser power of the instrument can also be effectively avoided. Most importantly, ratio fluorescence method is convenient and highly sensitive.
Ratio fluorescence method for detection of 5-ASA was firstly proposed in this study. The ratio fluorescence probe N/P-doped carbon dots (NPCDs) are synthesized using ATP and p-toluidine as precursors by one-pot hydrothermal route, which shows bright blue fluorescent and with moderate quantum yield (20.75%). Therefore, high-sensitivity ratio fluorescence sensing platform is built for the detection of 5-ASA. When 5-ASA is added to NPCDs, fluorescence emission peak at 487 nm is significantly enhanced. While NPCDs emission peak at 423 nm is unchanged. Therefore, ratio fluorescence at F487/F423 was used for the detection of 5-ASA, and there was a good linear relationship between F487/F423 and 5-ASA concentration between 0.50 and 130 μM (R2 = 0.9979). The detection limit was about 0.13 μM. This method is simple, sensitive and low cost, and has been successfully applied to 5-ASA detection in drugs. The process of NPCDs synthesis and its application in 5-ASA detection are shown in Scheme 1.
 | ||
| Scheme 1 Schematic of NPCDs synthesis and application in 5-ASA detection. | ||
Experimental
Apparatus
NPCDs were prepared by autoclave in a DZ-2A vacuum drying oven (Tianjin Taisite Instrument Co., Ltd, http://www.taisite.cn). Absorption spectral were obtained on a Lambda 750 spectrophotometer (Perkin Elmer, USA). Fluorescence spectrum and intensity were carried out on LS-55 spectrophotometer (Perkin-Elmer, USA, http://yeepart.com). Fourier transform infrared (FT-IR) spectrum were gained on a Nicolet 6700 (Thermo Scientific Ltd, USA, http://www.thermofisher.com). X-ray photoelectron spectroscopy (XPS) measurements were undertaken with a K-Alpha spectrometer (Thermo Scientific Ltd, USA, http://www.thermofisher.com). Transmission electron microscope (TEM) images were carried out on a JEM 2100 electron microscope (JEOL Ltd, Japan, https://www.jeol.co.jp). TEM worked with an acceleration voltage at 200 kV, and a carbon-coated copper grid was used for sample suspension. Coolpix 4500 digital camera (Nikon, Japan, https://www.nikon.co.jp) was used to obtain photos of CQDs dispersion in day light and UV lamp.Reagents and materials
ATP, p-toluidine, 5-ASA, 3-aminosalicylic acid (3-ASA), 4-aminosalicylic acid (4-ASA) were obtained in Shanghai Perfemiker Material Tech Co., Ltd (Shanghai, China, http://www.canspecsci.com). Fe(NO3)3, CuCl2, HgCl2, NiCl2, CdCl2, CrCl3, ZnCl2, CaCl2, Pb(NO3)2, AgNO3, Co(NO3)2·6H2O, Mn(Ac)2, MgCl2, BaCl2 and Bi(NO3)3·5H2O were purchased from Fluka (Buchs, Switzerland, http://www.fluka.org/fluka.php). p-Nitrochlorobenzene, o-nitrobenzaldehyde, p-nitrotoluene, salicylic acid, benzidine, p-chlorophenol, acetanilide, o-aminophenol, alanine, leucine, phenylalanine, glutamic acid, asparagine, arginine, tyrosine, histidine, serine, glycine, valine, tryptophan, lysine, glutathione, cysteine, melamine and ethanol were purchased in Beijing Solarbio Reagent Co., Ltd (Beijing, China, http://www.solarbio.com). Unless otherwise specified, all chemicals from commercial sources are analytically pure and can be used directly without further purification. All solutions were prepared and diluted with ultrapure water from the MillI-Q water purification system.Preparation of NPCDs
In short, 0.1 g of p-toluidine and 0.1 g of ATP were dissolved in 10.0 mL distilled water and sonicated for 30 minutes to obtain an evenly suspension. The suspension was transferred to a 50 mL polytetrafluoroethylene-lined autoclave reactor, then added additional ethanol until 80% of the container was filled and heated at 180 °C for 10 hours. Then cool the autoclave to room temperature, the brown product was collected and centrifuged at 10![[thin space (1/6-em)]](https://www.rsc.org/images/entities/char_2009.gif) 000 rpm for 10 minutes to remove large particles. The supernatant was treated with 1000 Da dialysis bags for 12 hours. In order to remove the solvent and prevent the sample from aggregation, freeze-drying method was used. Finally, black-brown powders of NPCDs were prepared and placed at 4 °C for subsequent treatment.
000 rpm for 10 minutes to remove large particles. The supernatant was treated with 1000 Da dialysis bags for 12 hours. In order to remove the solvent and prevent the sample from aggregation, freeze-drying method was used. Finally, black-brown powders of NPCDs were prepared and placed at 4 °C for subsequent treatment.
Quantum yield measurement
Choose quinine sulfate as reference material. The quantum yield (QY) of NPCDs was determined by the integrated fluorescence intensity (Em = 423 nm) and absorbance (340 nm) of NPCDs. The QY was calculated using the following formula:| Qx = Qst(Kx/Kst)(ηx2/ηst2) |
Detection of 5-ASA
The detection of 5-ASA was performed in pure water with pH 7.0. In typical measurements, 5-ASA is dissolved in distilled water to prepare a range of standard 5-ASA reserve solutions of varying concentrations. Subsequently, 10 μL of NPCDs and 985 μL of pure water (pH = 7.0) and 5 μL 5-ASA of different concentrations were added to the centrifuge tube. Then after incubation at room temperature for 1 minute, the fluorescence emission signal was detected at 340 nm of excitation wavelength with the presence and absence of 5-ASA.Pretreatment of real sample
This method was used for 5-ASA detection in mesalazine enteric-coated tablets and blood (mesalazine enteric-coated tablets and blood were purchased and taken from a local hospital). The drug particles were crushed and dissolved in 10 mL of pure water and 0.22 μm film was used to filter the particles of samples. The real sample of blood is diluted 200 times. Afterwards, 10 μL NPCDs and 5 μL real sample was mixed, 5 μL 5-ASA solutions at different concentrations, and 980 μL of tertiary water (pH = 7.0). The content and the recovery efficiency of 5-ASA in the real sample was analyzed and calculated.Results and discussion
Characterization of NPCDs
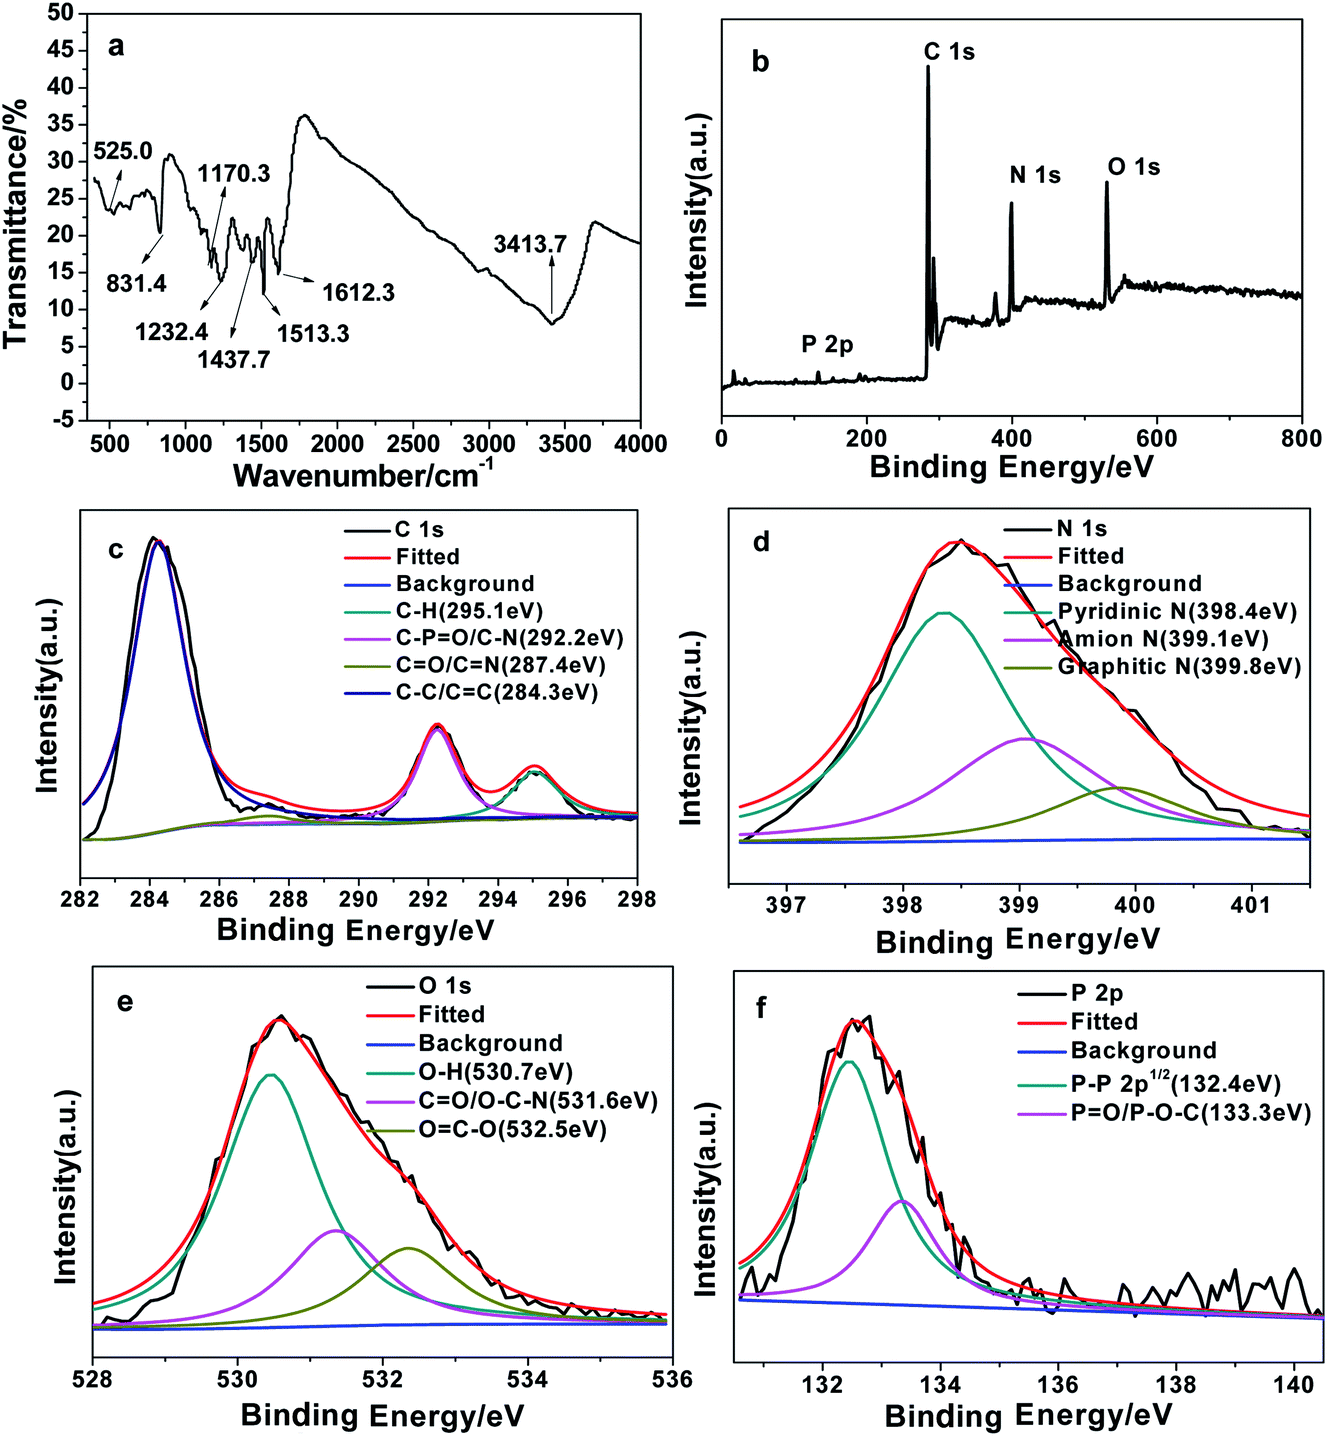
NPCDs were prepared by facile, one-step hydrothermal route employing p-toluidine and ATP as raw material. Fig. 1a shows TEM images of NPCDs. It can be seen that NPCDs exhibit good monodispersity without obvious agglomeration. As shown in Fig. 1b, the particle size histogram of NPCDs was gained through analysis of TEM pictures, and the average particle size was 1.8 ± 0.4 nm. In order to study the functional groups on the surface of NPCDs, FT-IR spectra was recorded. As shows in Fig. 2a, there is a broad stretching vibration peak at 3413.7 cm−1, which is attributed to the –OH/–NH2 group. The sharp absorption peaks located at 1612.3 cm−1, 1513.3 cm−1, and 1437.7 cm−1, which are attributed to the stretching vibration of C![[double bond, length as m-dash]](https://www.rsc.org/images/entities/char_e001.gif) O, CN, and –CH3 group,22 respectively. The characteristic absorption peaks at 525.0 cm−1, 831.4 cm−1, 1170.3 cm−1, and 1232.4 cm−1, which are assigned to PO43−, P–O–H, P–O–C, and PO,13 respectively. These results indicate that nitrogen and phosphorus atoms were successfully doped in CQDs.
O, CN, and –CH3 group,22 respectively. The characteristic absorption peaks at 525.0 cm−1, 831.4 cm−1, 1170.3 cm−1, and 1232.4 cm−1, which are assigned to PO43−, P–O–H, P–O–C, and PO,13 respectively. These results indicate that nitrogen and phosphorus atoms were successfully doped in CQDs.
 | ||
| Fig. 1 TEM images (a) and the size distribution graphics (b) of NPCDs. | ||
 | ||
| Fig. 2 FTIR spectra (a) and the full binding energy spectra (b) of NPCDs, the high-resolution spectrum of the C1s (c), N1s (d), O1s (e), P2p (f), respectively. | ||
To study the element composition of NPCDs, the X-ray photoelectron spectra (XPS) was measured. As shown in Fig. 2b, it displays four typical peaks at 284, 399, 531, and 133 eV, which are ascribed to C1s, N1s, O1s, and P2p, respectively. As illustrated in Fig. 2c, the high-resolution spectrum of C1s is decomposed into three main peaks, which are C–C/CC (284.3 eV), CO/CN (287.4 eV), C–PO/C–N (292.2 eV) and C–H (295.1 eV) bond,13 respectively. As shown in Fig. 2d, the N1s spectra shows three peaks at 399.8 eV, 399.1 eV, and 398.4 eV, which belong to graphite-N, amino-N, and pyridine-N,20 respectively. As exhibited in Fig. 2e, the O1s spectrum shows three main peaks, which are OC–O (532.5 eV), CO/O–C–N (531.6 eV) and O–H (530.7 eV).23 As shown in Fig. 2f, the P2p spectrum can be deconvoluted into two peaks, which are PO/P–O–C (133.3 eV) and P–P 2p1/2 (132.4 eV).24 These results indicate that the surface of NPCDs contains many functional groups, such as –COOH, –OH and –NH2, which are conducive to their high hydrophilicity and stability in aqueous solution. In addition, the results also show agreement with the FT-IR spectrum.
Optical performances of NPCDs
In order to study NPCDs optical properties, UV-Vis absorption spectrum and fluorescence emission spectrum of NPCDs were obtained. As shown in Fig. 3a, it shows a broad ultraviolet-visible absorption band at 220–320 nm, and absorption peaks at 229 nm, 278 nm and 328 nm, respectively. The strong peak at 229 nm and weak shoulder peak at 278 nm correspond to the π–π* transition of aromatic sp2 and the n–π* transition of CO bond. The band at 328 nm is assigned to the n–π* transition of CC bond. The aqueous solution of NPCDs is almost colourless under sunlight, but it shows a bright blue emission under the UV lamp of 365 nm (inset of Fig. 3a). So far, two fluorescence mechanisms for CQDs have been proposed: electronic conjugated structures and emission traps.25 Similar to previously reported CQDs, NPCDs exhibits florescence behaviours that depended on excitation. As shown in Fig. 3b, as the excitation wavelength was increased from 300 nm to 380 nm, the emission peak varied around 410–430 nm. When the excitation wavelength is at 340 nm, the emission wavelength at 423 nm and the fluorescence intensity is the strongest, so the best excitation wavelength at 340 nm of NPCDs. It indicates that the emission trap caused by the surface state chemical group plays an important role in the excitation wavelength dependence of NPCDs. At the same time, with quinine sulfate as the standard, the measured QY of NPCDs was 20.75%.
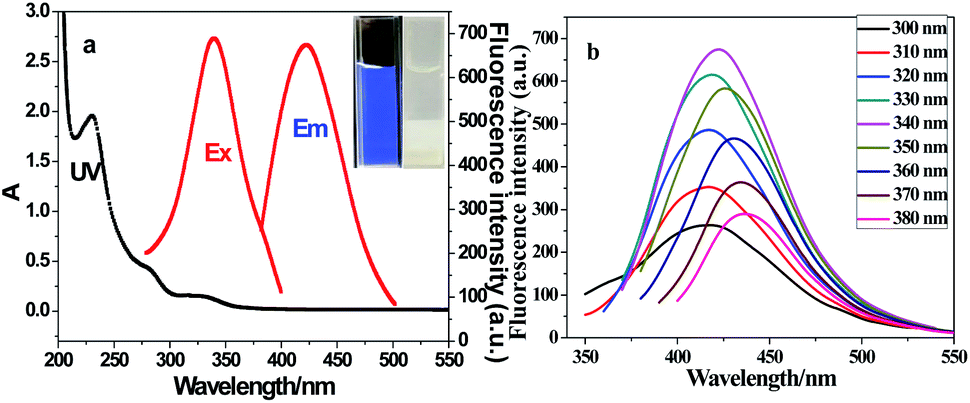 | ||
| Fig. 3 UV-vis and fluorescence spectra of NPCDs (a), fluorescence spectra of NPCDs (b) with the change on excitation wavelength. | ||
Optimization of sensing conditions
NPCDs were prepared by hydrothermal method and applied to determine 5-ASA. Herein, the influences of reaction time, temperature and molar ratio on the preparation of NPCDs were investigated. In addition, the effects of ionic strength, buffer solution, pH on sensing process have also been studied.Effect of preparation conditions
Herein, we used ATP and p-toluidine as precursors to prepared NPCDs by hydrothermal method. Due to the content of nitrogen and phosphorus can affect the optical properties of NPCDs. In order to obtain high-luminescence NPCDs, the synthesis conditions such as hydrothermal reaction time, reaction temperature, and molar ratio of precursors were optimized. As shown in Fig. S1a,† the molar ratio of ATP to p-toluidine is 1:10 to 10:1. The fluorescence intensity reaches the peak with the molar ratio of 1:1.
As shown in Fig. S1b,† when the reaction time of NPCDs is 8 to 13 h. It can be seen that the fluorescence intensities reach its maximum value at 10 h. As shown in Fig. S1c,† as the reaction temperature rises from 150 °C to 200 °C, NPCDs fluorescence intensity at different temperatures is measured. As can be seen that the fluorescence intensity increases and slides down in the range of 150–200 °C. Evidently, the maximum value at 180 °C. Therefore, the best condition for synthesis NPCDs is at 180 °C for 10 h.
Effect of sensing conditions
In order to make NPCDs have better fluorescence response to 5-ASA, the pH, buffer species, and ion strength were optimized. As shown in Fig. S2a,† it can be seen that there are no significant fluorescence changes of NPCDs in solutions with pH values ranging from 2.0 to 12.0. This indicates that NPCDs products show stable properties in media with a wide pH range. For NPCDs-5-ASA system, there is an obviously change of the fluorescence intensity. The recovered fluorescence reaches the optimal when pH = 7.0. To study the buffer species impact for 5-ASA detection, pure water, HEPES, NH3/NH4Cl, Tris–HCl and PBS were tested. As shown in Fig. S2b,† it can be observed that there is almost no change of the value of F487/F423. This shows that the buffer solution has no great influence on 5-ASA determination. However, considering the efficiency and simplification of the experiment, ultrapure water with pH = 7.0 was used for 5-ASA determination. At the same time, different concentrations of NaCl was used to study the effect of ionic strength. As shown in Fig. S2c,† When the salt concentration range is 0–0.5 M, its no significant change of fluorescence intensity. The results show that NPCDs have excellent salt resistance and good stability. Therefore, ultrapure water with pH = 7.0 was used as optimal conditions for 5-ASA determination by NPCDs.Sensitivity
Prior to sensitivity examination, fluorescence and absorption spectrum of NPCDs were studied with and without of 5-ASA. Before performing the sensitivity measurements, the fluorescence and absorption spectra of the NPCDs were investigated in the presence and absence of 5-ASA. As shown in Fig. 4a and b, the fluorescence and absorption spectrum of NPCDs, 5-ASA, NPCDs-5-ASA was recorded, respectively. The fluorescence emission peak of NPCDs at 423 nm is strong and 5-ASA shows weak fluorescence emission peak at 487 nm. However, when NPCDs coexist with 5-ASA, the fluorescence emission peak of 5-ASA at 487 nm is significantly enhanced, while NPCDs emission peak at 423 nm is unchanged. In contrast, the absorption spectra of NPCDs-5-ASA ascribed to the overlapping of NPCDs and 5-ASA spectra (Fig. 4b).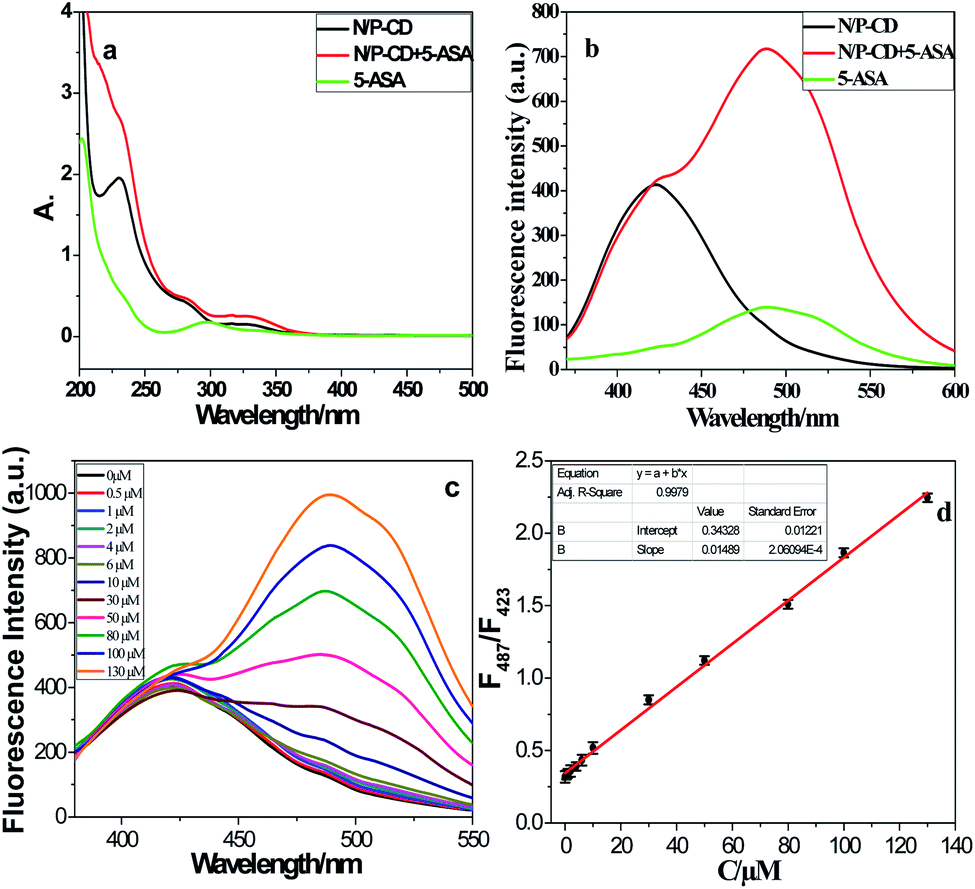 | ||
| Fig. 4 Absorption (a) and fluorescence (b) spectra of NPCDs with and without 5-ASA, the fluorescence spectra of adding 5-ASA in NPCDs (c), and the linear response of fluorescence change (F487/F423) on the concentration of 5-ASA (d). The error bars show the average of three separate measurements (d). | ||
The sensitivity for 5-ASA detection was studied in optimizing experimental conditions. There were materials ratio of 1:1, 180 °C for 10 h, and ultrapure water with pH = 7.0. The 5-ASA of different concentrations were injected into the NPCDs solution and at room temperature for 1 min. As shown in Fig. 4c, as can be seen that the fluorescence intensity of NPCDs increased in varying concentrations of 5-ASA (0, 0.5, 1.0, 2.0, 4.0, 6.0, 10, 30, 50, 80, 100, and 130 μM). It may be related to the complex formed based on electrostatic interaction after adding 5-ASA to the NPCDs solution. As shown in Fig. 4d, the measured fluorescence intensity signal has a good linear relationship with the 5-ASA concentration in the range of 0.5 to 130 μM, with a good regression coefficient (R2 = 0.9979). The fluorescence intensity was measured at 487 nm. According to IUPAC recommendations, the detection limit (LOD) estimated using equation 3.29SB/m was 0.13 μM. In this equation, SB and m represent the blank standard deviation (n = 11) and the slope of the linear calibration curve, respectively. It shows that NPCDs can be used as fluorescent probe for 5-ASA detection, and compared with other similar fluorescent sensors, it has the advantage of detecting 5-ASA.
Selectivity
In general, some substances may have potential interference in the actual sample detection. Therefore, specificity is a significant property for system capability evaluation. Firstly, the effect of common metal ions was evaluated, such as Fe3+, Cu2+, Hg2+, Ni2+, Cd2+, Cr3+, Zn2+, Ca2+, Pb2+, Ag+, Co2+, Mn2+, Mg2+, Ba2+ and Bi3+. As shown in Fig. S3a,† it can be found that the fluorescence intensity of NPCDs is hardly affected by these metal ions. In addition, the effects of amino acids also were studied, such as Ala, Leu, Glu, Asn, Tyr, His, Thr, Ser, Gly, Val, Thp, Mrt, Cys, and Tys. As shown in Fig. S3b,† it can be seen that the fluorescence of NPCDs was measured and hardly interfered with the detection of 5-ASA.The possible interference of small organic molecules structure similar with 5-ASA was also studied. These substances include 4-nitrochlorobenzene, benzaldehyde, 2-nitro-4,4′-diaminobiphenyl, p-chlorophenol, acetanilide, 2-aminophenol, salicylic, 3-ASA, 4-ASA and 5-ASA. In Fig. 5, only the fluorescence intensity of 5-ASA (50 μM) can be significantly increased, while other molecules at higher concentrations (200 μM) are not affected. In addition, as shown in Fig. S4,† it can be seen that 3-ASA and 4-ASA have no interference effect on the detection of 5-ASA. These results indicate that the fluorescent probe has good specificity for 5-ASA. Using ATP and p-toluidine as precursors to synthesize NPCDs is simpler and more direct than other methods. NPCDs can be used as fluorescent probe for rapidly and highly selective detection 5-ASA in the samples with similar structures without any modification.
 | ||
| Fig. 5 Selectivity test for the determination of 5-ASA in the presence of other organic molecules with structures similar to that of 5-ASA. | ||
Possible fluorescence mechanism
When molecules are excited by electrons through absorbing photons, the species can return to the ground state in several ways. One involves the emission of photons, which may cause the substance to fluorescence or phosphorescence. In this work, ATP and p-toluidine as precursors, NPCDs were prepared by hydrothermal method. ATP and p-toluidine are first cross-linked to form larger polymers, and then carbonized into NPCDs of a certain size.26 As shown in Fig. 6a, as the increase of 5-ASA concentration, the fluorescence intensity (ΔF) of 5-ASA and 5-ASA-NPCDs shows a linear response, respectively. It can be seen that for the quantitative detection of 5-ASA, small changes in fluorescence intensity and low sensitivity were obtained using only 5-ASA. When 5-ASA was added to NPCDs, however, the fluorescence intensity changes significantly and the sensitivity is high. It can be ascribed from good water solubility, intrinsic fluorescence and abundant surface groups of NPCDs. However, the main reason may be attributed to the small size of carbon quantum dots, which have a certain limiting effect. Therefore, when 5-ASA is added to NPCDs solution, 5-ASA will aggregate, which will result in restricted intramolecular motion and show a very strong fluorescence.20 Thereby there is a new fluorescence peak of NPCDs at 487 nm with the concentration increase of 5-ASA (Fig. 4a are shown). Therefore, 5-ASA can be detected more sensitively. At the same time, the fluorescence lifetime of NPCDs in the presence or absence of 5-ASA was measured. As shown in Fig. 6b, the lifetime was calculated to be 5.05 μs and 5.48 μs for NPCDs with and without 5-ASA, respectively. The average fluorescence delay time values are similar, which shows the fluorescence performance of NPCDs is not affected by 5-ASA. In contrast, NPCDs have a great influence on the emission intensity of 5-ASA. Therefore, the obvious change of fluorescence may be caused by aggregation induced emission (AIE) of 5-ASA on the surface of NPCDs. An AIE process may result from RIMs, J-aggregation, charge transfer, and excited-state intramolecular proton transfer (ESIPT). According to the literatures, the possible mechanism for AIE enhancement of 5-ASA may be owing to ESIPT.19,27,28 | ||
| Fig. 6 With the increase of 5-ASA concentration, the fluorescence intensity (F) with and without NPCDs shows a linear response (a). Fluorescence was recorded at an excitation/emission wavelength of 340/487 nm. The lifetime of NPCDs in the presence or absence of 5-ASA (b). | ||
Live subject statement
All the experiments involving human blood samples were approved by the Ethics Committee of Liaocheng University and performed in a strict accordance with the NIH guidelines (NIH Publication No. 85-23 Rev. 1985). We obtained informed consent for any experimentation with human subjects.Application
The application of NPCDs fluorescence probes for 5-ASA determination in drug of mesalazine enteric-coated tablets and blood were performed. The Table 1 shows the results about content of 5-ASA, recovery, and RSD. The recovery rate after addition of the standard is from 94.5 to 107.9%, and the RSD is from 0.26 to 5.08%. The results analysis shows that there is no significant difference between the added value and the detected value. Therefore, NPCDs will be apply to detect 5-ASA.| Present method | ||||
|---|---|---|---|---|
| Sample | Added μM | Found μM | Recovery% | RSD% |
| a Mean of three separate measurements. | ||||
| Mesalazine enteric-coated tablets | 0.0 | 6.99 ± 0.27 | — | 1.17 |
| 10.0 | 17.37 ± 0.31 | 104 | 2.43 | |
| 20.0 | 26.53 ± 0.16 | 97.7 | 1.69 | |
| 30.0 | 39.15 ± 0.43 | 107 | 5.08 | |
| Blood | 0 | 0.05 ± 0.32 | — | 0.92 |
| 2 | 1.94 ± 0.27 | 94.5 | 0.72 | |
| 6 | 6.06 ± 0.12 | 100.2 | 0.27 | |
| 10 | 10.84 ± 0.13 | 107.9 | 0.26 | |
Conclusions
In our work, we put forward a simple and rapid method for preparing NPCDs. This method uses ATP and p-toluidine as precursors. X-ray photoelectron spectroscopy (XPS) and Fourier infrared spectroscopy (FI-TR) were used to analyze the carbonyl, amine and amide functional groups on the surface of NPCDs. The NPCDs are spherically distributed with an average particle size of 1.8 ± 0.4 nm. NPCDs exhibit bright blue emissions with excitation/emission peaks at 340/423 nm and with moderate quantum yield (20.75%). When 5-ASA is added to NPCDs, 5-ASA fluorescence intensity is significantly enhanced owing to the AIE of 5-ASA but fluorescence intensity of NPCDs remained almost unchanged. Therefore, ratio fluorescence at F487/F423 was used for detection 5-ASA. For the fluorometric determination assay, there was a good linear relationship between F487/F423 and 5-ASA concentration between 0.50 and 130 μM (R2 = 0.9979). The detection limit was about 0.13 μM. Therefore, the developed ratio fluorescence method was successfully used to detect 5-ASA and the method is simple, sensitive and of low cost.Conflicts of interest
There are no conflicts to declare.Acknowledgements
The acknowledgements come at the end of an article after the conclusions and before the notes and references. This work was supported financially by Natural Science Foundation of China (91543206), Natural Science Foundation (ZR2014BQ017, ZR2015BM024, and 2013SJGZ07) and Tai-Shan Scholar Research Fund of Shandong Province and research foundation of Liaocheng University.Notes and references
- H. C. Yi and C. Y. Li, Russ. J. Electrochem., 2007, 43, 1377–1381 CrossRef CAS.
- E. L. Beckett, N. S. Lawrence, R. G. Evans and J. Davis, Talanta, 2001, 54, 871–877 CrossRef CAS.
- S. J. Kim, S. J. Wang, Y. J. Li and X. W. He, Anal. Methods, 2016, 8, 7780–7788 RSC.
- S. M. Ahmed and A. A. Elbashir, J. Anal. Bioanal. Tech., 2015, 8, 1000248 Search PubMed.
- B. Nigovic, M. Sadikovic and S. Juric, Talanta, 2016, 147, 50–58 CrossRef CAS.
- M. G. H. Laghari, Y. Darwis and A. H. Memon, Trop. J. Pharm. Res., 2014, 13, 1133–1139 CrossRef CAS.
- F. A. A. bdalla and A. A. Elbashir, Med. Chem., 2014, 4, 361–366 Search PubMed.
- G. Palumbo, S. Bacchi, L. Primavera, P. Palumbo and G. Carlucci, Biomed. Chromatogr., 2005, 19, 350–354 CrossRef CAS.
- J. Qin, X. Di, X. Wang and Y. P. Liu, Biomed. Chromatogr., 2015, 29, 261–267 CrossRef CAS.
- E. Pastorini, M. Locatelli, P. Simoni, G. Roda, E. Roda and A. Roda, J. Chromatogr. B: Anal. Technol. Biomed. Life Sci., 2008, 872, 99–106 CrossRef CAS.
- X. Y. Xu, R. Ray, Y. L. Gu, H. J. Ploehn, L. Gearheart, K. Raker and W. A. Scrivens, J. Am. Chem. Soc., 2004, 126, 12736–12737 CrossRef CAS.
- C. Q. Ding, A. W. Zhu and Y. Tian, Acc. Chem. Res., 2014, 47, 20–30 CrossRef CAS.
- B. F. Shi, Y. B. Su, L. L. Zhang, M. J. Huang, R. J. Liu and S. L. Zhao, ACS Appl. Mater. Interfaces, 2016, 8, 10717–10725 CrossRef CAS.
- L. Zhou, Y. H. Lin, Z. Z. Huang, J. S. Ren and X. G. Qu, Chem. Commun., 2012, 48, 1147–1149 RSC.
- P. Devi, S. Saini and K. H. Kim, Biosens. Bioelectron., 2019, 141, 111158 CrossRef CAS.
- Y. L. Cheng, M. S. Bai, J. Su, C. Q. Fang, H. Li, J. Chen and J. M. Jiao, J. Mater. Sci. Technol., 2019, 35, 1515–1522 CrossRef.
- Y. P. Wang, Q. L. Yue, L. X. Tao, C. Zhang and C.-Z. Li, Microchim. Acta, 2018, 185, 550 CrossRef.
- S. Liao, F. W. Zhu, X. Y. Zhao, H. Yang and X. Q. Chen, Sens. Actuators, B, 2018, 260, 156–164 CrossRef CAS.
- X. Y. Wang, P. S. Song, L. Peng, A. J. Tong and Y. Xiang, ACS Appl. Mater. Interfaces, 2015, 8, 609–616 CrossRef.
- C. T. Li, Y. L. Xua, J. G. Yang, Y. Chen, H. S. Kim, Q. Y. Cao and J. S. Kim, Sens. Actuators, B, 2017, 251, 617–623 CrossRef CAS.
- D. D. Su, M. K. Wang, Q. Liu, J. Y. Chen and X. G. Su, Sens. Actuators, B, 2019, 290, 163–169 CrossRef CAS.
- X. J. Gong, Y. Liu, Z. H. Yang, S. M. Shuang, Z. Y. Zhang and C. Dong, Anal. Chim. Acta, 2017, 968, 85–96 CrossRef CAS.
- Y. Liu, X. J. Gong, W. J. Dong, R. X. Zhou, S. M. Shuang and C. Dong, Talanta, 2018, 183, 61–69 CrossRef CAS.
- X. Fu, L. Sheng, Y. S. Yu, M. H. Ma, Z. X. Cai and X. Huang, Sens. Actuators, B, 2018, 269, 278–287 CrossRef CAS.
- Y. Q. Dong, H. C. Pang, H. B. Yang, C. X. Guo, J. W. Shao, Y. W. Chi, C. M. Li and T. Yu, Angew. Chem., Int. Ed., 2013, 52, 7800–7804 CrossRef CAS.
- Y. Zhang, Y. Wang, Y. F. Guan and L. Feng, Nanoscale, 2015, 7, 6348–6355 RSC.
- W. X. Tang, Y. Xiang and A. J. Tong, J. Org. Chem., 2009, 74, 2163–2166 CrossRef CAS.
- J. Mei, Y. N. Hong, J. W. Y. Lam, A. J. Qin, Y. H. Tang and B. Z. Tang, Adv. Mater., 2014, 26, 5429–5479 CrossRef CAS.
Footnote |
| † Electronic supplementary information (ESI) available. See DOI: 10.1039/d0ra10258j |
| This journal is © The Royal Society of Chemistry 2021 |