 Open Access Article
N/Fe/Zn co-doped TiO2 loaded on basalt fiber with enhanced photocatalytic activity for organic pollutant degradation
Lingxiao Yangb,
Lanmiao Lib,
Longguo Liab,
Chao Liuab,
Jun Liab,
Bo Lai *ac and
Naiwen Li
 *ab
*ab
aState Key Laboratory of Hydraulics and Mountain River Engineering, Sichuan University, Chengdu, Sichuan 610065, China. E-mail: linaiwen@scu.edu.cn; laibo@scu.edu.cn
bCollege of Water Resource & Hydropower, Sichuan University, Chengdu, Sichuan 610065, China
cSino-German Centre for Water and Health Research, Sichuan University, Chengdu 610065, China
First published on 26th January 2021
Abstract
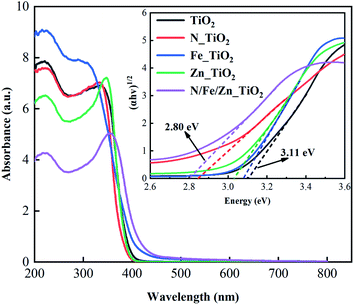
To avoid the loss of catalytic material powder, a loaded catalytic material of TiO2 with basalt fiber as the carrier (TiO2@BF) was synthesized by an improved sol–gel method. The TiO2@BF was doped with different contents of N, Fe and Zn elements and was used to degrade rhodamine B (RhB) under ultraviolet light. The physical characterization analysis indicated that the co-doping of the N, Fe and Zn elements had the effects of reducing grain size, increasing sample surface area, and narrowing the electronic band gap. The electronic band gap of nitrogen–iron–zinc co-doped TiO2@BF (N/Fe/Zn_TiO2@BF) was 2.80 eV, which was narrower than that of TiO2@BF (3.11 eV). The degradation efficiency of RhB with N/Fe/Zn_TiO2@BF as a photocatalyst was 4.3 times that of TiO2@BF and its photocatalytic reaction was a first-order kinetic reaction. Quenching experiments suggested that the reactive species mainly include photoinduced holes (h+), superoxide radicals (˙O2−) and hydroxyl radicals (˙OH). In brief, this study provides a prospective loaded catalytic material and routine for the degradation of organic contaminants in water by a photocatalytic process.
1 Introduction
At present, water pollution caused by man-made organic pollutants has become one of the key concerns all over the world.1–4 Large quantities of organic compounds, such as synthetic dyes and endocrine disruptors, originating from industries including textiles, plastics, pharmaceuticals, etc.,5,6 would have harmful effects on mankind and animal life in short or long periods of time. Water pollution caused by dye wastewater discharged from traditional industries, one of the most common contaminants, has attracted extensive attention.7 Rhodamine B (RhB), a typical pollutant of dye molecules,8 is difficult to be removed by self-purification of natural water systems because of its high stability and it greatly threatens human health due to its toxicity. Therefore, research into removing dye molecules in water has become a hot topic in recent years.Nowadays, common water treatment methods mainly include membrane filtration,9 coagulation sedimentation,10 electrochemical,11 advanced oxidation process,12,13 and biological treatment14 methods. Photocatalytic oxidation, an advanced oxidation process, could efficiently eliminate various harmful organic compounds. It has attracted extensive attention in the field of water environmental protection and restoration due to the advantages of low cost, easy operation, high efficiency, low consumption, no secondary pollution, and great damage to dye molecules.
In the study of photocatalytic oxidation to degrade pollutants, TiO2 nanoparticles15 are one of the most widely studied semiconductor photocatalysts in photocatalysis due to their strong oxidizing ability, chemical stability, safety, non-toxicity, and high photocatalytic potential.16,17 However, TiO2 has some intrinsic drawbacks in practical applications such as its wide band gap and charge carrier recombination, which result in low light utilization efficiency and photocatalytic activity in the visible region.18,19 Consequently, tremendous efforts have been devoted to improving the photocatalytic efficiency of TiO2 via modification, including doping modification,20 surface modification,21 dye sensitization,22 deposition of noble metals,23,24 semiconductor recombination,25 etc. In particular, metal doping26 and non-metal doping27 for TiO2 have proved to be the most effective methods and have been extensively studied.
In addition, TiO2 nanoparticles are difficult to recycle and reuse in applications because of their small particles. In order to solve the problem of catalyst recycling and reuse, many researchers have used different substances as carriers to support TiO2 to synthesize TiO2 loaded composites, such as activated carbon, glass fiber and carbon fiber.28–30 Basalt fiber (BF) is made of pure natural basalt ore as the raw material and its main component is SiO2, which has a similar structure to TiO2. Therefore, BF, which has similar mineral properties to TiO2, could adhere to TiO2 firmly. Generally, to synthesize TiO2 loaded composites, TiO2 nanoparticles need to be prepared first and then dispersed in a sol to carry out loading. The high temperature resistance and excellent physicochemical stability of BF allows it to be loaded in the intermediate step of TiO2 preparation and then calcined to obtain the composite material in one step, thereby increasing the loading efficiency of TiO2 and saving time and cost. To the best of our knowledge, no studies on TiO2 loaded on BF for the degradation of organic contaminants in water have been reported.
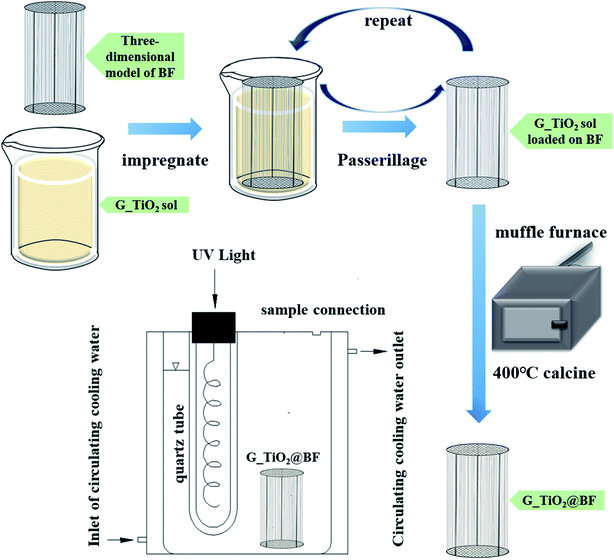
In the current study, a new three-dimensional structure model was made from BF and TiO2 with three doping elements of N, Fe, and Zn loaded on the BF to prepare a multi-element co-doped TiO2@BF composite material, which has a larger contact area with water and a higher light transmittance. The synthesized new multi-element doped G_TiO2@BF (in G_TiO2@BF, G represents the dopants N, Fe and Zn) composite material was characterized. Meanwhile, the doping substance combination and the effects of the dopant content (%) of different dopants were investigated, the photocatalytic performance of the synthesized material was tested for the degradation of RhB and the possible degradation mechanisms were studied.
2 Experimental materials and methods
2.1 Chemical reagents
Tetrabutyl titanate (≥98.5%), ethyl alcohol (≥99.5%, anhydrous), and nitric acid (65–68%) were used for TiO2 synthesis. Urea (≥99.0%), ZnO (≥98.0%), and ferric nitrate nonahydrate (≥98.5%) were used as reagents when doping and modifying TiO2. Rhodamine B (RhB) was used in the photocatalytic degradation experiment. 1,4-Benzoquinone (BQ, ≥98.5%), tert-butyl alcohol (TBA, ≥99.0%) and EDTA-2Na (≥99.0%) were used in the reactive species quenching experiments. All the reagents were from Chron Chemicals Co., Ltd. (Sichuan, China). Distilled water (resistance > 18.25 MΩ), used in all experiments, was provided by a water purification system (ULUPURE, China).2.2 Synthesis of the catalytic loaded composites
![[thin space (1/6-em)]](https://www.rsc.org/images/entities/char_2009.gif) :
:![[thin space (1/6-em)]](https://www.rsc.org/images/entities/char_2009.gif) n(Ti) = (6%, 8%, and 12%), n(Fe)
n(Ti) = (6%, 8%, and 12%), n(Fe)![[thin space (1/6-em)]](https://www.rsc.org/images/entities/char_2009.gif) :
:![[thin space (1/6-em)]](https://www.rsc.org/images/entities/char_2009.gif) n(Ti) = (0.03%, 0.3%, and 1%), and n(Zn)
n(Ti) = (0.03%, 0.3%, and 1%), and n(Zn)![[thin space (1/6-em)]](https://www.rsc.org/images/entities/char_2009.gif) :
:![[thin space (1/6-em)]](https://www.rsc.org/images/entities/char_2009.gif) n(Ti) = (0.5%, 2%, and 7%). The doping substances with different doping ratios were separately dissolved in 600 mL ethyl alcohol and then the mixed solution was used as an organic solvent. The remaining steps were consistent with the preparation of the sol. After the photocatalytic degradation of RhB with single doping of TiO2@BF, the optimal doping ratio was selected to be 8% N, 0.3% Fe and 2% Zn, and then the three materials were co-doped with an optimal doping ratio of N, Fe, and Zn to obtain the N/Fe/Zn_TiO2 sol.
n(Ti) = (0.5%, 2%, and 7%). The doping substances with different doping ratios were separately dissolved in 600 mL ethyl alcohol and then the mixed solution was used as an organic solvent. The remaining steps were consistent with the preparation of the sol. After the photocatalytic degradation of RhB with single doping of TiO2@BF, the optimal doping ratio was selected to be 8% N, 0.3% Fe and 2% Zn, and then the three materials were co-doped with an optimal doping ratio of N, Fe, and Zn to obtain the N/Fe/Zn_TiO2 sol.Fig. 1 presents the preparation steps of loading TiO2 on BF and the photocatalytic degradation reaction device. The BF model was based on a round wire mesh as a fiber guide bracket; three equal-height wires were used as a wire mesh fixed bracket and 126 basalt fiber bundles were fixed at 5 mm intervals on it. Every basalt fiber bundle was 27 cm in length and 0.5 mm in diameter.
2.3 Characterization
The surface morphology and fracture morphology of the sample were examined by scanning electron microscopy (SEM, S-450, Japan). Energy dispersive spectrometry (EDS, Aztec X-Max80, UK) was applied to the qualitative analysis of elements. The crystalline phases and grain size of the samples were characterized by X-ray diffraction (XRD, EMPYREAN, UK), using Cu Kα radiation (λ1 = 1.5406 Å, λ2 = 1.5444 Å), a monochromatic slit of 0.76 mm, a 2θ diffraction angle of 10° to 80° and a scan step of 0.03° s−1. The functional groups were analyzed by Fourier transform infrared spectroscopy (FT-IR, Nicolet 6700, USA). The molecular structural groups were analyzed by Raman spectra (RAMAN, LabRAM HR800, France). The surface composition and chemical state of the sample were investigated by the AXIS Supra multifunctional X-ray photoelectron spectrometer (XPS, KRATOS, UK), using a monochromatic X-ray source. The electronic band gaps of the synthesized photocatalysts were analyzed by UV-visible diffuse-reflectance spectroscopy (UV-vis/DRS, UV-3600, Japan). The samples used for characterization like TiO2 refer to powders scratched off from the fiber and those like TiO2@BF refer to layers loaded on basalt fibers.2.4 Photocatalytic degradation of RhB
The photocatalytic degradation of RhB was investigated under ultraviolet (UV) light in a photocatalytic dark box reactor. The experiments were performed in a 10 L cylindrical black box with a mercury lamp (42 W, λ = 235.7 nm) as the light source, and circulating water was adopted to control the reaction temperature at ambient temperature. In order to eliminate the disturbance of the adsorption, it is necessary to reach an adsorption/desorption equilibrium before turning on the light.31 After the samples of G_TiO2@BF (G represents the dopant) were added into 7 L RhB solution (5 mg L−1) for 30 min in the dark, the experiment was kept for 180 min under UV light. During the experiment, 50 mL of RhB solution was sampled at certain intervals and the supernatant solution was obtained at high-speed centrifugation before detecting the RhB concentration by spectrophotometry (V729, YOKE INSTRUMENT, China) at 554 nm. The degree of RhB degradation was expressed as Ct/C0, where Ct was the RhB concentration at the sampling time, and C0 was RhB concentration at the initial time. The stability and reusability experiment materials were washed with absolute ethanol and deionized water several times. The samples were calcined at 400 °C for 1 h before the next cycle experiment was carried out.3 Results and discussion
3.1 Physicochemical properties
Fig. 2(a) and (b) depict the microstructure and morphology of BF and TiO2@BF by SEM, from which it could be obviously observed that the fibers were wrapped with TiO2. There were many micropores on the surface of the synthesized N/Fe/Zn_TiO2@BF catalyst due to using urea as the N doping source. During the calcination process, urea could change to gas and escape, increasing the specific surface area of material. As shown in Fig. 2(c)–(h), it was confirmed that the O, Ti, N, Fe and Zn elements coexisted on the N/Fe/Zn_TiO2@BF.
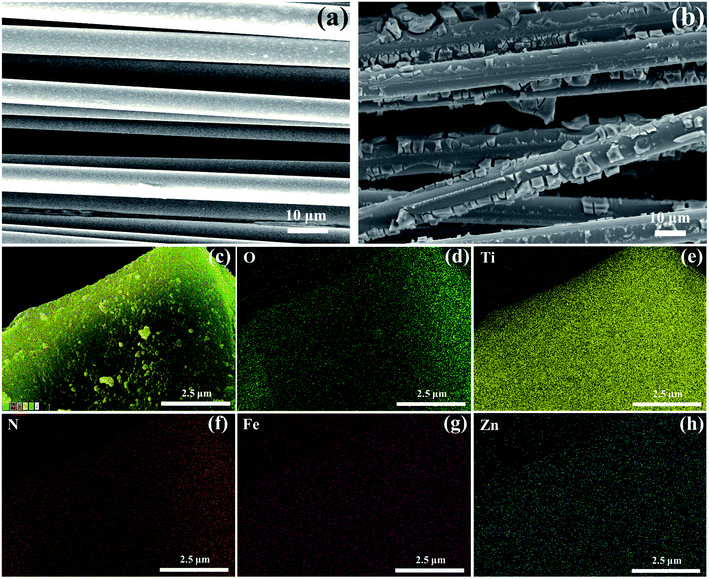 | ||
| Fig. 2 SEM micrographs for the samples: (a) BF and (b) TiO2@BF; EDS elemental mapping images of (c)–(h) N/Fe/Zn_TiO2@BF. | ||
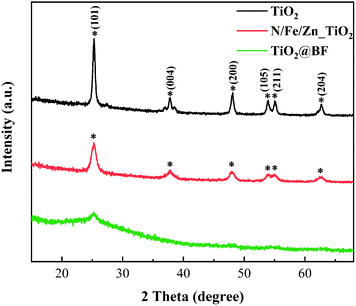
XRD is performed to characterize the crystal structure of the material. TiO2 was stripped from the BF surface to analyze its crystal phase due to the diffraction peak of BF covering that of TiO2. Fig. 3 depicts the XRD results of the synthesized TiO2 and N/Fe/Zn_TiO2 and TiO2@BF. The diffraction peak of synthesized TiO2 appeared at 2θ = 25.22° (101), 37.89° (004), 48.07° (200), 53.81° (105), 55.08° (211) and 62.63° (204), which matched well with the JCPDS NO: 21-1272. The result shows that the synthesized TiO2 was monocrystalline and in the pure anatase phase, which was confirmed by there being no diffraction peaks at 2θ = 27.5° (110) and 30.8° (121), corresponding to the rutile and brookite phase. The diffraction peak location of N/Fe/Zn_TiO2 also corresponded to the anatase phase, indicating that the doping of N, Fe and Zn did not change the crystal structure of pristine TiO2. In addition, the XRD spectra of N/Fe/Zn_TiO2 (Fig. 3) show no peaks of Zn oxide and Fe oxide.
The crystallite sizes were calculated from the stretching of the anatase (101) peaks by using the Scherrer formula as follows.
D = kλ/β![[thin space (1/6-em)]](https://www.rsc.org/images/entities/char_2009.gif) cos cos![[thin space (1/6-em)]](https://www.rsc.org/images/entities/char_2009.gif) θ θ
| (1) |
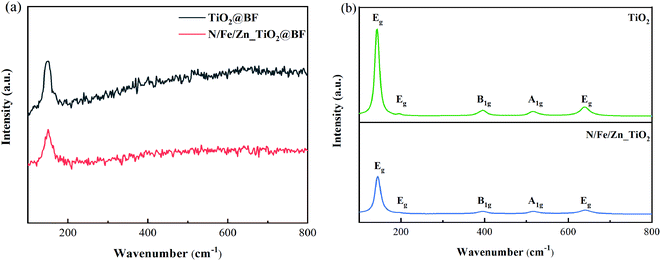
As shown in Fig. 4(a), it was difficult to observe the vibration modes of TiO2 and N/Fe/Zn_TiO2 due to the diffraction peak of BF covering that of TiO2 in the RAMAN spectra of the synthesized TiO2@BF and N/Fe/Zn_TiO2@BF. As displayed in Fig. 4(b), their TiO2 crystals were both in the anatase phases. As could be seen from Fig. 4(b), the positions of the characteristic bands in the synthesized TiO2 of 143.2, 197, 395.4, 515 and 639 cm−1 correspond to the vibration modes of Eg, Eg, B1g, A1g and Eg in the single crystal anatase phase, respectively. The result that only five vibration modes appeared was lower than the six Raman activation modes (A1g + 2B1g + 3Eg) reported by Ohsaka34 because the peaks at positions 513 and 515 cm−1 overlap; a similar result was also obtained by Choi35 and Cho.36 In Fig. 4(b), no characteristic bands were observed at 445 and 612 cm−1, indicating that the rutile phase did not exist in the prepared TiO2 sample. Compared with the characteristic peaks of TiO2, the characteristic peaks of N/Fe/Zn_TiO2 were weakened and the half-peak width increased due to the decrease of crystallinity size after doping, which was consistent with the XRD results.
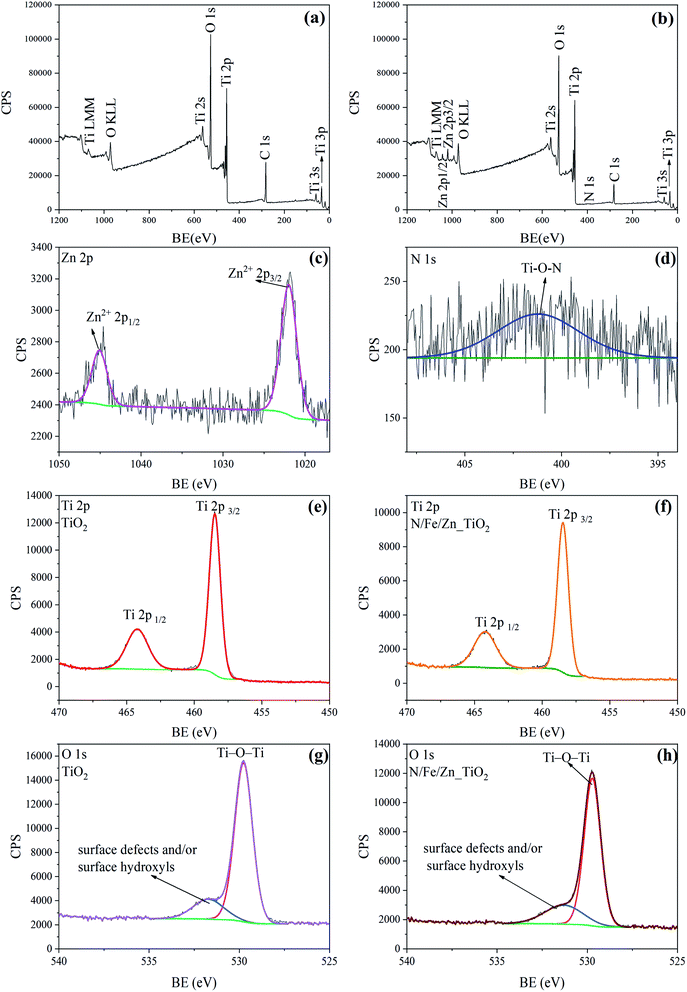
The real doping contents for N/Fe/Zn_TiO2@BF were calculated from the quantitative method of the XPS sensitivity factor by using the following formula.
| Cx = (Ax/Sx)/(ΣAi/Si) | (2) |
![[thin space (1/6-em)]](https://www.rsc.org/images/entities/char_2009.gif) 432.85, obtained from the XPS spectrum of N/Fe/Zn_TiO2@BF. When the concentration ratio was obtained, the molar ratio could be further calculated to be n(N)
432.85, obtained from the XPS spectrum of N/Fe/Zn_TiO2@BF. When the concentration ratio was obtained, the molar ratio could be further calculated to be n(N)![[thin space (1/6-em)]](https://www.rsc.org/images/entities/char_2009.gif) :
:![[thin space (1/6-em)]](https://www.rsc.org/images/entities/char_2009.gif) n(Ti) = 8% and n(Zn)
n(Ti) = 8% and n(Zn)![[thin space (1/6-em)]](https://www.rsc.org/images/entities/char_2009.gif) :
:![[thin space (1/6-em)]](https://www.rsc.org/images/entities/char_2009.gif) n(Ti) = 2%. The Fe peak was not detected due to the low Fe content in N/Fe/Zn_TiO2@BF. The real doping content of N/Fe/Zn_TiO2@BF obtained through the XPS analysis was the same as the theoretical doping content.
n(Ti) = 2%. The Fe peak was not detected due to the low Fe content in N/Fe/Zn_TiO2@BF. The real doping content of N/Fe/Zn_TiO2@BF obtained through the XPS analysis was the same as the theoretical doping content.
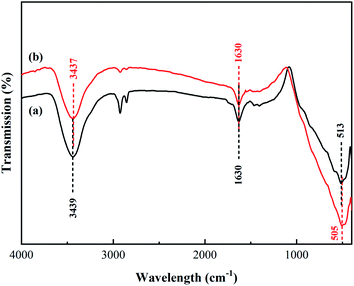
The FT-IR spectra of the synthesized TiO2 and N/Fe/Zn_TiO2 are shown in Fig. 6, which was used to analyze the functional groups of the samples. In Fig. 6(a), the peaks at 3439 cm−1 and 1630 cm−1 were formed by the stretching vibration of the water adsorbed on the surface, ˙OH or the H–OH bond of the COOH group, and the peak at 513 cm−1 was attributed to the characteristic Ti–O bond vibration of TiO2.43,44 In Fig. 6(b), compared with Fig. 6(a), there was a slight offset value at the characteristic peak of TiO2 and the absorption peak of the hydroxyl group. Combined with the results of the XRD and XPS, it indicated that N, Fe and Zn entered into the lattice of TiO2.
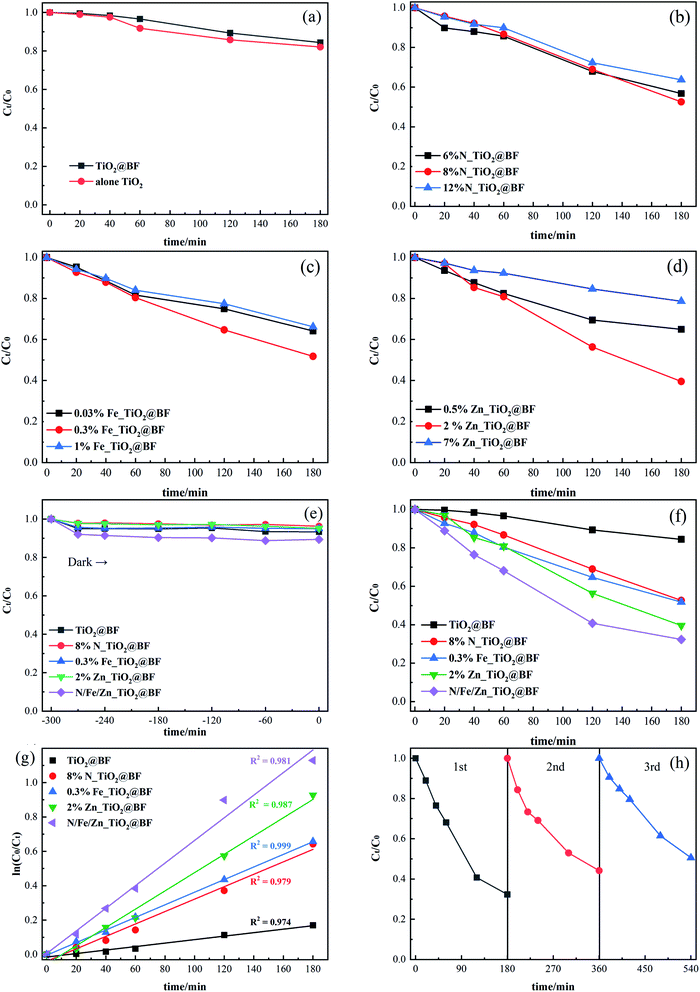
3.2 Photocatalytic degradation of RhB
As shown in Fig. 7(a), RhB removal by TiO2 (17.93%) alone was a little better than that of TiO2@BF (15.61%), which was due to the TiO2 in TiO2@BF being wrapped, leading to a lower actual amount of the catalyst working in the photocatalysis.The photocatalytic activities of three different proportions of TiO2@BF doped with N (N_TiO2@BF), Fe (Fe_TiO2@BF) and Zn (Zn_TiO2@BF) were evaluated as shown in Fig. 7(b–d), which show that when the doping ratios of N, Fe and Zn were 8%, 0.3% and 2%, respectively, the degradation effects of RhB under UV light for 3 hours were the best, reaching 47.40%, 48.20% and 60.45%, respectively. The reason why the degradation efficiency of the 8% N, 0.3% Fe and 2% Zn doping ratios was higher than the 12% N, 1% Fe and 7% Zn doping ratios, respectively, might be that when the doping concentration was too high, the doping substance could not easily enter the TiO2 lattice but instead gathered on the TiO2 surface, reducing the active sites.
Fig. 7(e) illustrates that the adsorption/desorption equilibrium was reached in 30 min. As shown in Fig. 7(f), the photocatalytic activities of N_TiO2@BF, Fe_TiO2@BF, and Zn_TiO2@BF on RhB degradation were all better than that of TiO2@BF under UV light. In particular, the degradation efficiency of RhB by N/Fe/Zn_TiO2@BF as the photocatalytic material was the best (67.67%), 4.33 times that of TiO2@BF, indicating that N, Fe and Zn element doping enhanced the photocatalytic degradation effect, which was consistent with the UV-vis/DRS characterization analysis results.
Fig. 7(g) shows that the photocatalytic degradation of RhB by 8% N_TiO2@BF, 0.3% Fe_TiO2@BF, 2% Zn_TiO2@BF and N/Fe/Zn_TiO2@BF conformed to a quasi-first-order kinetic equation. The degradation rate constant (k) of RhB in different processes and the TiO2 loading amounts for each sample are listed in Table 1. It was found that k8%N_TiO2@BF < k0.3% Fe_TiO2@BF < k2% Zn_TiO2@BF, and the k value of one element dopant of TiO2@BF was greater than the k value of TiO2@BF but less than the k value of N/Fe/Zn_TiO2@BF. The degradation rate constant of N/Fe/Zn_TiO2@BF was 7.04 times that of TiO2@BF, indicating that doping indeed accelerated charge transfer and effectively improved the photocatalytic activity. The analysis result of XRD and RAMAN that the crystallite sizes of N/Fe/Zn_TiO2 were smaller than TiO2 was consistent with this photocatalytic performance.
| Sample | Doping ratio | k × 10−3 (min−1) | TiO2 loading amount (mg cm−2) |
|---|---|---|---|
| TiO2@BF | — | 0.95 | 3.02 |
| N_TiO2@BF | 6.00% | 3.07 | 3.11 |
| 8.00% | 3.59 | 3.08 | |
| 12.00% | 2.50 | 3.08 | |
| Fe_TiO2@BF | 0.03% | 2.63 | 3.02 |
| 0.30% | 3.54 | 3.02 | |
| 1.00% | 2.34 | 3.06 | |
| Zn_TiO2@BF | 0.50% | 2.73 | 3.13 |
| 2.00% | 4.86 | 3.15 | |
| 7.00% | 1.33 | 3.08 | |
| N/Fe/Zn_TiO2@BF | — | 6.69 | 3.04 |
In order to estimate the reusability and stability of N/Fe/Zn_TiO2@BF for RhB removal, three recycling tests were conducted at the same experimental conditions. As shown in Fig. 7(h), the degradation effects of RhB were 67.67%, 55.70% and 55.84% in three consecutive cycle experiments, suggesting that N/Fe/Zn_TiO2@BF could maintain relative stability after the first cycle experiment.
3.3 Degradation mechanism analysis
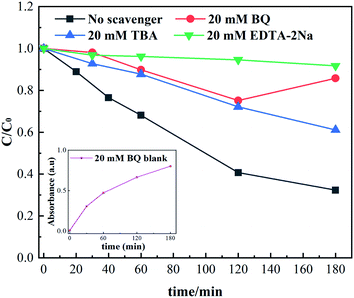
According to the results of the reactive species quenching experiments, it could be inferred that the h+ active species played a dominant role, while ˙O2− and ˙OH were the minor radicals in this photocatalytic system. When N/Fe/Zn_TiO2@BF was illuminated by UV light, electrons (e−) in the valence band (VB) were excited to the conduction band (CB), leaving holes (h+) in the VB, which could directly participate in the RhB degradation (eqn (3) and (4)). Meanwhile, the accumulated e− could capture O2 to obtain ˙O2− (eqn (5)), which could capture H+ generated by the ionization of H2O to form H2O2, and the generated ˙OH might cause the translation of the H2O2 (eqn (7)–(9)).47 The ˙O2− and ˙OH radicals are capable of destroying organic compounds (eqn (6) and (10)).
| N/Fe/Zn_TiO2@BF + hv → e− + h+ | (3) |
| h+ + RhB → degradation | (4) |
| e− + O2 → ˙O2− | (5) |
| ˙O2− + RhB → degradation | (6) |
| H2O → H+ + OH− | (7) |
| ˙O2− + 2H+ + e− → H2O2 | (8) |
| H2O2 + e− → OH− + ˙OH | (9) |
| ˙OH + RhB → degradation | (10) |
4 Conclusions
The N/Fe/Zn_TiO2@BF composites were synthesized by a combined sol–gel calcination method. N_TiO2@BF, Fe_TiO2@BF, Zn_TiO2@BF and N/Fe/Zn_TiO2@BF exhibited higher photoactivity towards the degradation of RhB under UV light irradiation compared to TiO2@BF. The degradation efficiency for RhB of N/Fe/Zn_TiO2@BF was 4.3 times that of TiO2@BF, and the degradation process of N/Fe/Zn_TiO2@BF was consistent with first-order kinetics with a k value 7.04 times that of TiO2@BF. The improved photoactivity was attributed to the synergistic effect of the N, Fe and Zn co-doping. The crystallite size of N/Fe/Zn_TiO2 was only 10.4 nm, while that of TiO2 without doping was 18.1 nm. There were more catalytic activity points with the specific surface area of N/Fe/Zn_TiO2@BF increasing greatly, resulting in the improved catalytic efficiency. The results of the EDS, XRD, RAMAN, XPS and FT-IR analysis indicated that the elements of N, Fe and Zn were doped into the crystal lattice of TiO2 without changing the anatase crystalline phase. In addition, N/Fe/Zn_TiO2@BF gained a narrower energy band gap (2.80 eV), which improved the photocatalytic activity. Reactive species quenching experiments indicated that h+ was the most important reactive species and ˙OH and ˙O2− played minor roles for the N/Fe/Zn_TiO2@BF photocatalysis processes in the degradation of RhB.Conflicts of interest
The authors declare that they have no known competing financial interests or personal relationships that could have appeared to influence the work reported in this paper.Acknowledgements
This work was supported by the Major Scientific and Technological Special Program of Sichuan Province, China (2018SZDZX0027 and 2019YFS0505) and the Major Science and Technology Application Project of Chengdu City, Sichuan Province, China (2019-YF09-00081-SN).References
- K. Wetchakun, N. Wetchakun and S. Sakulsermsuk, J. Ind. Eng. Chem., 2019, 71, 19–49 CrossRef CAS.
- L. Jiang, X. Hu, D. Yin, H. Zhang and Z. Yu, Chemosphere, 2011, 82, 822–828 CrossRef CAS.
- K. Lei, Y. Zhu, W. Chen, H. Pan, Y. Cao, X. Zhang and B. Guo, Environ. Int., 2019, 130, 104919 CrossRef CAS.
- A. M. Voigt, P. Ciorba, M. Döhla, M. Exner, C. Felder, E. Sib, D. Skutlarek, R. M. Schmithausen and H. A. Faerber, Int. J. Hyg. Environ. Health, 2020, 224, 113449 CrossRef CAS.
- P. S. Basavarajappa, S. B. Patil, N. Ganganagappa, K. R. Reddy, A. V. Raghu and C. V. Reddy, Int. J. Hydrogen Energy, 2020, 45, 7764–7778 CrossRef CAS.
- J. Zhang, B. Tang and G. Zhao, Appl. Catal., B, 2020, 279, 119364 CrossRef CAS.
- C. Hao, Y. Xu, M. Bao, X. Wang, H. Zhang and T. Li, J. Mater. Sci.: Mater. Electron., 2017, 28, 3119–3127 CrossRef CAS.
- X. Ding, L. Gutierrez, J. P. Croue, M. Li, L. Wang and Y. Wang, Chemosphere, 2020, 253, 126655 CrossRef CAS.
- W. Pronk, A. Ding, E. Morgenroth, N. Derlon, P. Desmond, M. Burkhardt, B. Wu and A. G. Fane, Water Res., 2019, 149, 553–565 CrossRef CAS.
- M. Zhang, F. Xiao, D. Wang, X. Xu and Q. Zhou, Sep. Purif. Technol., 2017, 182, 118–127 CrossRef CAS.
- S. Chen, N. Wang, L. Ma, T. Li, M. Willander, Y. Jie, X. Cao and Z. L. Wang, Adv. Energy Mater., 2016, 6, 1–9 CrossRef CAS.
- J. N. Liu, Z. Chen, Q. Y. Wu, A. Li, H. Y. Hu and C. Yang, Sci. Rep., 2016, 6, 1–9 CrossRef.
- J. R. Kim and E. Kan, J. Environ. Manage., 2016, 180, 94–101 CrossRef CAS.
- F. A. El-Gohary and G. Kamel, Ecol. Eng., 2016, 94, 268–274 CrossRef.
- T. H. Kim, G.-M. Go, H.-B. Cho, Y. Song, C.-G. Lee and Y.-H. Choa, Front. Chem., 2018, 6, 1–10 CrossRef.
- Y. Yan, W. Shi, Z. Yuan, S. He, D. Li, Q. Meng, H. Ji, C. Chen, W. Ma and J. Zhao, J. Am. Chem. Soc., 2017, 139, 2083–2089 CrossRef CAS.
- H. Zong, T. Zhao, G. Zhou, R. Qian, T. Feng and J. H. Pan, Catal. Today, 2019, 335, 252–261 CrossRef CAS.
- A. R. Khataee and M. B. Kasiri, J. Mol. Catal. A: Chem., 2010, 328, 8–26 CrossRef CAS.
- Y. N. Li, Z. Y. Chen, M. Q. Wang, L. zhen Zhang and S. J. Bao, Appl. Surf. Sci., 2018, 440, 229–236 CrossRef CAS.
- L. Kong, Z. Jiang, C. Wang, F. Wan, Y. Li, L. Wu, J. F. Zhi, X. Zhang, S. Chen and Y. Liu, ACS Appl. Mater. Interfaces, 2015, 7, 7752–7758 CrossRef CAS.
- J. Wen, X. Li, W. Liu, Y. Fang, J. Xie and Y. Xu, Chin. J. Catal., 2015, 36, 2049–2070 CrossRef CAS.
- L. Pan, J. J. Zou, X. Zhang and L. Wang, J. Am. Chem. Soc., 2011, 133, 10000–10002 CrossRef CAS.
- J. B. Priebe, J. Radnik, A. J. J. Lennox, M. M. Pohl, M. Karnahl, D. Hollmann, K. Grabow, U. Bentrup, H. Junge, M. Beller and A. Brückner, ACS Catal., 2015, 5, 2137–2148 CrossRef CAS.
- R. Zanella, E. Avella, R. M. Ramírez-Zamora, F. Castillón-Barraza and J. C. Durán-Álvarez, Environ. Technol., 2018, 39, 2353–2364 CrossRef CAS.
- S. Luan, D. Qu, L. An, W. Jiang, X. Gao, S. Hua, X. Miao, Y. Wen and Z. Sun, Sci. Bull., 2018, 63, 683–690 CrossRef CAS.
- R. Lu, Y. Wei, C. Chen and T. Wu, J. Alloys Compd., 2019, 790, 99–108 CrossRef CAS.
- Y. Xiao, X. Sun, linyu Li, J. Chen, S. Zhao, C. Jiang, L. Yang, L. Cheng and S. Cao, Chin. J. Catal., 2019, 40, 765–775 CrossRef CAS.
- A. Mishra, A. Mehta, S. Kainth and S. Basu, J. Alloys Compd., 2018, 764, 406–415 CrossRef CAS.
- E. Rezaei, R. Azar, M. Nemati and B. Predicala, J. Environ. Chem. Eng., 2017, 5, 5902–5911 CrossRef CAS.
- A. Buzarovska, C. Gualandi, A. Parrilli and M. Scandola, Composites, Part B, 2015, 81, 189–195 CrossRef CAS.
- J. M. Wu and Q. E. Zhao, Appl. Surf. Sci., 2020, 527, 146779 CrossRef CAS.
- W. Li and T. Zeng, PLoS One, 2011, 6, 2–7 Search PubMed.
- K. H. Leong, P. Monash, S. Ibrahim and P. Saravanan, Sol. Energy, 2014, 101, 321–332 CrossRef CAS.
- T. Ohsaka, J. Phys. Soc. Jpn., 1980, 48, 1661–1668 CrossRef CAS.
- H. C. Choi, Y. M. Jung and S. Bin Kim, Vib. Spectrosc., 2005, 37, 33–38 CrossRef CAS.
- H. W. Cho, K. L. Liao, J. S. Yang and J. J. Wu, Appl. Surf. Sci., 2018, 440, 125–132 CrossRef CAS.
- Y. Kim, J. Lee, H. Jeong, Y. Lee, M. H. Um, K. M. Jeong, M. K. Yeo and M. Kang, J. Ind. Eng. Chem., 2008, 14, 396–400 CrossRef CAS.
- P. Bharathi, M. Krishna Mohan, V. Shalini, S. Harish, M. Navaneethan, J. Archana, M. Ganesh Kumar, P. Dhivya, S. Ponnusamy, M. Shimomura and Y. Hayakawa, Appl. Surf. Sci., 2020, 499, 143857 CrossRef CAS.
- X. Cheng and L. Yang, Arabian J. Chem., 2016, 9, S1706–S1711 CrossRef CAS.
- M. Sreedhar, I. N. Reddy, P. Bera, D. Ramachandran, K. Gobi Saravanan, A. M. Rabel, C. Anandan, P. Kuppusami and J. Brijitta, Appl. Phys. A: Mater. Sci. Process., 2015, 120, 765–773 CrossRef CAS.
- M. Sreedhar, I. Neelakanta Reddy, C. V. Reddy, J. Shim and J. Brijitta, Mater. Sci. Semicond. Process., 2018, 85, 113–121 CrossRef CAS.
- X. Wang, F. Wang, C. Bo, K. Cheng, J. Wang, J. Zhang and H. Song, Appl. Surf. Sci., 2018, 453, 320–329 CrossRef CAS.
- L. Ma, I. Jia, X. Guo and L. Xiang, Chin. J. Catal., 2014, 35, 108–119 CrossRef CAS.
- Z. He, W. Que, J. Chen, Y. He and G. Wang, J. Phys. Chem. Solids, 2013, 74, 924–928 CrossRef CAS.
- W. Wang, Z. Zeng, G. Zeng, C. Zhang, R. Xiao, C. Zhou, W. Xiong, Y. Yang, L. Lei, Y. Liu, D. Huang, M. Cheng, Y. Yang, Y. Fu, H. Luo and Y. Zhou, Chem. Eng. J., 2019, 378, 122132 CrossRef CAS.
- R. Li, M. Cai, Z. Xie, Q. Zhang, Y. Zeng, H. Liu, G. Liu and W. Lv, Appl. Catal., B, 2019, 244, 974–982 CrossRef CAS.
- W. Wang, Q. Niu, G. Zeng, C. Zhang, D. Huang, B. Shao, C. Zhou, Y. Yang, Y. Liu, H. Guo, W. Xiong, L. Lei, S. Liu, H. Yi, S. Chen and X. Tang, Appl. Catal., B, 2020, 273, 119051 CrossRef CAS.
| This journal is © The Royal Society of Chemistry 2021 |

