DOI:
10.1039/D0RA09926K
(Paper)
RSC Adv., 2021,
11, 14700-14709
Highly sensitive and selective colorimetric detection of dual metal ions (Hg2+ and Sn2+) in water: an eco-friendly approach†
Received
23rd November 2020
, Accepted 29th March 2021
First published on 20th April 2021
Abstract
Application of an alliin-based precursor for the synthesis of silver nanoparticles (Ag NPs) which is an emerging, reliable and rapid sensor of heavy metal ion contaminants in water is reported here. The Ag NPs were characterized by using UV-visible spectroscopy, X-ray diffraction, transmission electron microscopy, X-ray photoelectron spectroscopy and Raman spectroscopy analysis techniques. The Ag NPs simultaneously and selectively detect Hg2+ and Sn2+ ions from aqueous solution. The sensitivity and selectivity of the prepared Ag NPs towards other representative transition-metal ions, alkali metal ions and alkaline earth metal ions were also studied. For more precise evidence, a density functional theory study was carried out to understand the possible mechanism and interaction in the detection of Hg2+ and Sn2+ by Ag NPs. The limits of detection for Hg2+ and Sn2+ ions were found as 15.7 nM and 11.25 nM, respectively. This assay indicates the possible use of garlic extract-synthesized Ag NPs for sensing Hg2+ and Sn2+ in aqueous solution very significantly. So, the simple, green, eco-friendly and easy method to detect the dual metal ions may further lead to a potential sensor of heavy metal ion contaminants in water of industrial importance.
Introduction
Heavy metals usually refer to elements with atomic weight and density higher than 5 times that of water. Some of these metallic compounds are considered highly toxic to humans and other organisms. Extensive use of these metals or their compounds in industrial, agricultural, domestic and health sectors releases them in the environment, raising health and environmental concerns.1 Mercury (Hg) is a heavy metal that is reported to be hazardous in some forms. However, metallic Hg is still used in thermometers, barometers, batteries, electrical appliances, dental fillings, some religious remedies etc. Some inorganic mercury compounds are used as fungicides, cosmetics, antiseptics, paints, tattoo dyes etc.2,3 All Hg compounds that are discharged in the environment ultimately end up in soil or surface water.1 Likewise, plant products may also contain Hg derived from some sprays with Hg compounds as one of the components.4
Elemental Sn has significant applications with other elements like Al, Fe, Cu etc. in brass, bronze and solder. One of the major applications of Sn compounds is as intermediate materials for the synthesis of organo-Sn compounds and for electroplating composites. Organo-Sn compounds are extensively used as stabilizing agents in the preparation of materials like PVC, as homogenous catalysts for polyurethane foam formation, for glass coating, and as pesticides and disinfectants. However, use of certain organo-Sn compounds is discontinued due to their toxicity and hazardous nature in the environment.5,6 Naturally occurring Me–Sn are formed from inorganic Sn by the action of mainly soil- and sediment-dwelling bacteria and other microorganisms.7,8
Stannous chloride (SnCl2) is most commonly available in packed food, cold beverages, pesticides, toothpaste etc. It interrupts ossification in the fetal skeleton and may cause complete post-implantation loss.9 Certain organo-Sn compounds like trimethyl-Sn and triethyl-Sn are reported as highly neurotoxic.10 Butyl-Sn and octyl-Sn are known to impair the immune system in different animal groups. Likewise, anaemia is reported in rats with oral exposure to some of the organo-Sn compounds like dibutyltin dichloride, tributyltin oxide, or dioctyltin dichloride which also causes teratogenic effects in rat embryo and induces carcinogenicity.11
Therefore, monitoring of Hg2+ and Sn2+ ion level which varies with source is important to protect human and environmental health. Many techniques including HPLC, electrochemical, fluorescence and colorimetric methods are used to detect heavy and hazardous metals in the environment and water.12–14 Many of these can detect even trace amounts of contaminants. But, these are expensive and need complicated setups or involve tedious processes. Colorimetric sensors are cheaper with comparatively easier processing methods.15
Developing a robust system for detecting Hg2+ and Sn2+ with high sensitivity and selectivity against other common metal ions dissolved in water has been a challenge in recent years. From an environmental point of view, the development of a low-cost, simple, selective and sensitive technique of detection of these ions becomes very important. Therefore, the present study attempts to assess selective and sensitive detection of Hg2+ and Sn2+ ions using phyto-synthesized silver nanoparticles (Ag NPs). Here, garlic (Allium sativum), a common spice and medicinal plant, was used to synthesize the Ag NPs. Garlic is widely consumed as spice and medicine throughout the world in many cultures and traditions over centuries of human civilization. It is also used in Ayurvedic medicine for treatment of different diseases.16 Garlic contains various organo-S compounds, responsible for its specific flavour, aroma and medicinal properties. Alliin is the major S compound present in garlic. The alliin content in garlic cloves is reported as ∼8 g kg−1.17 Garlic has several advantages compared to other reducing agents. It is commonly available throughout the year and widely available. It is also available worldwide. It is easy to preserve at normal temperature. It has a significant advantage compared to other biomaterials for reduction of Ag+ ions. However, it is transformed to allicin(diallylthiosulfinate) rapidly by the action of the enzyme alliinase after crushing or cutting garlic cloves.18,19 Accordingly, hot extraction was carried out of garlic paste in our study to avoid this transformation at about 60 °C.
Here, it is proposed to synthesize Ag NPs using garlic extract that contains alliin as the major bioactive ingredient. The synthesized Ag NPs were further used for highly selective sensing of Hg2+ and Sn2+ metal ion contaminants in water. In addition, a density functional theory (DFT) study was carried out to support the experimental evidence and to reveal a possible mechanism for the sensing of the metal ions. For precise application or practical utility of our method, the experiment was done for water samples collected from three ponds of different locations of Arunachal Pradesh.
Results and discussion
Formation of Ag NPs
The formation of Ag NPs was characterized by using UV-visible spectra. The Ag NPs were synthesized using garlic extract (Fig. 1). After addition of garlic extract, the colourless AgNO3 solution turned to a brownish colour. This indicates the action of the garlic extract as a reducing agent to form Ag NPs.20 The absorption spectrum of the Ag NPs was bell-shaped with a peak at a wavelength of 420 nm (Fig. 2A). This band corresponds to the typical surface plasmon resonance (SPR) of conducting electrons from the surface of Ag NPs and was used to confirm the reduction of Ag+ to Ag0.21–24 The SPR peak for synthesized Ag NPs was also reported at a wavelength of 420 nm in previous studies.25,26
 |
| | Fig. 1 Schematic diagram of formation of Ag NPs from garlic extract. | |
 |
| | Fig. 2 (A) UV-visible spectra and (B) XRD pattern of formation of Ag NPs. | |
X-ray diffraction (XRD)
The crystalline nature of the Ag NPs was characterized by using the XRD technique. There were four well-defined characteristic diffraction peaks at 2θ values of 38.16°, 44.54°, 64.82° and 77.56° (Fig. 2B). These characteristic peaks revealed the reflection planes (111), (200), (220) and (311) of face-centred cubic (FCC) structure of crystalline metallic Ag as per JCPDS file no. 04-0783.27,28 This is also supported by our previously reported results.22 In the presence of Hg2+ and Sn2+ ions the peaks at 38.16°, 44.54°, 64.82° and 77.56° disappear due to the disappearance of Ag NPs. This is shown in Fig. S1 [ESI†].
Raman spectroscopy
The Raman spectrum of the Ag NPs was recorded to find out the possible surface-bound functional groups of the active compounds in garlic extract (alliin) associated with the stabilization of Ag NPs (Fig. 3). The broad band at 1580 cm−1 revealed asymmetric C![[double bond, length as m-dash]](https://www.rsc.org/images/entities/char_e001.gif) O stretching vibrations of carboxyl (O–CO) group. This peak indicates that the active molecule of garlic extract is bound to the surface of the Ag NPs through formation of chemical bond between Ag and carboxylate (–COO−) group of alliin. The shoulder peak at 2350 cm−1 may be due to CC stretching.29,30 Raman analysis was also carried out for Ag NPs + Hg2+ and Ag NPs + Sn2+ mixtures. The spectra are shown in Fig. 3. The peak at 1585 cm−1 for Ag NPs + Hg2+ and Ag NPs + Sn2+ revealed the presence of CO stretching vibration of carboxylate ion. The peak 2350 cm−1 may be due to CC stretching of alliin molecule. The peak is sharper compared to that of Ag NPs synthesized via alliin. This may be due to surface alliin molecules becoming more labile and Ag0 state disappearing in the presence of Hg2+ and Sn2+.31,32
O stretching vibrations of carboxyl (O–CO) group. This peak indicates that the active molecule of garlic extract is bound to the surface of the Ag NPs through formation of chemical bond between Ag and carboxylate (–COO−) group of alliin. The shoulder peak at 2350 cm−1 may be due to CC stretching.29,30 Raman analysis was also carried out for Ag NPs + Hg2+ and Ag NPs + Sn2+ mixtures. The spectra are shown in Fig. 3. The peak at 1585 cm−1 for Ag NPs + Hg2+ and Ag NPs + Sn2+ revealed the presence of CO stretching vibration of carboxylate ion. The peak 2350 cm−1 may be due to CC stretching of alliin molecule. The peak is sharper compared to that of Ag NPs synthesized via alliin. This may be due to surface alliin molecules becoming more labile and Ag0 state disappearing in the presence of Hg2+ and Sn2+.31,32
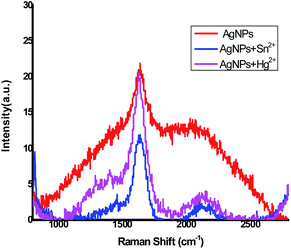 |
| | Fig. 3 Raman spectra of Ag NPs, AgNPs + Hg2+ and AgNPs + Sn2+. | |
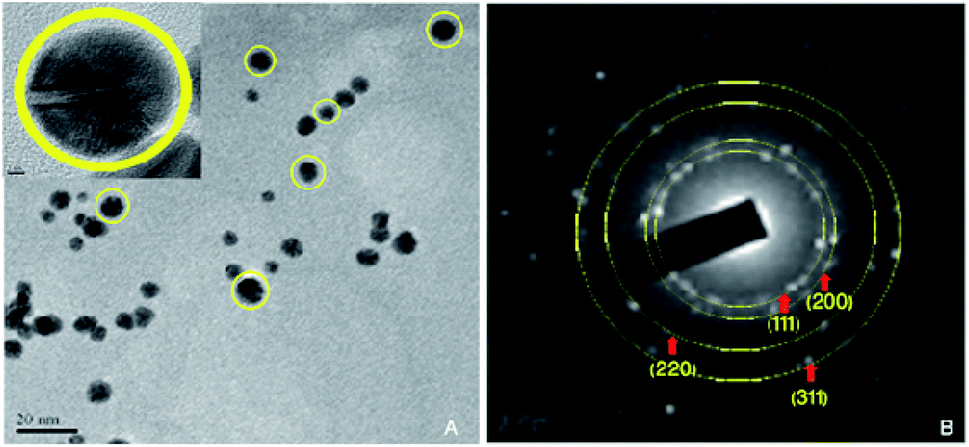
Transmission electron microscopy (TEM) analysis
The Ag NPs were further characterized by TEM analysis. The TEM analysis revealed that the Ag NPs are spherical in shape and with sizes in the range 2.0 ± 0.3 to 17.6 ± 0.6 nm. The average size of the NPs is 10.3 nm. This is supported by reported literature.21–24 Fig. 4A indicates the presence of spherical Ag NPs in the system. The inset of Fig. 4A shows the HR-TEM image with a scale of 2 nm which reveals the spherical surface pattern of Ag NPs. The diffraction pattern of the Ag nanocrystal surface is shown in Fig. 4B. The diffraction pattern reveals the (111), (200), (220) and (311) planes of Ag crystalline surface.21,22
 |
| | Fig. 4 (A) TEM image of Ag NPs with scale bare of 20 nm. (B) Diffraction pattern of Ag NPs. | |
X-ray photoelectron spectroscopy (XPS)
XPS was used to interpret the chemical nature and surface constituents of the Ag NPs synthesized using aqueous garlic extract. The survey scan shows the existence of Ag, O, C, S and N elements. The atomic composition of elements was found as: C 1s – 58.78%, O 1s – 34.4%, N 1s – 5.51%, Ag 3d – 0.37% and S 2p – 0.05%. Fig. 5A presents an XPS spectrum of the Ag NPs with a range of 0–1300 eV. The HR-XPS core-level spectra of S(2s), C(1s), Ag(3d), N(1s), and O(1s) are shown in Fig. 5B–F. The Ag 3d region shows two characteristic peaks at 372.9 eV and 366.9 eV (Fig. 5B) that occur due to the spin orbital splitting representing Ag 3d3/2 and Ag 3d5/2 core levels, respectively.33,34 The result suggests the formation the Ag NPs. Fig. 5C presents the HR-XPS spectrum for the N(1s) region. The binding energy was recorded at 398.9 eV. Fig. 5D presents the HR-XPS spectrum of the O(1s) region. Here, a peak at 532.2 eV was observed for the Ag–O bond.35 The Ag–O bond was formed due to strong interaction between a vacancy in the d-orbital of Ag and the active biomolecule present in the extract of Allium sativum. The peak seen at binding energy of 531.6 eV shows the existence of SO and O–CO bonds.34 Fig. 5E depicts the C(1s) spectrum that refers to bonds with C atoms. Here, peaks were noted at 283.8 eV and 285.2 eV ascribed to C–O and CO, respectively.34 Fig. 5F presents the S(2p) spectrum showing the existence of S at 167.5 eV for S 2p3/2. The binding energy of S corresponds to established data for S 2p.36
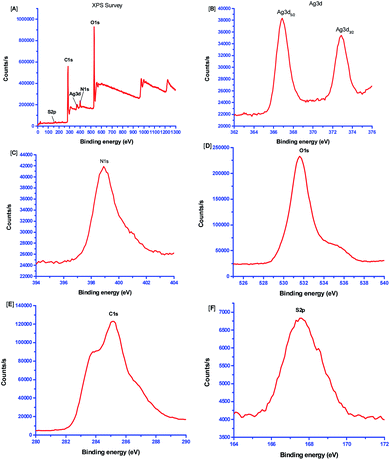 |
| | Fig. 5 (A) XPS spectrum of Ag NPs and high-resolution XPS spectra of (B) Ag 3d core levels, (C) N (1s), (D) O (1s), (E) C (1s), (F) S (2p) regions. | |
Metal ion sensitivity of the Ag NPs
The aqueous solution of the synthesized Ag NPs was brown in colour which may be ascribed to the excited vibrations of the SPR band. The SPR peak was recorded at 420 nm. The colour of the freshly prepared Ag NPs solution turns from brown to colourless gradually on addition of Hg2+ and Sn2+ ions. Response of Ag NPs to other metal ions did not show changes in the SPR band (Fig. 6). The metal ions Fe2+, Ni2+, Pd2+, Pb2+, Na+, Al3+, Zn2+, K+, Cu2+, Ca2+, Ba2+, Sn2+ and Hg2+ were taken to evaluate the sensitivity of Ag NPs. But, except Hg2+ and Sn2+, the other metal ions did not show any sensitivity towards the as-synthesized Ag NPs. In this case, 0.2 ml of 1 mM salt solution of metal ion was added to a 3 ml solution of Ag NPs at similar experimental conditions. Fresh solution of Ag NPs was used for detecting the metal ions. The study revealed that the colour of the Ag NPs solution turns from brownish to colourless on addition of freshly prepared Hg2+ and Sn2+ ions.
 |
| | Fig. 6 UV-visible spectra of Ag NPs after addition of different metal ion solutions. The colour of the solutions is shown in the inset photograph. | |
The results show that the presence of standard solution of Fe2+, Ni2+, Pd2+, Pb2+, Na+, Al3+, Zn2+, K+, Cu2+, Ca2+ and Ba2+ ions does not cause apparent changes in the SPR band and colour of Ag NPs solution, in contrast to Hg2+ and Sn2+ that turn the colour of the solution from brown to colourless. Experiments to detect Hg2+ and Sn2+ ions were performed using UV-visible spectroscopic and XRD methods. The change in colour with respect to time is shown in Fig. 6. The colour of the solution is yellowish brown in the absence of Hg2+ and Sn2+ ions. The Hg2+ ion has a closed-shell d10 and this configuration does not exhibit significant optical spectroscopic property. In the presence of 10 μl of 1 mM Hg2+ and Sn2+ ions the colour of the Ag NPs solution disappears. This is accompanied by broadening of the SPR band. The colourless solution did not show the peaks at 38.04°, 45.82°, 64.62° and 77.4° corresponding to the reflection planes (111), (200), (220) and (311) of the FCC structure of Ag NPs [Fig. S1, ESI†]. This indicates that the Ag NPs disappeared in the presence of Hg2+ and Sn2+ ions.
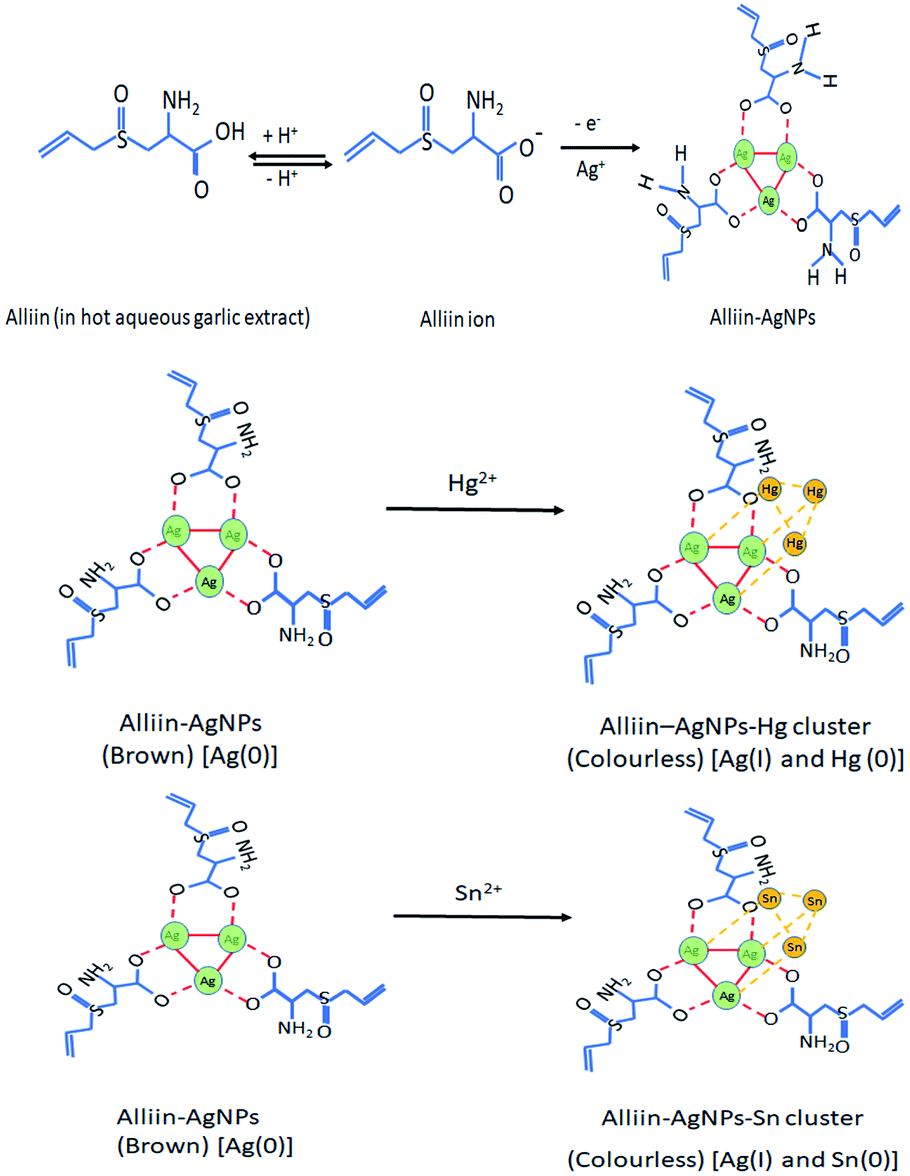
Possible mechanism of Ag NPs synthesis and binding with Hg2+ and Sn2+ ions
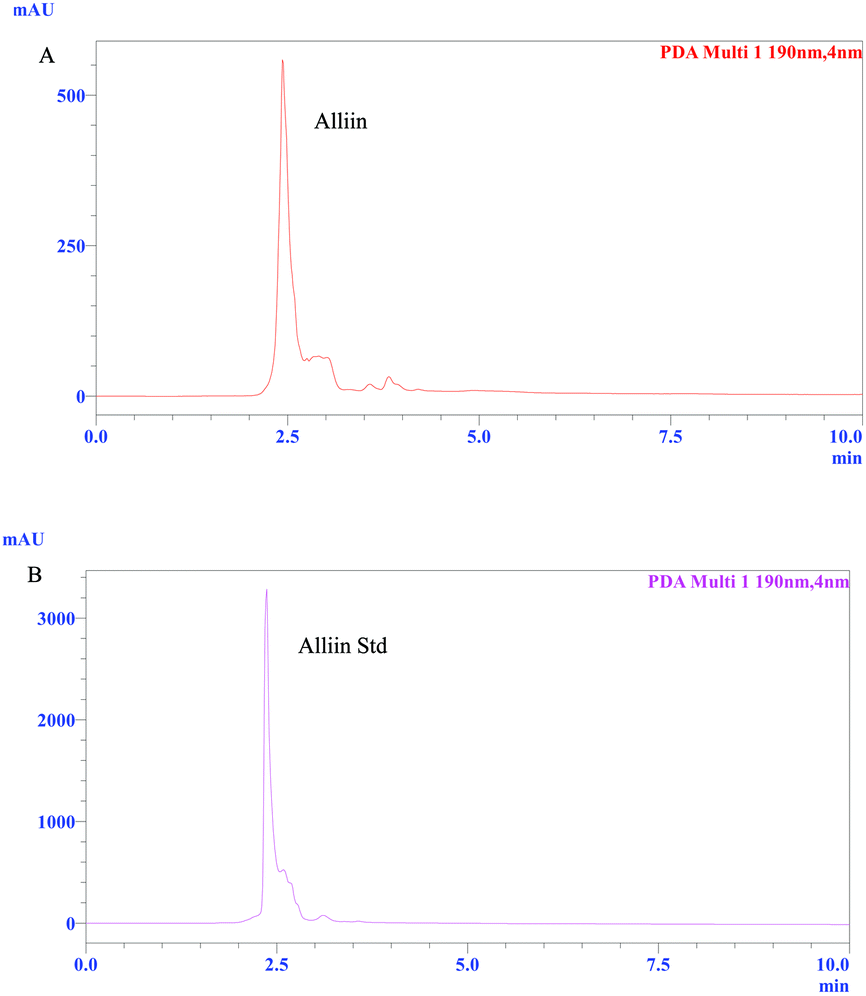
In present study, the garlic paste was boiled immediately after grinding. This destroyed the enzyme activity of alliinase to convert alliin to allicin.17,18 Therefore, alliin was involved as stabilizing agent of the synthesized Ag NPs. In this regard, HPLC analysis was done for further confirmation about the presence of major bioactive constituent (alliin) which may play a major role in synthesis and stabilization of the Ag NPs. The HPLC results clearly revealed the presence of alliin instead of allicin in this study (Fig. 7A and B). The peak at retention time of 2.45 min in Fig. 7A revealed the presence of alliin in garlic extract as major constituent. The HPLC trace of standard alliin is shown in Fig. 7B where the retention time is found at 2.45 min. In both cases the HPLC was run with the solvent system consisting of A![[thin space (1/6-em)]](https://www.rsc.org/images/entities/char_2009.gif) :B (80:20) (acetonitrile:water with 0.2% phosphoric acid).
:B (80:20) (acetonitrile:water with 0.2% phosphoric acid).
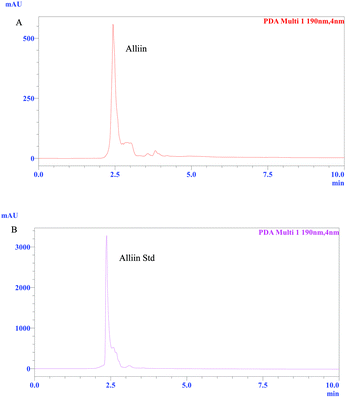 |
| | Fig. 7 HPLC traces of (A) garlic extract and (B) alliin standard. | |
Hence, alliin is the major chemical constituent of hot aqueous garlic extract. So, it plays significant role in the synthesis of Ag NPs as reported in Fig. 8. Here, one Ag+ ion directly attaches with one carboxylate ion of alliin which may further form a cluster of three Ag0 ions with three carboxylate ions of alliin. After addition of Hg2+ and Sn2+ ions, the solution becomes colourless. This results in degradation of the Ag NPs in the solution as indicated by UV-visible spectroscopy and XRD study. Based on these observations, it may be stated that these phenomena may be due to a redox reaction between Ag0 and Hg2+ with standard potentials of 0.8 eV (Ag+/Ag) and 0.85 eV (Hg2+/Hg), respectively.37 Similar phenomena may also be attributed to Sn2+ ion. It is also expected that added Hg2+ and Sn2+ ions to the freshly prepared Ag NPs replaced the stabilizing compound alliin.
 |
| | Fig. 8 Schematic illustration of proposed synthesis of Ag NPs using hot aqueous garlic extract and analytical detection of mercury ion (Hg2+)/stannous ion (Sn2+) using synthesized Ag NPs. | |
For more precise evidence, a DFT study was carried out to understand the possible interaction of alliin with Ag ions during formation of Ag NPs. A similar study was also conducted for analysing the optimized nanocluster in sensing Hg2+ and Sn2+ ions. The calculation reveals that the interaction of Ag0 nanocluster with alliin stabilizes the cluster. The calculated stabilization energy is 18.4 kcal mol−1. This energy is sufficient to hold together the Ag0 nanocluster. This nanocluster also interacts with Hg0 in its oxidized form, i.e., Hg2+ state. Fig. 9 shows the optimized geometry of the Ag+ nanocluster interacting with each of Hg2+ and Sn2+. It is also to be noted that while interacting with Hg2+, alliin separates from the Ag+ nanocluster. The interaction energy of Ag+ nanocluster with Hg2+ is calculated to be 7.6 kcal mol−1 while it is 8.3 kcal mol−1 for Sn2+. Similar phenomena are also expected for interaction between Ag NPs and the Sn2+ ion.
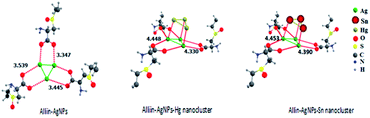 |
| | Fig. 9 Optimized geometry of Ag(0) nanocluster stabilized by alliin ion and the Ag(I)–Hg(0) and Ag(I)–Sn(0) interactions. Kinetics for binding Ag NPs with Hg2+ and Sn2+. | |
To estimate the kinetics of the binding of Hg2+ and Sn2+ ions with Ag NPs, we studied the time-dependent absorbance from the UV-visible absorption spectra of the Ag NPs in the presence of different concentrations of Hg2+ and Sn2+ ions. We recorded the time-dependent UV-visible spectra at intervals of every 5 min. The absorbance of Ag NPs + Hg2+ and Ag NPs + Sn2+ was found to decrease with increasing time (Fig. 10A and B) in similar reaction conditions. This also corresponds to a decrease of the rate constant (Table 1) with decreasing concentration of Hg2+ and Sn2+ ions. When the concentration of metal ion increases, the Ag NPs released the bioactive compound, i.e. alliin, simultaneously, then formed a cluster with Ag0 ion. The mechanism has already been discussed in the previous section. The same phenomenon was observed in the case of Sn2+ ions.
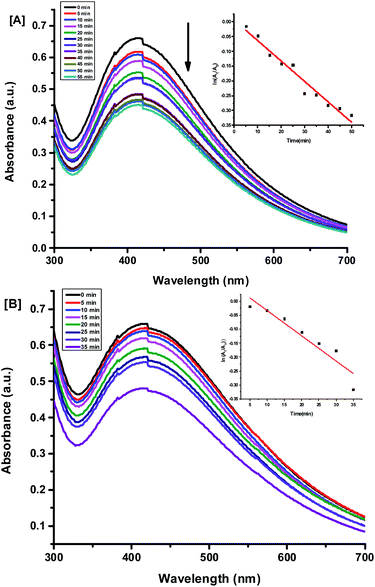 |
| | Fig. 10 Effect of kinetics on UV-visible absorption spectra of Ag NPs in the presence of (A) 5 nM Hg2+ and (B) 5 nM Sn2+ and at time intervals of 5 minutes. | |
Table 1 Rate constant for binding of Ag NPs with Hg2+ and Sn2+ at different concentrations
| No. |
Concentration |
Rate constant (K) (min−1) |
| 1 |
10 nM Hg2+ |
0.01434 |
| 2 |
5 nM Hg2+ |
0.00689 |
| 3 |
1 nM Hg2+ |
0.00508 |
| 4 |
10 nM Sn2+ |
0.00907 |
| 5 |
5 nM Sn2+ |
0.00791 |
| 6 |
1 nM Sn2+ |
0.00674 |
Effect of pH in sensing of Hg2+ and Sn2+ ions
The effect of pH in sensing the metal ions, i.e. Hg2+ and Sn2+, was investigated in Ag NPs solution at 4.0, 7.0 and 9.0, respectively. At pH = 4.0 the Ag NPs solution turned colourless faster after addition of Hg2+ and Sn2+. This was indicated by a rapid decrease in absorbance of the solution. At pH = 9.0 the Ag NPs solution became colourless slowly compared to at pH 4.0 and 7.0 for both metal ions. The results indicated a decrease in rate of the reaction with increase of pH. The pH-specific colorimetric change was also noted for other Ag NPs.38 The rate constant of the reaction is shown in Table 2.
Table 2 Rate constant for binding of Ag NPs with Hg2+ and Sn2+ at different pH
| No. |
|
pH |
Rate constant (K) (min−1) |
| 1 |
Hg2+ |
4.0 |
0.00924 |
| 2 |
|
7.0 |
0.00621 |
| 3 |
|
9.0 |
0.00168 |
| 4 |
Sn2+ |
4.0 |
0.00853 |
| 5 |
|
7.0 |
0.00560 |
| 6 |
|
9.0 |
0.00147 |
Limit of detection (LoD) of Hg2+ and Sn2+ ions by Ag NPs
The sensitivity and the minimum detectable concentration of Hg2+ in aqueous solution were evaluated by colour change of the system, and monitoring the UV-visible absorption. Different concentrations of aqueous solutions of Hg2+ and Sn2+ ions were added to a solution of the Ag NPs (3 ml). The experiment was carried out at room temperature (25 °C). The LoD for Hg2+ and Sn2+ was determined using the SPR peak of Ag NPs at 420 nm.
From Fig. 11 and 12, it was observed that the absorption peak of Ag NPs decreases with increasing concentration of Hg2+ and Sn2+ ions and there is a linear relationship (Y = 0.0366X + 0.2301, R2 = 0.8821; and Y = 0.0234X + 0.1170, R2 = 0.9386, respectively) between the changes of absorbance and the concentration of Hg2+ and Sn2+ ions over the range 1–15 nM at 403 nm and 1–11 nM at 405 nm, respectively (Fig. 11 and 12). The synthesized Ag NPs can be used for the colorimetric detection of Hg2+ and Sn2+ with LoD of 15.70 nM and 11.25 nM, respectively, which are very significant results compared to reported data (Tables 3 and 4).
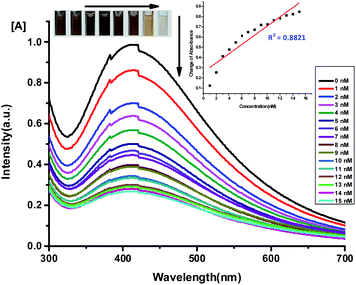 |
| | Fig. 11 UV-visible absorption spectra of Ag NPs upon addition of Hg2+ solution of various concentrations (1.0–16 nM). The inset shows the absorbance versus concentration of Hg2+. | |
 |
| | Fig. 12 UV-visible absorption spectra of Ag NPs upon addition of Sn2+ solution of various concentrations (1.0–11 nM). The inset shows the absorbance versus concentration of Sn2+. | |
Table 3 Comparison of LoD for Hg(II) analysis using the proposed Ag NPs protocol with previously reported methods
| Probe |
LoD/M (reference) |
| A. Ligand spectrophotometry |
| (i) Rhodamine derivative |
77 nM (ref. 39) |
| (ii) Ruthenium complexes |
100 nM (ref. 40) |
|
| B. Electrochemical detection |
| (i) AgNPs |
8.43 μM (ref. 41) |
|
| C. Nanomaterial spectrophotometry |
| (i) AuNPs |
750 nM (ref. 40) |
| (ii) AuNPs |
55 nM (ref. 42) |
| (iii) AuNPs |
10000 nM (ref. 43) |
| (iv) AuNPs |
20000 nM (ref. 44) |
| (v) AgNPs |
800 nM (ref. 45) |
| (vi) AgNPs |
2200 nM (ref. 46) |
| (vii) AgNPs |
85000 nM (ref. 47) |
| (viii) AgNPs |
1500 nM (ref. 48) |
| (ix) AgNPs |
300 nM (ref. 49) |
| (x) AgNPs |
5 nM (ref. 50) |
| (xi) AgNPs |
17 nM (ref. 51) |
| (xii) AgNPs |
0.007 mg L−1 (ref. 52) |
| (xiii) AgNPs |
6.2 ppb (ref. 53) |
| (xiv) AgNPs |
100 nM (ref. 54) |
| (xv) AgNPs |
6.25 ppb (ref. 55) |
| (xvi) AgNPs |
15.70 nM (present study) |
Table 4 Comparison of LoD for Sn(II) analysis using the proposed Ag NPs protocol with previously reported methods
| Probe |
LoD/M (reference) |
| A. HPLC |
| (i) Reversed phase HPLC |
1.4 ppb (ref. 56) |
|
| B. Inductively coupled plasma optical emission spectrometry (ICP OES) |
| (i) Direct method |
0.0036 mg L−1 (ref. 57) |
| (ii) Hydride generation |
0.0006 mg L−1 (ref. 57) |
|
| C. Nanomaterial spectrophotometry |
| (i) AgNPs |
0.036–0.040 μM (ref. 58) |
| (ii) AgNPs |
11.25 nM (present study) |
Determination of Hg2+ and Sn2+ in water samples
To study the practical utility of the developed method for sensing and detection of heavy metal ion contaminants in water, three water samples were collected from ponds of different locations of Arunachal Pradesh. Detection of Hg2+ and Sn2+ in pond water with added Fe2+, Ni2+, Pd2+, Pb2+, Na+, Al3+, Zn2+, K+, Cu2+, Ca2+ and Ba2+ ions showed mean absorbance of 0.486 ± 0.007 nm for solution with added Hg2+, 0.3789 ± 0.005 nm for solution with added Sn2+, and 0.4884 ± 0.0089 for solution containing both Hg2+ and Sn2+. The relative standard deviations for water samples from the three ponds were calculated as 1.488%, 1.430% and 1.638%, respectively, for these solutions. A t-test also showed a statistically significant difference for these absorbance values at <0.01% confidence level (F = 288.74). These results show that the proposed method has great potential for the sensing of Hg2+ and Sn2+ in environmental samples.
Experimental
Chemicals and reagents
Garlic was purchased from Naharlagun market, Arunachal Pradesh, India. Silver nitrate (AgNO3) and alliin were purchased from Sigma-Aldrich (USA). Metal salts of Al(NO3)3, AgNO3, Cr2O3, FeCl3, KCl, FeSO4·7H2O, CuCl2, NaCl, NiCl2, Zn(NO3)2, and Pb(NO3)2 were purchased from Merck India Ltd.
Preparation of garlic extract
A paste was prepared by grinding 40 g of peeled garlic bulb and mixing in 400 ml deionized water. The mixture was shaken using a magnetic stirrer at 60 °C for 45 minutes. The mixture was cooled to room temperature (24–25 °C) and filtered using Whatman filter paper (Cat no 1004 150) with pore size 20–25 μm. The filtrate part was used for further experiments.
Synthesis of Ag NPs
The filtrate (hereafter called garlic extract) was used for synthesizing Ag NPs. 10 ml of 1 mM AgNO3 solution was mixed with 2 ml garlic extract. After 48 h, the solution turned brownish indicating the formation of Ag NPs. In order to study the formation of Ag NPs, UV-visible absorption spectra were recorded using a spectrophotometer at wavelengths of 300–700 nm (Fig. 1).
High-performance liquid chromatography (HPLC) analysis
For determining the major bioactive molecules present in the aqueous extract, HPLC experiment was performed. The garlic extract was prepared in water as mentioned above. The flow rate was 1 ml min−1 and the injection volume was 20 μl. The mobile phase was a binary solvent system consisting of A:B (80:20) (acetonitrile:water with 0.2% phosphoric acid) which was sonicated for almost 15 minutes and degassed. The temperature of the column was maintained at 30 °C. The compounds in the chromatographic analysis were identified by comparing with standard compounds using the retention time and the absorption spectrum profile.
Characterization of the synthesized Ag NPs
The Ag NPs were characterized using various techniques such as UV-visible spectroscopy, XRD, TEM, and Raman spectroscopy. The formation of Ag NPs was monitored using UV-visible spectroscopy in which UV-visible spectra were recorded in the range between 300 and 700 nm (model: Lamda 25, Switzerland). The HPLC experiment was done using a Shimadzu Prominence HPLC instrument (LC-20AP), with PDA detector (200–800 nm) and an analytical column of modified silica gel (C18 column, 5 μM pore size). XRD analysis was done using a Rigaku X-ray diffractometer (model: ULTIMA IV, Rigaku, Japan) with a Cu K X-ray source (1.54056 Å) at a generator voltage of 40 kV, current 40 mA with scanning rate of 2° min−1. High-resolution TEM images were captured using a JEOL model 2100 EX (Japan) operated at a voltage of 200 kV. XPS analysis was carried out with an ESCALAB Xi + e (Thermo Fisher Scientific Pvt. Ltd, UK) to determine the elemental composition, empirical formula, chemical state and electronic state of the elements within the nanoparticles. Lastly, Raman spectra were obtained with a Thermo-Scientific DXR2 smart Raman at an excitation wavelength of 532 nm.
Detection of metal ions using synthesized Ag NPs
To study the metal ion detection and sensing capacity of the green-synthesized freshly prepared Ag NPs, 1 mM Fe2+, Ni2+, Pd2+, Pb2+, Na+, Al3+, Zn2+, K+, Cu2+, Ca2+, Ba2+, Sn2+, Hg2+ were added to 5 ml Ag NPs solution. The changes in the UV-visible absorption spectra were monitored at room temperature (25 °C) accordingly.
Estimation of LoD for Hg2+ and Sn2+ ions
The sensitivity and the minimum detectable concentration of the Ag NPs were studied by using UV-visible absorption spectra at different concentrations of Hg2+ (1–15 nM) and Sn2+ (1–11 nM) in aqueous solution at room temperature (25 °C). Total of 3 ml of Ag NPs solution diluted with deionized water (0.2 times) was taken for the detection of both metal ions. The respective amount of metal ion solution was added to the solution. The absorption was determined at 403 nm and 405 nm, respectively. The LoD was estimated using the UV-visible absorption spectra of Ag NPs with characteristic peak at 420 nm. Changes in absorption were monitored with variation of concentration: 1–15 nM and 1–11 nM for Hg2+ and Sn2+, respectively. The LoD was calculated using the standard formula:59
where SD = standard deviation of response (peak area) and S = slope of the calibration curve.
Kinetics for binding of Hg2+ and Sn2+ with Ag NPs
The reaction kinetics and rate were studied using absorption spectra of Hg2+ and Sn2+ solutions at different time intervals and concentrations. The rate constant was estimated from the slope of the regression plot with time versus ln(At/A0), where At and A0 are the absorbance at time t and 0, respectively (Table 5).60
Table 5 Comparison of calculated amount of Hg2+ and Sn2+ with actual value
| Parameter |
AgNPs + 2 nM Hg2+ |
AgNPs + 2 nM Sn2+ |
| Change in absorption compared to AgNPs (Y) |
0.299 |
0.170 |
| Calculated concentration (nM) (X) |
1.882 |
2.261 |
| Regression model |
Y = 0.0366X + 0.2301 |
Y = 0.0234X + 0.1170 |
| R2 |
0.8821 |
0.9386 |
| Pearson's coefficient |
0.9436 |
0.9719 |
Impact of pH on detection of Hg2+ and Sn2+ ions
The pH value of the synthesized Ag NPs solution was 6.4. It was tuned to 4.0, 7.0 and 9.0 by adding buffer capsule of 4.0, 7.0 and 9.0, respectively, in the Ag NPs solution. The experiment was carried out at room temperature, i.e. 25 °C. Briefly, 5.00 ml of Ag NPs solution was taken. 10 μl of 1 mM Hg2+ and Sn2+ ion solution was added where pH was maintained using a buffer tablet. The absorbance was measured at each of 5, 10, 15, 20, 25 and 30 min.
Synthesis and sensing mechanism for binding Hg2+ and Sn2+
A plausible mechanism of the synthesis of Ag NPs and detection of metal ions using the nanomaterial was predicted from previous literature, characteristics of the synthesized Ag NPs and theoretical DFT study of optimized geometry.
Computational details
All the structures were fully optimized without any symmetry constraint at the M06-2X level of theory.61 The effective core potential basis set LANL2DZ was used for Ag, Hg and Sn atoms, while the 6-31+G* basis set was used for all other main group elements. Frequency calculations were also performed to check the nature of the stationary states. All structures were found to be at their local minima with all real values of the Hessian matrix. All these calculations were performed using the GAUSSIAN 16 suite of programs.62
Preparation of water samples
Water samples were collected from Lekhi (27°12′17.23′′ N, 93°73′35.73′′ E, altitude 281 m), Doimukh (27°14′03.52′′ N, 93°78′28.39′′ E, altitude 283 m) and Naharlagun (27°06′16.81′′ N, 93°41′42.65′′ E, altitude 200 m), Arunachal Pradesh. Suitable amounts of 1 mM standard solutions of Hg2+, Sn2+ and other metal ions were added to these collected samples, mixed thoroughly and filtered. The water samples were analysed following the procedures described above.
Conclusions
A very simple, cost-effective, highly selective and sensitive, rapid colorimetric method for detection of Hg2+ and Sn2+ using alliin-mediated garlic extract-synthesized Ag NPs has been exploited in this work. The reported probe (Ag NPs) showed high selectivity and sensitivity for Hg2+ and Sn2+ ions over several other metal ions. The Hg2+ and Sn2+ ions successfully induced the transformation of Ag+ to Ag0 NPs via complex formation yielding a blue shift in the SPR peak accompanying a colour change from brown to colourless. The LoD for Hg2+ and Sn2+ ions were found as 15.7 nM and 11.25 nM, respectively, which is very significant compared to reported information so far. The kinetics for the binding of Hg2+ and Sn2+ ions has also been reported in this study. The prepared probe (Ag NPs) represents a very significant game-changing analytical method for detection of Hg2+ and Sn2+ ion contaminants in water. The mechanism of the protocol is strongly supported by DFT study. The result shows that the proposed method has great potential for the sensing of Hg2+ and Sn2+ in environmental samples.
Author contributions
Rintumoni Paw: conceptualization, data curation, investigation, methodology, formal analysis, resources, visualization, writing – original draft, writing – review & editing. Moushumi Hazarika: validation. Purna K. Boruah: characterization. Amlan Jyoti Kalita: software, data analysis. Ankur K. Guha: validation, software. Manash R. Das: characterization. Chandan Tamuly: conceptualization, methodology, supervision, visualization, writing – review & editing.
Conflicts of interest
The authors declare that they have no known competing financial interests or personal relationships that could have appeared to influence the work reported in this paper.
Acknowledgements
The authors acknowledge the Director, CSIR-North East Institute of Science & Technology Jorhat Assam for providing facilities and valuable suggestions (ref NMN-202145) and R. Paw thanks CSIR New Delhi for the Junior Research Fellowship/Financial Assistance to perform the presented work. C. Tamuly thanks to Dr Hiren Gogoi, Assist Prof., Dept of Zoology, RGU, Doimukh, Arunachal Pradesh, SEED DIvision, New Delhi and NMPB, New Delhi for their support and help.
References
- P. B. Tchounwou, C. G. Yedjou, A. K. Patlolla and D. J. Sutton, in Molecular, Clinical and Environmental Toxicology ed. A. Luch. Springer, Basel, 2012, Experientia Supplementum, vol. 101, pp. 133–164 Search PubMed.
- G. Guzzi and C. A. La Porta, Toxicol, 2008, 244, 1–12 CrossRef CAS PubMed.
- K. M. Rice, E. M. Walker Jr, M. Wu, C. Gillette and E. R. Blough, J. Prev. Med. Public Health, 2014, 47, 74–83 CrossRef PubMed.
- Y. S. Hong, Y. M. Kim and K. E. Lee, J. Prev. Med. Public Health, 2012, 45, 353–363 CrossRef PubMed.
- ATSDR (Agency for Toxic Substances and Disease Registry), Toxicological Profile for Tin and Tin Compounds. U.S. Department of Health and Human Services, Atlanta, 2005 Search PubMed.
- T. Gajda and A. Jancso, in Metal Ions in Life Sciences ed. A. Sigel, H. Sigel and R. K. O Sigel, Royal Society of Chemistry, Cambridge, 2010, ch. 4, vol. 7, pp. 111–151 Search PubMed.
- E. Dopp, L. M. Hartmann, A. M. Florea, A. W. Rettenmeier and A. V. Hirner, Crit. Rev. Toxicol., 2004, 34, 301–333 CrossRef CAS PubMed.
- A. V. Hirner and A. W. Retenmeier, Met. Ions Life Sci., 2010, 7, 465–521 CAS.
- A. I. El-Makawy, S. M. Girgis and W. K. B. Khalil, Mutat. Res., Genet. Toxicol. Environ. Mutagen., 2008, 657, 105–110 CrossRef CAS PubMed.
- B. Michalke, S. Halbach and V. Nischwitz, J. Environ. Monit., 2009, 11, 939–954 RSC.
- E. Dopp, A. W. Rettenmeier, R. H. Kretsinger and V. N. Uversky, in Encyclopedia of Metalloproteins, ed. E. A. Permyakov, Springer, New York, 2013 Search PubMed.
- D. Martín-Yerga, M. B. González-García and A. Costa-García, Talanta, 2012, 116, 1091–1104 CrossRef PubMed.
- S. Lin, W. Zhu, Y. Jin and K. B. Crozier, Nano Lett., 2013, 13, 559–563 CrossRef CAS PubMed.
- Y. Lu, S. Feng, X. Liu and L. Chen, J. Nanomater., 2013, 984831, DOI:10.1155/2013/984831 , 1–8 .
- G. Chen, Z. Guo, G. Zeng and L. Tang, Analyst, 2015, 140, 5400–5443 RSC.
- E. Block, J. Dane, S. Thomas and R. Cody, J. Agric. Food Chem., 2010, 58, 4617–4625 CrossRef CAS PubMed.
- T. Miron, T. Bercovici, A. Rabinkov, M. Wilchek and D. Mirelman, Anal. Biochem., 2004, 331, 364–369 CrossRef CAS PubMed.
- S. H. Omar and N. A. Al-Wabel, Saudi Pharm. J., 2010, 18, 51–58 CrossRef CAS PubMed.
- A. Shang, S. Cao, X. Xu, R. Ren-You Gan, G. Tang, H. Corke, V. Mavumengwana and H. Li, Foods, 2019, 8, 246 CrossRef CAS PubMed.
- A. L. González, C. Noguez, J. Beránek and A. S. Barnard, J. Phys. Chem. C, 2014, 118, 9128–9136 CrossRef.
- C. Tamuly, M. Hazarika, M. Bordoloi and M. R. Das, Mater. Lett., 2013, 102–103, 1–4 CrossRef CAS.
- C. Tamuly, M. Hazarika, M. Bordoloi, P. K. Bhattacharyya and R. Kar, Spectrochim. Acta, Part A, 2014, 132, 687–691 CrossRef CAS PubMed.
- A. Hebeish, M. H. El-Rafie, F. A. Abdel-Mohdy, E. S. Abdel Halim and H. E. Emam, Carbohydr. Polym., 2010, 82, 933–941 CrossRef CAS.
- Z. A. Ali, R. Yahya, S. D. Sekaran and R. Puteh, Adv. Mater. Sci. Eng., 2016, 4102196 Search PubMed.
- I. Barwal, P. Ranjan, S. Kateriya and S. C. Yadav, J. Nanobiotechnol., 2011, 9, 56 CrossRef CAS PubMed.
- W. Yu and H. Xie, J. Nanomater., 2012, 435873 Search PubMed.
- S. Asghari, S. A. Johari, J. H. Lee, Y. S. Kim, Y. B. Jeon, H. J. Choi, M. C. Moon and I. J. Yu, J. Nanobiotechnol., 2012, 10, 14 CrossRef CAS PubMed.
- R. A. Raza, Z. Kanwal, A. Rauf, A. N. Sabri, S. Riaz and S. Naseem, Nanomater, 2016, 6, 74 CrossRef PubMed.
- A. J. Kora, R. B. Sashidhar and J. Arunachalam, Carbohydr. Polym., 2010, 82, 670–679 CrossRef CAS.
- N. Biswas, S. Kapoor, H. S. Mahal and T. Mukherjee, Chem. Phys. Lett., 2007, 444, 338–345 CrossRef CAS.
- J. A. Buledi, S. Amin, S. I. Haider, M. I. Bhanger and A. R. Solangi, Environ. Sci. Pollut. Res., 2020 DOI:10.1007/s11356-020-07865-7.
- S. Singh, A. Halder, O. Sinha, P. K. Sarkar, P. Singh, A. Banerjee, S. A. Ahmed, A. Alharbi, R. Obaid, S. K. Ghosh, A. Mitra and S. K. Pal, PLoS One, 2020, 15(1), e0227584, DOI:10.1371/journal.pone.0227584.
- J. A. Adekoya, E. O. Dare, M. A. Mesubi, A. A. Nejo, H. C. Swart and N. Revaprasadu, Results Phys., 2014, 4, 12–19 CrossRef.
- S. Liang, G. Zhang, J. Min, J. Ding and X. Jiang, J. Nanomater., 2014, 684251 Search PubMed.
- S. Kumar-Krishnan, E. Prokhorov, M. Hernández-Iturriaga, J. D. Mota-Morales, M. Vázquez-Lepe and Y. Kovalenko, et al., Eur. Polym. J., 2015, 67, 242–251 CrossRef CAS.
- S. Ivanov, A. Barylyak, K. Besaha, A. Bund, Y. Bobitski, R. Wojnarowska-Nowak, I. Yaremchuk and M. Kus-Liśkiewicz, Nanoscale Res. Lett., 2016, 11, 140 CrossRef CAS PubMed.
- A. J. Bard, R. Parsons and J. Jordan, Standard Potentials in Aqueous Solution, International Union of Pure and Applied Chemistry, Marcel Dekker Inc., New York, 1985 Search PubMed.
- G. Wu, C. Dong, Y. Li, Z. Wang, Y. Gao, Z. Shen and A. Wu, RSC Adv., 2015, 5(26), 20595–20602, 10.1039/C5RA00001G.
- H. El Kaoutit, P. Estévez, F. C. García, F. Serna and J. M. García, Anal. Methods, 2013, 5, 54–58 RSC.
- E. Coronado, J. R. Galán-Mascarós, C. Martí-Gastaldo, E. Palomares, J. R. Durrant, R. Vilar, M. Gratzel and M. K. Nazeeruddin, J. Am. Chem. Soc., 2005, 127, 12351–12356 CrossRef CAS PubMed.
- E. Eksin, A. Erdem, T. Fafal and B. Kıvcak, Electroanalysis, 2019, 31, 1–9 CrossRef.
- X. Yang, H. Liu, J. Xu, X. Tang, H. Huang and D. Tian, Nanotechnol, 2011, 22, 275503 CrossRef PubMed.
- S. Boopathi, S. Senthilkumar and K. L. Phani, J. Anal. Methods Chem., 2012, 348965 Search PubMed.
- S. Si, A. Kotal and T. K. Mandal, J. Phys. Chem. C, 2007, 111, 1248–1255 CrossRef CAS.
- S. Bothra, J. N. Solanki and S. K. Sahoo, Sens. Actuators, B, 2013, 188, 937–943 CrossRef CAS.
- K. Farhadi, M. Forough, R. Molaei, S. Hajizadeh and A. Rafipour, Sens. Actuators, B, 2012, 161, 880–885 CrossRef CAS.
- M. L. Firdaus, I. Fitriani, S. Wyantuti, Y. W. Hartati, R. Khaydarov, J. A. Mcalister, H. Obata and T. Gamo, Anal. Sci., 2017, 33, 831–837 CrossRef CAS PubMed.
- F. Tanvir, A. Yaqub, S. Tanvir, R. An and W. A. Anderson, Materials, 2019, 12, 1533 CrossRef CAS PubMed.
- A. Tirado-Guizar, G. Rodriguez-Gattorno, F. Paraguay-Delgado, G. Oskam and G. E. Pina-Luis, MRS Commun., 2017, 7, 695–700 CrossRef CAS.
- U. Khan, A. Niaz, A. Shah, M. I. Zaman, M. A. Zia, F. J. Iftikhar, J. Nisar, M. N. Ahmed, M. S. Akhter and A. H. Shah, New J. Chem., 2018, 42, 528–534 RSC.
- Y. Wang, F. Yang and X. Yang, ACS Appl. Mater. Interfaces, 2010, 2, 339–342 CrossRef CAS PubMed.
- S. Puchum, R. Meelapsom, S. S. Muniandy, H. L. Lee, S. Pencharee, M. Amatatongchai, K. Suttisintong and P. Jarujamrus, Int. J. Environ. Anal. Chem., 2019, 99, 139–156 CrossRef CAS.
- G. M. Sangaonkar, M. P. Desai, T. D. Dongale and K. D. Pawar, Sci. Rep., 2020, 10, 2037 CrossRef CAS PubMed.
- A. Nain, S. R. Barman, S. Jain, A. Mukherjee and J. Satija, Appl. Nanosci., 2017, 7, 299–307 CrossRef CAS.
- S. Ichinoki, H. Iwase, F. Arakawa, K. Hirano and Y. Fujii, J. Liq. Chromatogr. Relat. Technol., 2003, 26, 3129–3139 CrossRef CAS.
- M. Fišera, S. Kráčmar, H. Velichová, L. Fišerová, P. Burešová and P. Tvrzník, Potr. S. J. F. Sci., 2019, 13, 269–377 Search PubMed.
- J. K. Salem, I. M. El Nahhal and M. H. Shurrab, Int. J. Environ. Anal. Chem., 2020, 1726901 Search PubMed.
- B. T. Alquadeib, Saudi Pharm. J., 2019, 27, 66–70 CrossRef PubMed.
- F. Ali, S. B. Khan, T. Kamal, K. A. Alamry and A. M. Asiri, Sci. Rep., 2018, 8, 6260 CrossRef PubMed.
- M. J. Frisch, G. W. Trucks, H. B. Schlegel and G. E. Scuseriaet al., FOX GAUSSIAN 16 (Revision A.03), Gaussian Inc, Wallingford CT, 2008 Search PubMed.
- Y. Zhao and D. G. Truhlar, Theor. Chem. Acc., 2008, 120, 215–241 Search PubMed.
- G. M. Sangaonkar, M. P. Desai, T. D. Dongale and K. D. Pawar, Sci. Rep., 2020, 10, 2037, DOI:10.1038/s41598-020-58844-4.
Footnote |
| † Electronic supplementary information (ESI) available. See DOI: 10.1039/d0ra09926k |
|
| This journal is © The Royal Society of Chemistry 2021 |
Click here to see how this site uses Cookies. View our privacy policy here. 
 Open Access Article
 This Open Access Article is licensed under a Creative Commons Attribution-Non Commercial 3.0 Unported Licence
 ac,
Moushumi Hazarika
ac,
Moushumi Hazarika