
 Open Access Article
 This Open Access Article is licensed under a Creative Commons Attribution-Non Commercial 3.0 Unported Licence
Using Adinandra nitida leaf extract to prevent heterocyclic amine formation in fried chicken patties
Tianpei Zhao ,
Jun Xi,
Chenxia Zhang,
Yuxiang Ma* and
Xuede Wang*
,
Jun Xi,
Chenxia Zhang,
Yuxiang Ma* and
Xuede Wang*
College of Food Science and Engineering, Henan University of Technology, Zhengzhou, 450001, China. E-mail: myx366@163.com; wangxuede1962@126.com; Fax: +86-371-67758025; Tel: +86-371-67758025
First published on 10th February 2021
Abstract
Adinandra nitida leaf extract (ANE) is rich in phenols and flavonoids. In this study, the effects of ANE as an additive on the formation of major heterocyclic amines (HCAs), namely, PhIP, norharman and harman, in both chemical model systems and fried chicken patties were explored. In model systems, treatment with various amounts of ANE (0, 15, 30, 45, 60 mg) led to the most effective inhibition of PhIP, norharman and harman, with levels reduced by 47.88%, 49.73% and 29.63% when treated with 45 mg, 60 mg and 60 mg, respectively. Further, the effect of diverse dosages of ANE (0, 0.2, 0.4, 0.6%, w/w) on the formation of HCAs in chicken patties fried at 170 °C and 190 °C was evaluated. Statistics showed that the temperature significantly increased the formation of HCAs. Total HCA contents of patties fried at 170 °C and 190 °C ranged from 1.52 ng g−1 to 2.52 ng g−1 and from 6.05 ng g−1 to 13.76 ng g−1, respectively. The inhibitory efficacy of various concentrations of ANE on the total HCA content was higher (38.95–56.03%) in patties fried at 190 °C than at 170 °C (18.65–40.08%). External parts of the meat patties showed higher HCA contents than the interior. The current study presents evidence that ANE at moderate dosages can reduce the formation of HCAs in fried chicken. By extension it suggests that ANE has potential applications as a natural antioxidant for preventing the formation of HCAs in foods.
1. Introduction
Heterocyclic amines (HCAs) can be formed through pathways closely associated with the Maillard reaction during the thermal processing of protein-containing products such as meat samples.1–3 For example, meat, processed by grilling, frying, broiling, barbecuing, roasting and smoking, typically gives rise to HCAs.4 HCA formation is associated with the content of certain precursor substances, such as creatine, sugars, and amino acids, as well as long processing time, high temperature, high lipid level, and water activity, among others.5–7 Naturally, HCA formation is facilitated during frying due not only to high temperature, but also to free radicals produced by lipid oxidation, which are believed to be involved in the formation of HCAs.8,9 The unique sensory characteristics of fried food are loved by consumers all over the world. Fried chicken products are one of the most popular fast foods; they provide calories in the diet, but contain a significant number of unhealthy HCAs.More than 25 structural forms of HCAs have been isolated and identified since the discovery of HCAs.10 According to how they are generated, HCAs are generally divided into two classes: the aminoimidazo-azaarenes (IQ-types), and the amino-carbolines (non-IQ-types). The former are produced via the reaction of amino acids, glucose, creatine or creatinine when heated, through the Maillard reaction, while the latter are induced by the pyrolysis of amino acids/proteins when heated to temperatures above 300 °C.11 Among them, PhIP is classified as a Group 2B carcinogen by the International Agency for Research on Cancer (IARC); the β-carbolines (harman and norharman) have been shown to be co-mutagenic because they promote the genotoxicity of mutagenic aromatic amines.2,10 These three HCAs, namely PhIP, harman and norharman, are relatively common in fried chicken. For human beings, increased risk of cancer of the rectum, stomach, lung, pancreas, breast and prostate, has been associated with HCA intake.12,13
HCAs have received a great deal of attention because of their potentially carcinogenic/mutagenic activity. Therefore, inhibition strategies have been developed for reducing the formation of HCAs in model and food systems; these strategies include the use of lower temperatures, shorter cooking times, raw materials containing fewer precursors, and exogenous additives.1,6,13 In terms of additives, much research has focused on using natural instead of synthetic antioxidants to eliminate free radicals.2,8,14 For example, extracts from fruits such as pomegranate,15 apple,16 and grape17 and from plants, including bamboo leaves,18 artichokes5 and Rosa rugosa,19 have been employed to inhibit HCA generation in meat products. These extracts mainly contain flavonoids and phenolic acids, which possess antioxidant activity and play a role in reducing HCAs.4
Adinandra nitida leaves (Adinandra nitida Merr. ex H.L.Li; pentaphylacaceae), known as “Shiyacha” in China, have been widely consumed as a health tea and herbal medicine in China for hundreds of years.20 They have been found to be rich in flavonoids.21 Modern pharmacological studies have shown that the leaves have some pharmacological effects like reduction of blood pressure, and anti-inflammatory, antibacterial, antitumor, anti-toxicity, and analgesic activities.22 However, there are no published reports evaluating the effect of antioxidant compounds from A. nitida leaves on HCA formation. Accordingly, the present study was undertaken to investigate the effect of A. nitida leaf extract (ANE) as an additive on the formation of three common HCAs, namely, PhIP, harman and norharman in fried chicken patties.
2. Materials and methods
2.1. Chemicals
Three types of HCA standards were purchased from Santa Cruz Biotechnology, Inc. (Santa Cruz, CA, USA), namely 2-amino-1-methyl-6-phenylimidazo-[4,5-b] pyridine (PhIP), pyrido[3,4-b] indole (norharman) and 1-methyl-9H pyrido[3,4-b] indole (harman). Their stock solutions were prepared with methanol and kept at −20 °C until further dilution. D-(+)-glucose (99.5%), creatinine standard (99%), L-phenylalanine (99%), L-tryptophan (99%), rutin, gallic acid, thiobarbituric acid (TBA), trichloroacetic acid (TCA), 2,4-dinitrophenylhydrazine (DNPH), 2,2-diphenyl-1-picrylhydrazyl (DPPH), 2,4,6-tripyridyl-striazine (TPTZ) and 2,2′-azino-bis(3-ethylbenzothiazoline-6-sulfonic acid) diammonium salt (ABTS) were obtained from Shanghai Macklin Biochemical Co., Ltd (Shanghai, China). In addition to HPLC-grade methanol and acetonitrile purchased from Sigma (St. Louis, MO, USA), analytical-grade hydrochloric acid, sodium hydroxide and ammonia were purchased from Chemreagent (Tianjin, China). The ultra-pure water used in the experiments was prepared in the laboratory.2.2. Preparation of ANE
Dried leaves of A. nitida, sourced from Pingle city (Guangxi Province, China), were ground using a pulverizer (LX-04, Xi'an Jinzhen Machinery Co., Ltd, China) to acquire 40-mesh sieve powder. About 30 g of dried A. nitida leaf was dispersed in 900 mL of 70% ethanol with magnetic stirring by a water bath pot (HCJ-4E, Lang Yue Instrument Manufacturing Co., Ltd, Changzhou, China) at 50 °C for 1 h and then centrifuged at 4500 rpm at room temperature for 10 min by a centrifuge (LD5-10, Beijing Jingli Centrifuge Co., Ltd, Beijing, China). The supernatant was concentrated under vacuum at 45 °C and freeze-dried (Alpha 1–4, Christ, Germany) to produce the A. nitida leaf extract, ANE.2.3. Determination of total phenolic content (TPC), total flavonoid content (TFC) and antioxidant activity of ANE
Because, in practice, the extract would be processed at a high temperature when added to the meat, ANE was subjected to thermal treatment by placing 150 mg extract in a thick-walled pressure pipe (P160002, Synthware Glass Instrument Co., Ltd, Beijing, China), and heating samples in an oil bath pot (DF-101S, Yuhua Instrument Co., Ltd, Gongyi, China) at 100 °C, 125 °C and 150 °C for 15 min.TFC was determined by the spectrophotometric method.24 The standard curve (y = 13.3x − 0.0047, r2 = 0.9999) for total flavonoid was constructed using rutin standard solutions (10–100 μg mL−1), and results were expressed as mg of rutin equivalents (RE) per g of dried fraction.
2.4. Design of chemical model systems
Two reaction systems, namely PhIP- and β-carboline-producing, were prepared to investigate the effects of ANE on PhIP, norharman and harman. The PhIP-producing model was developed with reference to the method of Zhou et al.27 with slight adjustments. In brief, 0.4 mmol phenylalanine, 0.4 mmol creatinine and 0.2 mmol glucose with various amounts of ANE (0, 15, 30, 45 and 60 mg) were dissolved in 10 mL of diethylene glycol including 14% distilled water (v/v) in thick-walled pressure pipes, then they were heated in an oil bath at 160 °C for 10 min. After heating, an ice-water bath was used immediately to cool the reactor to normal temperature. For the β-carboline-producing system, 0.4 mmol of tryptophan was used instead of phenylalanine, and everything else was the same. Referring to the method of Zhang et al.,28 the purification and enrichment of the above HCAs were utilizing Cleanert PCX (3 mL/60 mg) solid phase extraction (SPE) cartridges. After the cartridges were pre-treated with 3 mL of methanol followed by 3 mL of distilled water, 200 μL of the reactant was directly subjected to pass through the PCX cartridge, which was then sequentially washed with 3 mL of 0.1 M HCL and 3 mL of methanol. Final elution of HCAs was performed using 3 mL of 5% ammonia in methanol, and the solution was evaporated to dryness under nitrogen. The dried fraction was reconstituted with 1 mL of methanol and then filtered through a 0.22 μm organic filter for UPLC/MS analysis.2.5. Preparation of fried chicken patties
Fresh chicken breast meat was obtained from a local supermarket in Zhengzhou (Henan province, China) and kept at −20 °C. After thawing at 4 °C for 12 h, visible fat and connective tissue were removed, and the meat was passed through a meat blender (S2-A808, Joyoung, Suzhou, Jiangsu, China). Different concentrations of ANE (0, 0.2, 0.4, 0.6%, w/w) were mixed well with the ground chicken and stored at 4 °C overnight. Among them, non-treated with ANE was taken as the control group compared with those added ANE. Next, the meats were shaped into patties (about 10 mm thick × 35 mm diameter) by hand with an amount of 10 ± 0.1 g, and all groups were fried in soybean oil heated to 170 °C and 190 °C, separately, for 6 min (3 min each side) using a deep fat fryer (XJ-6K116, Weighmax, America). When done, the patties were removed to filter paper to absorb excess oil, and allowed to cool to room temperature. The patties were then weighed to determine loss of mass in cooking. Then meat samples from each group were divided in two. One half was homogenized using a grinder (FW-80, Beijing Ever Bright Medical Treatment Instrument Co., Ltd, Beijing, China) directly for obtaining uniform samples for determination of HCA levels, pH, color, proximate components, lipid oxidation and protein oxidation. For the other half, the outer crust to a depth of about 2 mm was separated, and then the crust and remaining internal meat were homogenized separately in order to determine distribution of the HCAs in the patty.The HCA content of the meat samples was determined according to the method described by Yan et al.29 with minor modifications. First, 3 g meat sample was homogenized at 10![[thin space (1/6-em)]](https://www.rsc.org/images/entities/char_2009.gif) 000 rpm using a high-speed homogenizer (PD500, Prima Technology Group Co., Ltd, England) for 1 min in 10 mL of acetonitrile. Following centrifugation at 5000 rpm for 5 min, the top layer was collected. After two extraction processes cycles, 10 mL of n-hexane saturated with acetonitrile was added to combined extracts in order to degrease. Finally, solid phase extraction was performed on the purified solution, and the subsequent steps were the same as described in Section 2.4.
000 rpm using a high-speed homogenizer (PD500, Prima Technology Group Co., Ltd, England) for 1 min in 10 mL of acetonitrile. Following centrifugation at 5000 rpm for 5 min, the top layer was collected. After two extraction processes cycles, 10 mL of n-hexane saturated with acetonitrile was added to combined extracts in order to degrease. Finally, solid phase extraction was performed on the purified solution, and the subsequent steps were the same as described in Section 2.4.
2.6. Determination of cooking loss, pH, color and proximate components
The cooking loss in meat patties was calculated by comparing the mass difference between raw and cooked patties. For pH, 3 g sample was homogenized with 30 mL of KCl solution, and then pH was measured using a digital pH meter (PHS-3C, Rex Electric Chemical, China) calibrated by buffer solution in advance.30 Analysis of color difference in meat was measured using a colorimeter (CR-400, Konica Minolta sensing Inc., Osaka, Japan). The proximate components of meat samples, including water, ash, lipid, and protein contents, were analyzed based on previous methods.2 Lipid content was determined by Soxhlet extraction, and the protein content was measured by the Kjeldahl method.2.7. Determination of thiobarbituric acid-reactive substances (TBARS) and protein carbonyl value
TBARS analyses are usually used in assessing lipid oxidation. As reported before,23 the absorbance of the samples was carried out at 532 nm using an ultraviolet spectrophotometer (Shanghai Yuanxi Instrument Co., Ltd, Shanghai, China). Standard solutions of 1,1,3,3-tetraethoxypropane (0.02–0.25 μg mL−1) were prepared to draw a calibration curve (y = 0.7224x − 0.0084, r2 = 0.9999), and the results are expressed as mg of malondialdehyde (MDA) per kg sample.The carbonyl content was measured by derivatization with DNPH to express the degree of protein oxidation. Referring to the past method described by Ganhão et al.,31 the result of carbonyl evaluation is expressed as nmol of carbonyl per mg of protein.
2.8. Analysis of HCAs
The samples were subjected to LC-MS on a Waters Acquity UPLC CLASS system coupled with a triple quadrupole mass spectrometer (Xevo TQD) with positive electrospray ionisation (ESI+) (Waters, Milford, MA, USA). Waters ACQUITY UPLC BEH C18 column (1.7 μm, 50 mm × 2.1 mm i.d) with mobile phases consisting of mobile phase A (10 mM ammonium formate, pH 6.80) and mobile phase B (acetonitrile) was employed to achieve separation. The gradient elution was delivered using a flow rate of 0.3 mL min−1. The mobile phase A was as follows: 0–0.2 min, 90%; 0.2–1.0 min, 90–70%; 1.0–3.0 min, 70–40%; 3.0–3.5 min, 40–10%. The MS system was operated in multi-reaction monitoring (MRM) scan mode; mass spectrometric parameters were: capillary voltage, 0.5 kV; ion source temperature, 120 °C; desolvation temperature, 450 °C; cone gas (nitrogen, purity: 99.99%) flow, 50 L h−1 and desolvation gas (nitrogen, purity: 99.99%) flow, 1000 L h−1, collision (argon, purity: 99.99%). Three standard HCA levels were determined according to standard curves, and the data was acquired using Waters MassLynx 4.1 software (Waters).2.9. Statistical analysis
All the experiments were conducted in triplicate, and the data are reported as the mean value ± standard deviation. Mean values among treatment groups were compared by the ANOVA test. p-Values of <0.01 and <0.05 were considered as statistically significant.3. Results and discussion
3.1. TPC, TFC, and antioxidant activity in ANE
Flavonoids and polyphenols, identified to be less toxic than synthetic antioxidants, are highly effective free radical inhibitors.32 The TPC and TFC found in raw unheated ANE were 237.71 mg GAE per g DW and 430.85 mg RE per g DW, respectively. Chen et al.22 observed TFC content from 71.29 to 140.54 mg GAE per g and from 19.13 to 88.72 mg of catechin equivalent per g in four varieties of Adinandra tea. The disparity was probably due to differences in raw materials. However, all A. nitida leaves contained high TPC and TFC. Changes in TPC and TFC after heating at different temperatures are separately shown in Fig. 1A and B, respectively. It can be noted that the TFC in ANE after treatment at different temperatures were consistently higher than that of TPC. In addition, few changes were observed in TPC and TFC after heat treatment at 100 °C and 125 °C, while both were significantly elevated (p < 0.05) to 252.23 mg GAE per g DW and 461.68 mg RE per g DW, respectively, by further heating to 150 °C. The results agreed with Chen et al.,33 who reported a significant increase in phenolic and flavonoid contents of A. nitida leaves after stir-frying. It may be due to cell wall disruption; that is, heat induced the breakdown of lignocellulosic structure of the ANE, thereby releasing flavonoids and phenols.34 Degradation of hydrolysable tannins to smaller phenolic compounds after heating can also be a reason.35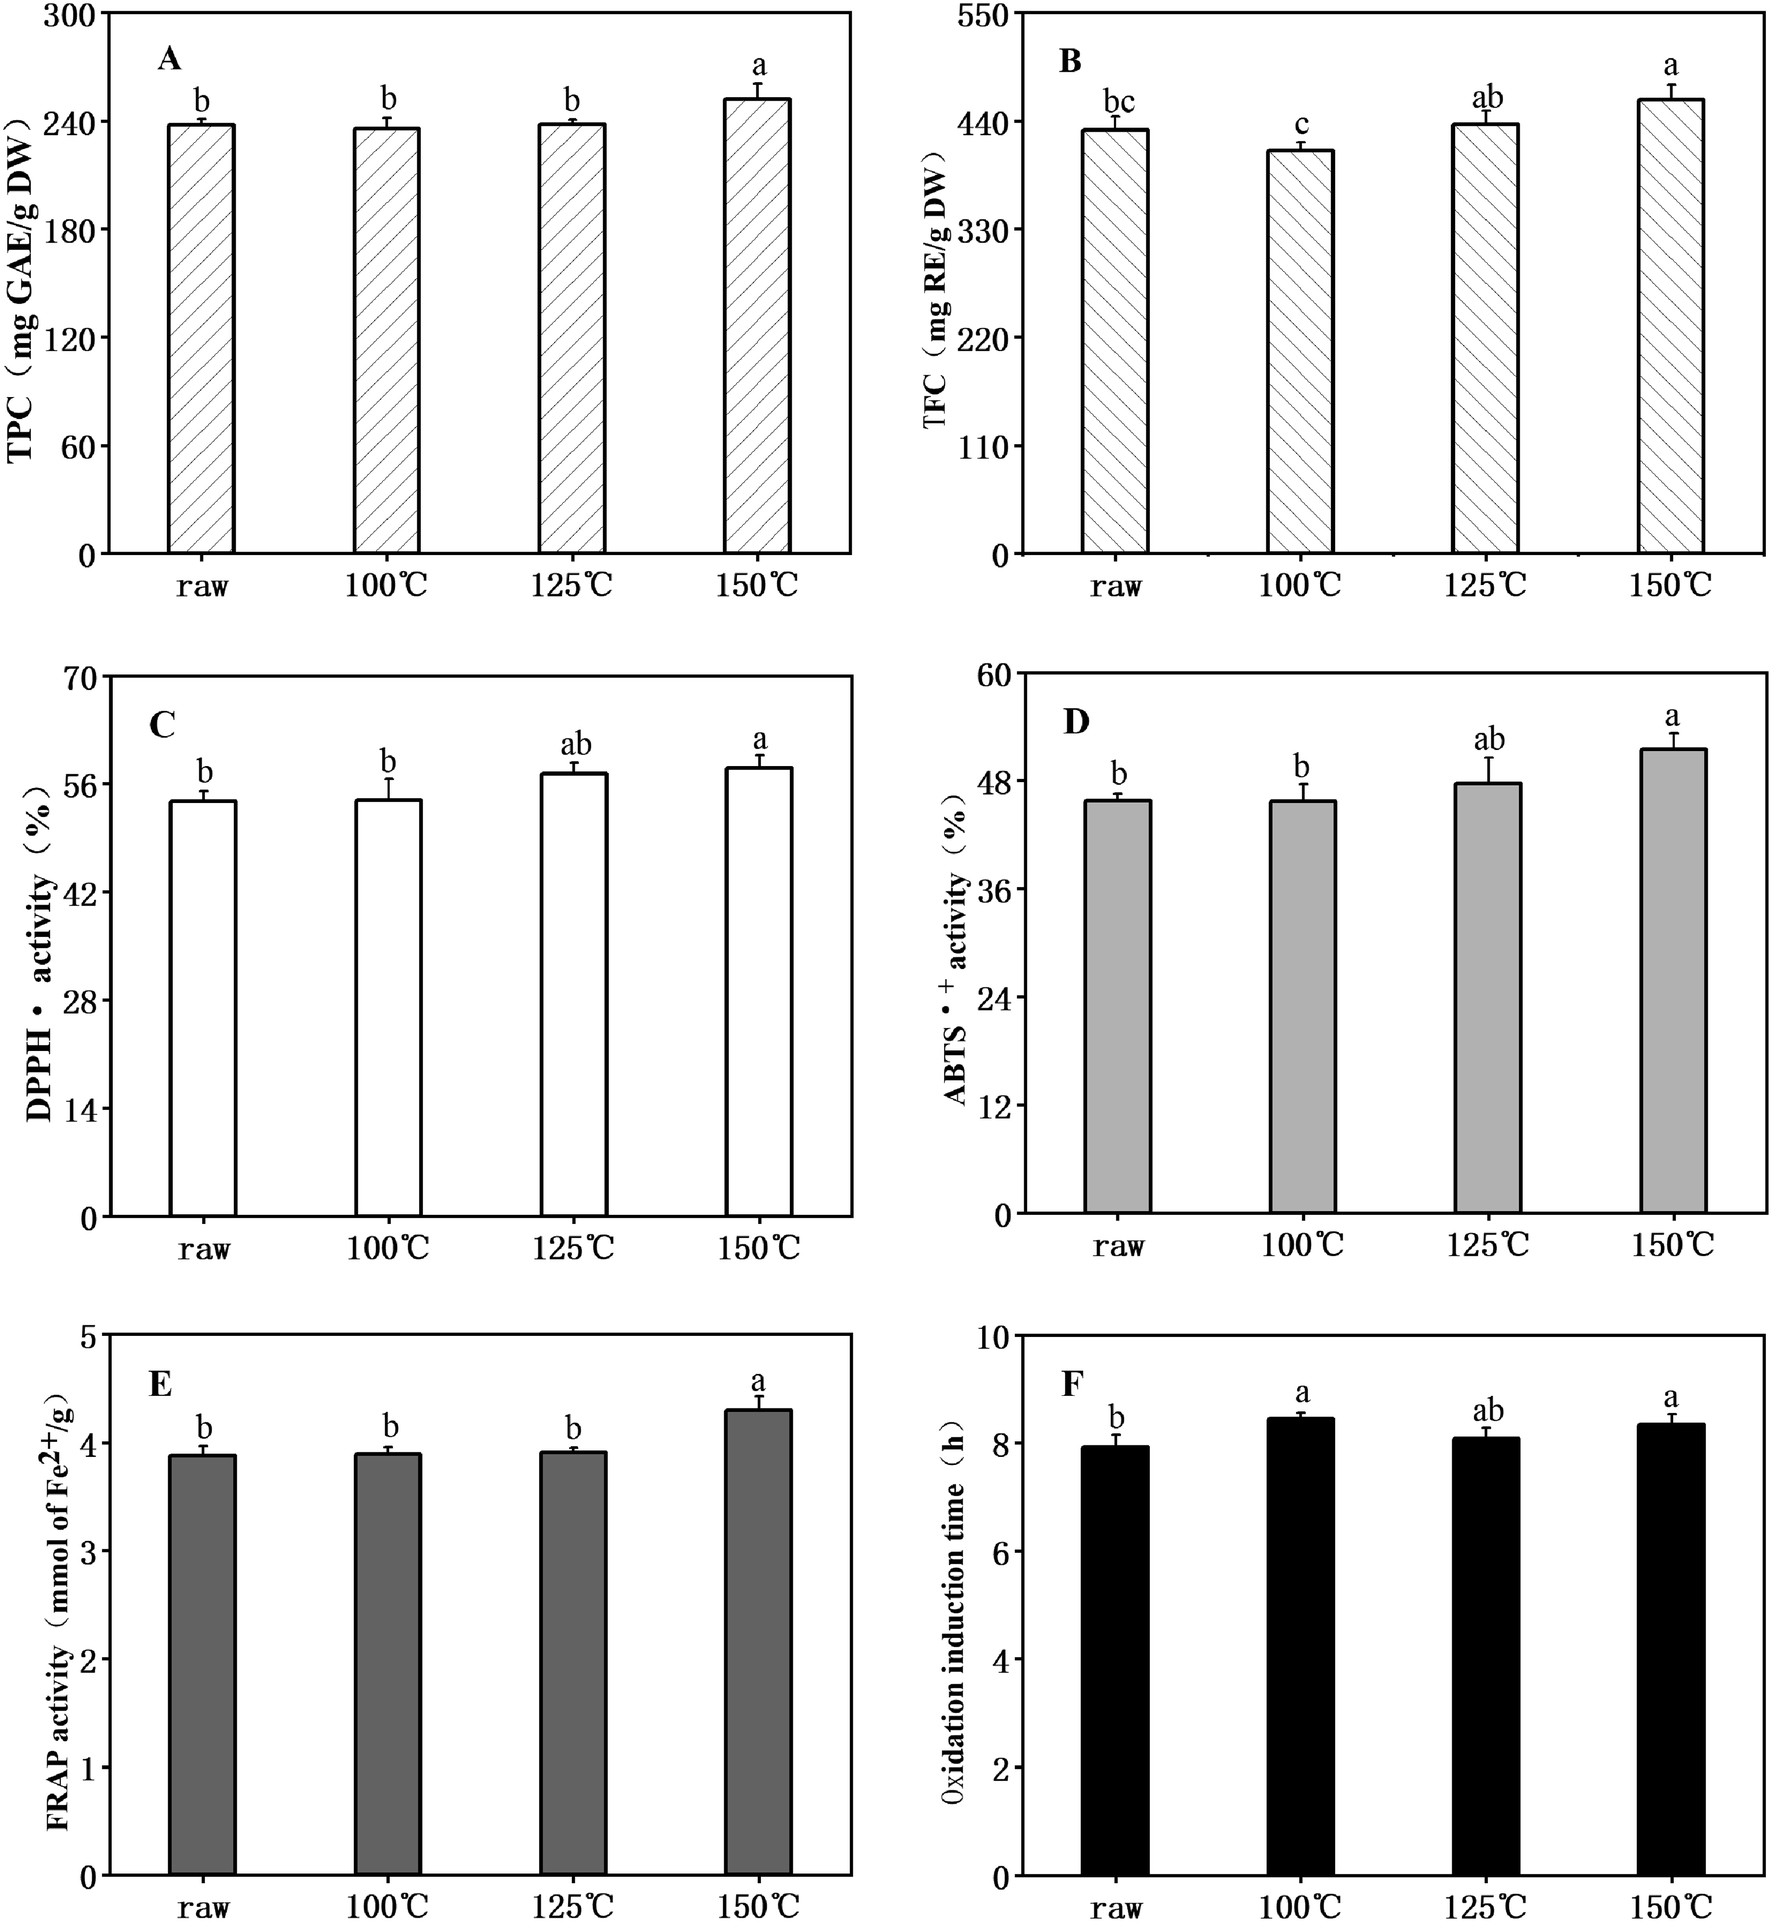 | ||
| Fig. 1 TPC, TFC and antioxidant activity of ANE after thermal treatment. (A) TPC (total phenolic content); (B) TFC (total flavonoid content); (C) DPPH˙ scavenging activity; (D) ABTS˙+ scavenging activity; (E) FRAP avtivity; (F) oxidation induction time. Values are expressed as means ± SD (n = 3). Results with different letters are significantly different (p < 0.05). | ||
Changes of DPPH˙ (Fig. 1C) and ABTS˙+ (Fig. 1D) scavenging activities and of ferric reducing antioxidant power (FRAP) (Fig. 1E) ranged from 53.73% to 58.05%, 45.67% to 51.43% and 3.88 to 4.30 mmol of Fe2+ per g, respectively. All reached their maximums (p < 0.05) when processed at the highest temperatures. Oxidation induction time (OIT) is widely used for the evaluation of the oxidative stability of natural fats and oils. As shown in Fig. 1F, all ANE samples had a longer OIT compared to pure soybean oil (6.63 h) without added antioxidants, with a correspondingly higher antioxidant activity. The heated ANEs that showed the longer OIT were heated at 100 °C (8.45 h), 125 °C (8.07 h), 150 °C (8.34 h), while raw unheated ANE showed lower protection (7.92 h) against lipid oxidation. These results indicate that the antioxidant activity of ANE was enhanced by heat treatment, as is true for many seeds. For example, grain amaranth showed an increase radical scavenging activity after heat processing,36 and significantly higher antioxidant activity was observed in roasted sesame seeds.37 Previous studies have shown a linear correlation between antioxidant activity and total phenolic content.38 Hence, for ANE, part of the reason for the elevated antioxidant activity might be the observed increase in total phenols. Moreover, the formation of melanoidins, which are non-enzymatic browning products, at high temperature can also lead to the enhancement of antioxidant activity.35
3.2. Proximate components, pH, weight loss and color
The moisture, total lipid, total protein, ash content, pH, and L*, a*, b* values of the raw chicken breast were analyzed to be 72.04%, 0.18%, 23.33%, 0.87%,5.95, and 54.06, 4.02, 14.33, respectively (Table 1). Similar results for raw chicken breast meat have been reported previously.2| ANE concentration (%) | Moisture (%) | Total lipid (%) | Total protein (%) | Ash (%) | pH | Weight loss (%) | L* | a* | b* | |
|---|---|---|---|---|---|---|---|---|---|---|
| a ANE = Adinandra nitida leaf extract; values are expressed as means ± SD (n = 3). Means with different letters in the same column and in the same temperature are significantly different (p < 0.05). ns: not significant (p > 0.05). **p < 0.01, *p < 0.05. | ||||||||||
| Raw meat | — | 72.04 ± 0.41 | 0.18 ± 0.01 | 23.33 ± 0.32 | 0.87 ± 0.02 | 5.95 ± 0.01 | — | 54.06 ± 0.30 | 4.02 ± 0.02 | 14.33 ± 0.04 |
| 170 °C | 0 | 51.94 ± 1.02 | 6.53 ± 0.30 | 35.92 ± 0.84 | 1.96 ± 0.03 | 6.09 ± 0.03 | 45.29 ± 1.54 | 76.29 ± 0.92a | 5.08 ± 0.12a | 22.56 ± 0.95 |
| 0.2 | 52.02 ± 1.65 | 6.14 ± 0.74 | 35.36 ± 2.02 | 1.86 ± 0.05 | 6.07 ± 0.05 | 45.72 ± 0.98 | 75.70 ± 1.71a | 4.95 ± 0.08a b | 22.98 ± 0.58 | |
| 0.4 | 52.92 ± 2.40 | 6.22 ± 0.85 | 34.57 ± 1.53 | 1.91 ± 0.04 | 6.06 ± 0.03 | 42.12 ± 1.07 | 74.61 ± 0.93a | 4.88 ± 0.05b c | 23.41 ± 0.39 | |
| 0.6 | 52.51 ± 1.22 | 6.31 ± 0.62 | 35.17 ± 1.03 | 1.93 ± 0.09 | 6.07 ± 0.06 | 43.05 ± 3.07 | 72.19 ± 0.53b | 4.75 ± 0.10c | 24.08 ± 0.35 | |
| Sign | ns | ns | ns | ns | ns | ns | ** | * | ns | |
| 190 °C | 0 | 46.85 ± 1.85 | 7.49 ± 0.77 | 40.45 ± 0.71 | 2.23 ± 0.02 | 6.12 ± 0.03 | 51.90 ± 1.85 | 74.58 ± 1.32a | 5.41 ± 0.08a | 24.60 ± 0.50b |
| 0.2 | 47.03 ± 0.54 | 7.36 ± 0.36 | 39.17 ± 1.76 | 2.15 ± 0.05 | 6.10 ± 0.08 | 50.04 ± 1.52 | 72.49 ± 0.83a | 5.26 ± 0.06a b | 25.07 ± 0.35b | |
| 0.4 | 48.23 ± 2.81 | 7.21 ± 0.47 | 39.66 ± 0.59 | 2.18 ± 0.07 | 6.08 ± 0.03 | 50.63 ± 0.72 | 70.35 ± 0.63b | 5.19 ± 0.13b | 25.96 ± 0.46a | |
| 0.6 | 48.04 ± 1.08 | 7.25 ± 0.65 | 38.72 ± 1.27 | 2.14 ± 0.08 | 6.09 ± 0.04 | 50.08 ± 1.99 | 68.67 ± 1.30b | 5.08 ± 0.07b | 26.49 ± 0.24a | |
| Sign | ns | ns | ns | ns | ns | ns | ** | * | ** | |
| P (ANE concentration) | 0.685 | 0.848 | 0.387 | 0.093 | 0.657 | 0.121 | <0.01 | <0.01 | <0.01 | |
| P (temperature) | <0.01 | <0.01 | <0.01 | <0.01 | 0.219 | <0.01 | <0.01 | <0.01 | <0.01 | |
| P (interaction between ANE concentration and temperature) | 0.999 | 0.977 | 0.740 | 0.620 | 0.985 | 0.251 | 0.263 | 0.995 | 0.795 | |
Proximate components, pH values, cooking losses and color of fried chicken patties are described in Table 1, with regard to ANE concentration and cooking temperature. Statistical analysis showed that the concentration of the ANE had no obvious effect (p < 0.01) on moisture, lipid, protein, ash, pH and weight loss; but it did affect color, while temperature significantly impacted (p < 0.01) all the proximate components, cooking losses and color of patties, except for pH. Moreover, no interaction between concentration of ANE and temperature was found in above indicators.
As shown in Table 1, moisture content in chicken patties fried at 170 °C and 190 °C ranged from 51.94% to 52.92% and 46.85% to 48.23%, respectively, which is similar to the result of Lu et al.39 The higher the temperature, the lower the water content. The opposite result was observed for weight in that the weight loss of samples fried at 190 °C (50.04–51.90%) was significantly higher (p < 0.01) than fried at 170 °C (42.12–45.29%). As expected, the lipid, protein, and ash content of samples fried at 190 °C increased compared to those fried at 170 °C because of the loss of water (Table 1). Temperature clearly affected (p < 0.01) all the above indicators. However, no notable differences (p > 0.05) of pH between patties fried at 170 °C (6.06–6.09) and 190 °C (6.08–6.12) were obtained. Additionally, adding different concentrations of ANE to meat samples was not found to have a significant effect (p > 0.05) on proximate components, weight loss and pH values; other reports with various types of meat reached a similar conclusion.5,40 Nevertheless, both ANE concentration and frying temperature had a significant effect (p < 0.01) on L*, a* and b* values of the meat samples. Adding ANE significantly reduced (p < 0.01) L*. Similar to the change of L* value, the more ANE added, the lower the a* value. However, the retention of b* value was significantly enhanced with the increasing amount of ANE added. Overall, results of the current study for L*, a* and b* values are in line with a previous report,4 which found a decrease in L* and a* values with a minor increase in b* value of Chrysanthemum morifolium flower extract group as compared to control.
3.3. Analysis of TBARS
Lipid oxidation products were quantified in fried chicken samples under different concentrations of ANE and frying temperatures (Fig. 2). As expected, heat processing resulted in an increase in TBARS content compared with 0.14 mg MDA per kg of the raw meat. Roldan et al.41 reported that high temperature promoted the formation of secondary oxidation products, and then accelerated fat oxidation. However, it can be observed that TBARS decreased at a higher temperature; for example, the TBARS of the control samples changed from 0.65 mg MDA per kg (170 °C) to 0.58 mg MDA per kg (190 °C), which is similar to findings reported in other studies.41,42 One possible reason is that MDA reacts at a higher rate with the proteins, phospholipids and nucleic acids in meat at high temperature.41 Besides, the secondary product from fat oxidation was not necessarily MDA. The available data from the TBARS analysis provides evidence that the addition of ANE can significantly (p < 0.05) improve lipid oxidative stability in fried chicken. Particularly, increasing ANE concentration to 0.4% and 0.6% in meat yielded TBARS values lower than the concentration of 0.2% ANE. Analogously, Das et al.43 demonstrated that the addition of 1.5% of litchi fruit pericarp extract in sheep meat effectively inhibited lipid oxidation better than the addition of 1.0%. ANE has been shown in the previous section to be rich in polyphenols and flavonoids, which can inhibit free radical formation and propagation reactions via the chelation of transition metal ions (including iron and copper) in meat to mitigate lipid oxidation.44 Previous studies have reported natural antioxidants are useful in reducing lipid oxidation in diverse meat types.1,23 | ||
| Fig. 2 Effect of different concentrations of ANE on TBARS values in chicken patties fried at 170 °C and 190 °C. Values are expressed as means ± SD (n = 3). Bars with different capital letters and small letters indicate significant differences (p < 0.05) for 170 °C and 190 °C, respectively. | ||
3.4. Analysis of protein carbonyl
The production of protein carbonyl is a key indicator of protein oxidative damage. The protein carbonyl value of raw chicken was determined to be 0.93 nmol per mg protein. The effect of different concentrations of ANE and frying temperature on the protein carbonyl values in fried meats are shown in Fig. 3. It can be seen that thermal processing promoted oxidative damage to protein with significantly higher levels of protein oxidation in the control group of cooked meat (1.73 nmol per mg protein and 2.34 nmol per mg after heating at 170 °C and 190 °C, respectively) compared to raw meat, also indicating that temperature had a positive effect on the value obtained for protein carbonyl. This may be attributed to the increase in the degrees of the Maillard reaction and fat oxidation at a higher temperature. The active carbonyl compounds produced in the lipid oxidation and Maillard reaction such as MDA could bind to protein amino acid side chains, including histidine imidazole, cysteine sulfhydryl, and lysine amino groups, to form carbonyls.45,46 Additionally, the protein carbonyls in fried meats were found to be reduced with addition of increasing amounts of ANE. The levels of protein carbonyls in meat with the addition of 0.6% of ANE were, respectively, 1.39 nmol per mg protein and 1.88 nmol mg−1 after frying at 170 °C and 190 °C, which were markedly lower (p < 0.05) than the control group. The results confirm the ability of ANE to act as a useful inhibitor of meat protein oxidation. The efficacy of ANE in limiting protein oxidation may stem from the high amount of extractable substances with intense antioxidant activities such as flavonoids. Many researchers have tested extracts from diverse types of plants and plant parts for use as food additives in protecting against protein carbonyl generation.23,47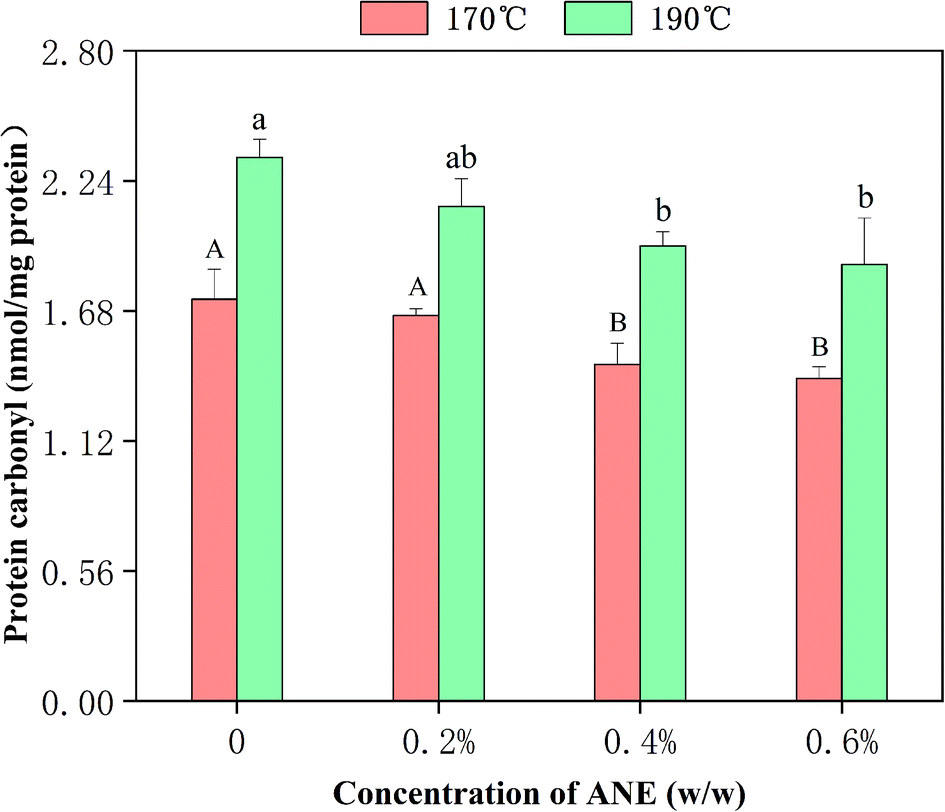 | ||
| Fig. 3 Effect of different concentrations of ANE on protein carbonyl values in chicken patties fried at 170 °C and 190 °C. Values are expressed as means ± SD (n = 3). Bars with different capital letters and small letters indicate significant differences (p < 0.05) for 170 °C and 190 °C, respectively. | ||
3.5. Recoveries
According to the signal-to-noise ratios of 3 and 10, the limit of detection (LOD) and limit of quantification (LOQ) were estimated, respectively. LOD values (ng g−1) were as follows: PhIP = 0.01, norharman = 0.14, harman = 0.05. LOQ values (ng g−1) were as follows: PhIP = 0.09, norharman = 0.24, harman = 0.16. The recovery values of the three HCAs were 84.51% for PhIP, 94.67% for norharman and 68.46% for harman. These results are comparable with those reported in the literature.19 The UPLC/MS chromatogram of a mixed HCA solution is shown in Fig. 4.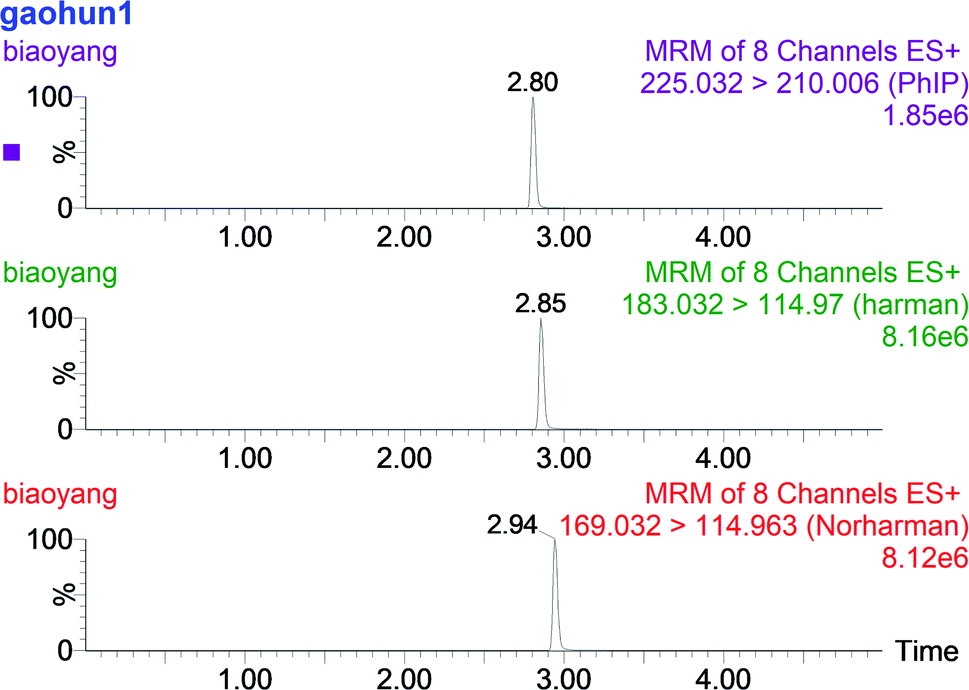 | ||
| Fig. 4 UPLC/MS chromatogram of PhIP, norharman and harman mixed solution. | ||
3.6. Effect of ANE on HCA formation in chemical model systems
As shown in Fig. 5, in the PhIP-producing system, compared to the control (0 mg of ANE), the concentration of PhIP decreased to 83.55%, 64.22%, and 52.12% when ANE was added in amounts of 15, 30, and 45 mg, respectively. Although there was a slight increase (54.35% relative to control) in PhIP concentration when 60 mg of ANE was added, differences were not significant (p > 0.05). The results revealed that ANE effectively inhibited PhIP in a dose-dependent manner, which is similar to the conclusion of Zhang et al.18 In the β-carboline-producing system, no consistent pattern of ANE inhibitory effect on norharman and harman was observed (Fig. 5). The inhibition of norharman was found to be intensively dose-dependent upon the amount of ANE added. More specifically, ANE (15, 30, 45 and 60 mg) observably reduced (p < 0.05) the amount of norharman formation to 84.78%, 71.09%, 60.93% and 50.27%, respectively. However, the formation of harman was not inhibited and was even promoted at 15 mg and 30 mg addition levels. Only the addition of ANE at high levels (45 mg and 60 mg) inhibited harman (decreased to 90.8% and 70.37%, correspondingly). Overall, these results illustrate that ANE was effective against HCA formation in model systems.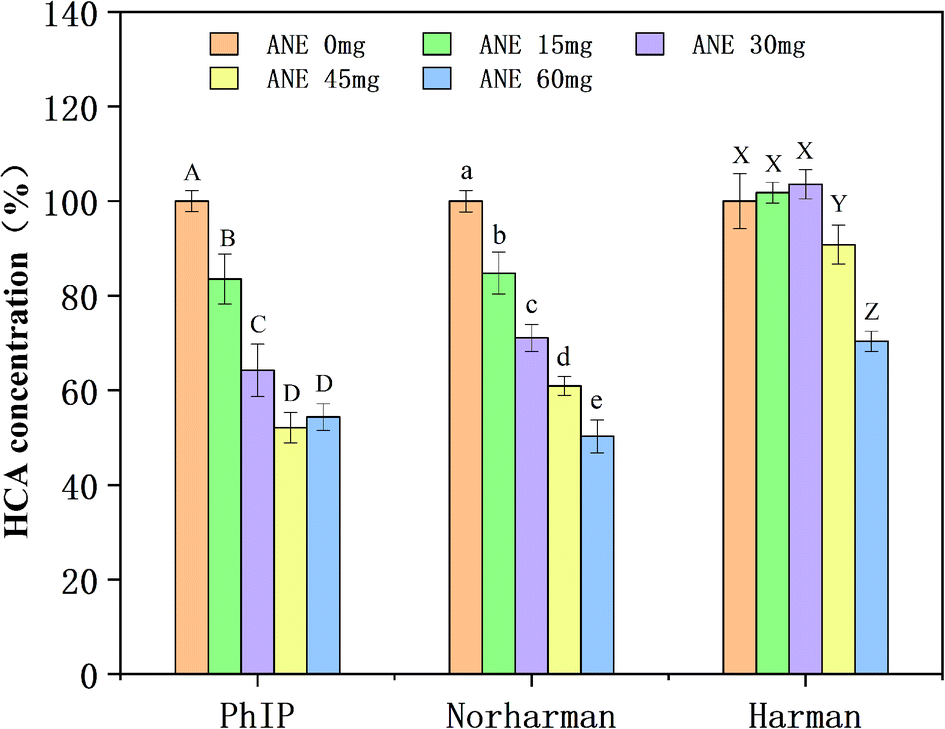 | ||
| Fig. 5 Effect of various amounts of ANE on the formation of PhIP, norharman and harman in PhIP- and β-carboline-producing model systems. Values are expressed as means ± SD (n = 3). Bars with different letters in individual HCAs are significantly different (p < 0.05). | ||
3.7. Effect of ANE on HCA formation in fried chicken patties
After confirming that ANE effectively inhibits HCA production in chemical model systems, it was applied to fried chicken. After frying the patties, the contents of HCAs were determined in three parts: the entire meat patty; the outer crust, and the interior meat. HCA concentrations in entire patties in control and ANE-supplemented patties are shown in Table 2. Both ANE concentration and temperature significantly affected (p < 0.01) the formation of PhIP, norharman, harman, and total HCAs. Interaction between ANE concentration and temperature was observed to have affected levels of all the HCAs except norharman.| ANE concentration (%) | PhIP ng g−1 | Inhibition | Norharman ng g−1 | Inhibition | Harman ng g−1 | Inhibition | Total HCAs ng g−1 | Inhibition | |
|---|---|---|---|---|---|---|---|---|---|
| a ANE = Adinandra nitida leaf extract. Values are expressed as means ± SD (n = 3). Means with different letters in the same column and in the same temperature are significantly different (p < 0.05). **p < 0.01. | |||||||||
| 170 °C | 0 | 0.78 ± 0.13a | — | 1.13 ± 0.07b | — | 0.61 ± 0.05a | — | 2.52 ± 0.06a | — |
| 0.2 | 0.47 ± 0.07b | 39.74% | 0.69 ± 0.09c | 38.94% | 0.35 ± 0.03c | 42.62% | 1.52 ± 0.16c | 40.08% | |
| 0.4 | 0.31 ± 0.11b | 60.26% | 1.10 ± 0.03b | 2.65% | 0.42 ± 0.06b c | 31.15% | 1.83 ± 0.16b | 27.38% | |
| 0.6 | 0.26 ± 0.09b | 66.67% | 1.33 ± 0.05a | −17.70% | 0.46 ± 0.04b | 24.59% | 2.05 ± 0.12b | 18.65% | |
| Sign | ** | — | ** | — | ** | — | ** | — | |
| 190 °C | 0 | 9.62 ± 0.35a | — | 2.42 ± 0.05a | — | 1.72 ± 0.09a | — | 13.76 ± 0.39a | — |
| 0.2 | 5.71 ± 0.58b | 40.64% | 1.83 ± 0.08c | 24.38% | 0.86 ± 0.07b | 50.00% | 8.41 ± 0.45b | 38.95% | |
| 0.4 | 3.25 ± 0.24c | 66.22% | 2.16 ± 0.06b | 10.74% | 0.66 ± 0.03c | 61.63% | 6.07 ± 0.28c | 55.89% | |
| 0.6 | 2.84 ± 0.40c | 70.48% | 2.51 ± 0.13a | −3.72% | 0.70 ± 0.08c | 59.30% | 6.05 ± 0.20c | 56.03% | |
| Sign | ** | — | ** | — | ** | — | ** | — | |
| P (ANE concentration) | <0.001 | <0.001 | <0.001 | <0.001 | |||||
| P (temperature) | <0.001 | <0.001 | <0.001 | <0.001 | |||||
| P (interaction between ANE concentration and temperature) | <0.001 | 0.116 | <0.001 | <0.001 | |||||
As shown in Table 2, increasing temperature significantly promoted (p < 0.01) the production of PhIP (Table 2). PhIP levels in control group patties fried at 190 °C (9.62 ng g−1) were approximately 12 times higher than those fried at 170 °C (0.78 ng g−1). The result was similar with the research of Jamali et al.,19 who found that the PhIP content of beef patties fried at 220 °C was about 15 times higher than those fried at 160 °C. The significant impact of temperature on PhIP content may be attributed to the increase of cooking loss at high temperature. Theoretically, the greater the water loss, the more precursor substances migrate to the food surface via water transference, resulting in the formation of a large number of HCAs.7 The inhibitory effect of ANE on PhIP formation was observed at both temperatures. The contents of PhIP in meats fried at 170 °C decreased by 39.74%, 60.26% and 66.67% when ANE was added at concentrations of 0.2, 0.4 and 0.6%, respectively; at 190 °C corresponding reductions of 40.64%, 66.22% and 70.48% were observed. The finding that inhibition was more effective with the increasing concentrations of ANE is similar to the findings from the model system. The more ANE added, the more phenolics appeared to be functioning as agents capturing phenylacetaldehyde, a common intermediate product of PhIP formation.27 The concentration-dependent effect of antioxidants on the formation of PhIP is consistent with previous research, which found that the PhIP level in fried beef patties was reduced by 67%, 68% and 82% at the doses of 0.1, 0.15 and 0.3%, respectively, of apple peel polyphenol extract applied on the surface. However, Teng et al.34 found that the dose-dependent effect was not present when various dosages of Sonchus olearleu extract were explored to determine the effect on PhIP formation in roasted pork. The difference in the inhibitory effect of various amounts of antioxidants on HCA formation may be due to the chemistry of the complex ingredients of the selected antioxidants. Nevertheless, in this study, ANE was clearly found to prevent PhIP formation in fried chicken.
The contents of the co-mutagenic β-carbolines norharman and harman were 1.13 ng g−1 and 0.61 ng g−1, respectively, in the control patties fried at 170 °C, and were basically reduced in the ANE-treated samples (Table 2). As expected, at 190 °C, norharman and harman dramatically (p < 0.01) increased in both groups (control and ANE-treated). This result indicates that high temperature increases β-carboline levels, which is consistent with Jamali et al., who reported that the amounts of β-carbolines in fried ground beef patties increased sharply at 220 °C compared to 160 °C.19 The similar conclusion was drawn from other researches.3,14 Further, in this study, the difference of various concentrations of ANE on the inhibition of the norharman and harman levels was discovered. The maximum inhibition of ANE on norharman formation at both experimental temperatures (38.94% at 170 °C and 24.38% at 190 °C) was achieved when treated with 0.2% of ANE. Interestingly, ANE at the dose of 0.6% caused an increase in norharman level. Tai et al.48 reported that 0.01% α-tocopherol induced a decrease in norharman content by 65% while increasing the dosage to 0.05% and 0.1% promoted norharman production. Tsen et al.8 found that adding rosemary powder at very low concentrations (0.02 and 0.1%) had no significant effect on the level of norharman in beef patties, while a concentration of 0.3% increased the formation of norharman, from 0.33 to 0.76 ng g−1. These results are in accordance with current research that high dosages of antioxidants promote the formation of norharman. Many antioxidants are known to exert either anti- or pro-oxidative effects, depending on the concentration according to the report from Johansson and Jägerstad.49 As for ANE, the pro-oxidative effect appears to dominate when high concentrations are used. Pro-oxidative processes usually increase the production of active carbonyl compounds in the Maillard reaction. Carbonyl compounds are regarded as promoters of the norharman formation.1 This may explain the increase of norharman at high concentrations of added ANE. For harman, treatment with ANE at all dosages led to reductions in harman levels in chicken patties fried at both temperatures. At 170 °C, maximum inhibition (42.62%) was obtained when treated with 0.2% ANE, while at 190 °C it was 61.63% when treated with 0.4% ANE. Similarly, Tai et al.48 found that various amounts of α-tocopherol all reduced harman formation while norharman content was increased under high levels of α-tocopherol. Dong et al.6 reported that different amounts of onion all decreased the formation of norharman while only a small amount of onion was effective in inhibiting harman. It revealed that the effects of antioxidants on the formation of norharman and harman were not necessarily the same. In addition, it can be seen that the effects of ANE on the formation of β-carbolines in the model system and in fried chicken were inconsistent, probably because substances such as lipids and proteins in the food matrix interfered with β-carboline formation.
Total HCA (PhIP, norharman and harman) levels in the control groups were 2.52 ng g−1 and 13.76 ng g−1 when fried at 170 °C and 190 °C, respectively (Table 2). The total amounts of HCAs were lower at all doses of ANE at the two temperatures, with most effective decreases being 40.08% (170 °C) and 56.03% (190 °C). Apparently, in the ANE-treated group inhibition of the formation of HCAs was more effective at 190 °C than at 170 °C. The most likely reason, as proposed in previous reports and consistent with results here,4,19 is that phenol contents and antioxidant activity of ANE were increased by heating at a certain temperature. The strong antioxidant capacity of a natural extract utilized to reduce HCA formation is generally thought to be due to the extract's ability to remove Maillard reaction intermediates (pyrazines, pyridines and carbonyl groups).19 These intermediates react with glucose and amino acids to produce HCAs. ANE has a high phenolic content and antioxidant capacity; therefore, its inhibition of HCA formation is consistent with the theory. ANE appears to be a promising natural supplement that can be used to prevent HCA formation in fried chicken.
The HCA levels both in the crust and interior of the patties were evaluated as shown in Table 3. The highest content of each HCA was found in the crust of the patties fried at 190 °C; this was 20.06 ng g−1 for PhIP, 4.19 ng g−1 for norharman and 2.90 ng g−1 for harman. In contrast, only 0.09 ng g−1, 0.60 ng g−1 and 0.12 ng g−1 were detected in the interior of the patties. Predictably, the external sections of the meats contained markedly higher HCA levels than the inside, presumably because the external sections reached higher temperatures. In the report of Abdulkarim and Smith,50 the temperature was less than 100 °C in the interior when the sausages were fried at 150–230 °C. An important factor causing HCAs to form at the surface was the high temperature. In addition, the surface was exposed to more lipids such that more HCAs would be formed as free radicals were produced through lipid oxidation during frying; this phenomenon has been reported in previous research.51 PhIP was found in the interior of the meat patties only in a very few samples. However, small amounts of β-carbolines, ranging from 0.38–0.62 ng g−1 for norharman and 0.06–0.12 ng g−1 for harman, were detected in the internal parts of all the samples. This finding coincides with the conclusion by Diem and Herderich,52 who found that β-carbolines were detected in a dry hot model system even below 100 °C.
| ANE concentration (%) | PhIP (ng g−1) | Norharman (ng g−1) | Harman (ng g−1) | Total HCAs (ng g−1) | |||||
|---|---|---|---|---|---|---|---|---|---|
| Crust | Interior | Crust | Interior | Crust | Interior | Crust | Interior | ||
| a ANE = Adinandra nitida leaf extract. Values are expressed as means ± SD (n = 3). Means with different letters in the same column and in the same temperature are significantly different (p < 0.05). nq: not quantified, nd: not detected. **p < 0.01, *p < 0.05. | |||||||||
| 170 °C | 0 | 1.55 ± 0.55a | nq | 1.78 ± 0.09a | 0.51 ± 0.01a | 1.13 ± 0.05a | 0.12 ± 0.01a | 4.46 ± 0.67a | 0.63 ± 0.01a |
| 0.2 | 0.97 ± 0.32a b | nd | 1.03 ± 0.05c | 0.47 ± 0.04a b | 0.62 ± 0.08b | 0.08 ± 0.01b | 2.62 ± 0.41b | 0.55 ± 0.04b | |
| 0.4 | 0.53 ± 0.14b | nd | 1.28 ± 0.16b | 0.38 ± 0.02c | 0.41 ± 0.03c | 0.11 ± 0.02a | 2.22 ± 0.33b | 0.49 ± 0.01b | |
| 0.6 | 0.39 ± 0.10b | nd | 1.76 ± 0.10a | 0.45 ± 0.03b | 0.37 ± 0.12c | 0.06 ± 0.01b | 2.52 ± 0.29b | 0.51 ± 0.03b | |
| Sign | * | — | ** | ** | ** | ** | ** | ** | |
| 190 °C | 0 | 20.06 ± 0.46a | 0.09 ± 0.02 | 4.19 ± 0.21a | 0.60 ± 0.05a b | 2.90 ± 0.14a | 0.12 ± 0.01a | 27.15 ± 0.53a | 0.81 ± 0.04a |
| 0.2 | 12.89 ± 0.34a | nq | 3.02 ± 0.07b | 0.54 ± 0.03b c | 2.07 ± 0.05b | 0.08 ± 0.01b | 17.98 ± 0.38b | 0.62 ± 0.04c | |
| 0.4 | 6.77 ± 0.63b | nd | 3.27 ± 0.11b | 0.50 ± 0.04c | 1.38 ± 0.11c | 0.10 ± 0.01a b | 11.41 ± 0.58c | 0.60 ± 0.03c | |
| 0.6 | 5.21 ± 0.91b | nd | 4.06 ± 0.14a | 0.62 ± 0.02a | 0.99 ± 0.06d | 0.11 ± 0.02a | 10.26 ± 1.01c | 0.74 ± 0.01b | |
| Sign | ** | — | ** | * | ** | * | ** | ** | |
3.8. Correlation analysis
The Maillard reaction is influenced by physical and chemical indexes of meat products during thermal processing, which in turn affect the formation of HCAs. In view of this, the correlation between detection indices and HCAs in whole meat patties was analyzed (Table 4). In the results, total lipid, total protein, ash, weight loss, redness a* and protein carbonyl displayed a significantly positive (p < 0.01) relationship with HCA (including individual and total HCAs) levels. Particularly, the correlation coefficients between protein carbonyl and individual HCA were 0.902 for PhIP, 0.687 for norharman and 0.796 for harman, indicating that protein oxidation promoted the formation of these three HCAs. It can be assumed that ANE had also played a role in resisting the formation of HCAs by preventing protein oxidation. Furthermore, moisture was strongly negatively (p < 0.01) correlated with the formation of HCAs, which is consistent with the positive correlation between weight loss and HCA levels.| Moisture | Total lipid | Total protein | Ash | pH | Weight loss | L* value | a* value | b* value | TBARS | Protein carbonyl | |
|---|---|---|---|---|---|---|---|---|---|---|---|
| a **p < 0.01, *p < 0.05. | |||||||||||
| PhIP | −0.745** | 0.628** | 0.781** | 0.813** | 0.407* | 0.761** | −0.097 | 0.842** | 0.430* | 0.257 | 0.902** |
| Norharman | −0.756** | 0.679** | 0.809** | 0.875** | 0.281 | 0.775** | −0.657** | 0.623** | 0.825** | −0.203 | 0.687** |
| Harman | −0.597** | 0.559** | 0.683** | 0.715** | 0.388 | 0.674** | 0.020 | 0.772** | 0.281 | 0.359 | 0.796** |
| Total HCAs | −0.764** | 0.656** | 0.810** | 0.849** | 0.403 | 0.788** | −0.179 | 0.837** | 0.497** | 0.205 | 0.896** |
4. Conclusion
The present study found that ANE is rich in flavonoids and has antioxidant activity, especially after being heated. A certain amount of ANE was proved to effectively inhibit HCAs in model systems and fried chicken patties. Meanwhile, a more effective suppression of HCA formation by various concentrations of ANE was obtained at higher temperature (190 °C). The formation of HCAs in fried chicken patties is greatly affected by temperature. Far more HCAs were produced in the crust of the fried chicken patties than in the internal meat presumably because of the higher temperature in the crust. In summary, the results indicate that ANE has potential applications in the food industry as a natural antioxidant and a potential inhibitor to reduce HCA formation in food when it is heated.Conflicts of interest
There are no conflicts to declare.Acknowledgements
This work was financially supported by the National Key R&D Program of China (2017YFC1600402) and the earmarked fund for Modern Agricultural Industry Technology Research System (CARS14-1-29).References
- X. Bao, J. Miao, Y. Fan and K. Lai, J. Food Process. Preserv., 2020, 44, e14435 CrossRef CAS.
- M. M. Tengilimoglu-Metin, A. Hamzalioglu, V. Gokmen and M. Kizil, Food Res. Int., 2017, 99, 586–595 CrossRef CAS.
- M. Gibis, M. Kruwinnus and J. Weiss, Food Chem., 2015, 168, 383–389 CrossRef CAS.
- I. A. Khan, D. Liu, M. Yao, A. Memon, J. Huang and M. Huang, Meat Sci., 2019, 147, 70–81 CrossRef CAS.
- M. M. Tengilimoglu-Metin and M. Kizil, Meat Sci., 2017, 134, 68–75 CrossRef CAS.
- A. Dong, J. Lee and H. Shin, Food Sci. Biotechnol., 2011, 20, 359–365 CrossRef CAS.
- E. Persson, I. Sjöholm and K. Skog, J. Agric. Food Chem., 2003, 51, 4472–4477 CrossRef CAS.
- S. Y. Tsen, F. Ameri and J. S. Smith, J. Food Sci., 2006, 71, C469–C473 CrossRef.
- T. Sugimura, Mutat. Res., Fundam. Mol. Mech. Mutagen., 1997, 376, 211–219 CrossRef CAS.
- M. R. Khan, M. Naushad, Z. A. Alothman, I. H. Alsohaimi and M. S. Algamdi, RSC Adv., 2015, 5, 2479–2485 RSC.
- E. Oz, PLoS One, 2019, 14, e0221680 CrossRef CAS.
- M. H. Ward, R. Sinha, E. F. Heineman, N. Rothman, R. Markin, D. D. Weisenburger, P. Correa and S. H. Zahm, Int. J. Cancer, 1997, 71, 14–19 CrossRef CAS.
- Q. Wang, Y. Zhang, Y. Ren, W. Cheng, Y. Bi, F. Chen and K. Cheng, RSC Adv., 2020, 10, 34996–35006 RSC.
- Z. Balogh, J. I. Gray, E. A. Gomaa and A. M. Booren, Food Chem. Toxicol., 2000, 38, 395–401 CrossRef CAS.
- H. Keşkekoğlu and A. Üren, Meat Sci., 2014, 96, 1446–1451 CrossRef.
- K. Sabally, L. Sleno, J. A. Jauffrit, M. M. Iskandar and S. Kubow, Meat Sci., 2016, 117, 57–62 CrossRef CAS.
- H. Keskekoglu and A. Uren, Int. J. Food Prop., 2017, 20, S722–S734 CrossRef CAS.
- Y. Zhang, Z. Luo, Z. Shao, C. Yu and S. Wang, J. Agric. Food Chem., 2014, 62, 4798–4802 CrossRef CAS.
- M. A. Jamali, Y. Zhang, H. Teng, S. Li, F. Wang and Z. Peng, Molecules, 2016, 21, 173–187 CrossRef.
- B. Liu, Y. Ma, Y. Liu, Z. Yang and L. Zhang, Trop. J. Pharm. Res., 2013, 12, 1045–1051 CrossRef.
- E. Yuan, B. Liu, Z. Ning and C. Chen, Food Chem., 2009, 115, 1158–1163 CrossRef CAS.
- Y. Chen, G. Chen, X. Fu and R.-H. Liu, J. Agric. Food Chem., 2015, 63, 169–176 CrossRef CAS.
- A. Zwolan, D. Pietrzak, L. Adamczak, M. Chmiel, S. Kalisz, M. Wirkowska-Wojdyła, T. Florowski and J. Oszmiański, LWT–Food Sci. Technol., 2020, 130, 109718 CrossRef CAS.
- L. Chen and Y.-H. Kang, J. Funct. Foods, 2013, 5, 1724–1731 CrossRef CAS.
- M. R. Loizzo, M. Leporini, V. Sicari, T. Falco, T. M. Pellicanò and R. Tundis, Eur. Food Res. Technol., 2017, 244, 523–534 CrossRef.
- M. R. Loizzo, R. Tundis, M. Bonesi, F. Menichini, V. Mastellone, L. Avallone and F. Menichini, J. Food Compos. Anal., 2012, 25, 179–184 CrossRef CAS.
- B. Zhou, Y. Zhao, X. Wang, D. Fan, K. Cheng and M. Wang, J. Sci. Food Agric., 2018, 98, 1988–1994 CrossRef CAS.
- C.-X. Zhang, J. Xi, T.-P. Zhao, Y.-X. Ma and X.-D. Wang, Food Addit. Contam., Part B, 2020, 13, 193–199 CrossRef CAS.
- Y. Yan, S. Zhang, G. Tao, F. You, J. Chen and M. Zeng, J. Chromatogr. B: Anal. Technol. Biomed. Life Sci., 2017, 1068–1069, 173–179 CrossRef CAS.
- M. Zeng, J. Wang, M. Zhang, J. Chen, Z. He, F. Qin, Z. Xu, D. Cao and J. Chen, Food Chem., 2018, 239, 111–118 CrossRef CAS.
- R. Ganhão, D. Morcuende and M. Estévez, Meat Sci., 2010, 85, 402–409 CrossRef.
- M. R. Paudel, M. B. Chand, B. Pant and B. Pant, Biomolecules, 2019, 9, 478 CrossRef CAS.
- Y. Chen, Y. Shen, X. Fu, A. M. Abbasi and R. Yan, Int. J. Food Sci. Technol., 2017, 52, 1820–1827 CrossRef CAS.
- H. Teng, Y. Chen, X. Lin, Q. Lv, T.-T. Chai, F.-C. Wong, L. Chen and J. Xiao, Food Chem. Toxicol., 2019, 129, 138–143 CrossRef CAS.
- I. A. Wani, H. Hamid, A. M. Hamdani, A. Gani and B. A. Ashwar, J. Adv. Res., 2017, 8, 399–405 CrossRef CAS.
- J. H. Muyonga, B. Andabati and G. Ssepuuya, Food Sci. Nutr., 2014, 2, 9–16 CrossRef CAS.
- P. B. Devi, R. Vijayabharathi, S. Sathyabama, N. G. Malleshi and V. B. Priyadarisini, J. Food Sci. Technol., 2014, 51, 1021–1040 CrossRef CAS.
- D. S. Arora and P. Chandra, Braz. J. Microbiol., 2010, 41, 765–777 CrossRef CAS.
- F. Lu, G. K. Kuhnle and Q. Cheng, Food Control, 2018, 92, 399–411 CrossRef CAS.
- F. Oz and T. Celik, J. Food Process. Preserv., 2015, 39, 2442–2454 CrossRef CAS.
- M. Roldan, T. Antequera, M. Armenteros and J. Ruiz, Food Chem., 2014, 149, 129–136 CrossRef CAS.
- J. M. Broncano, M. J. Petrón, V. Parra and M. L. Timón, Meat Sci., 2009, 83, 431–437 CrossRef CAS.
- A. K. Das, V. R. Rajkumar, P. K. Nanda, P. Chauhan, S. R. Pradhan and S. Biswas, Antioxidants, 2016, 5, 16 CrossRef.
- J. E. Brow, H. Khodr, R. C. Hider and C. A. Rice-Evans, Biochem. J., 1998, 330, 1173–1178 CrossRef.
- W. Zhang, S. Xiao and D. U. Ahn, Crit. Rev. Food Sci. Nutr., 2013, 53, 1191–1201 CrossRef CAS.
- L. Hu, S. Ren, Q. Shen, J. Chen, X. Ye and J. Ling, RSC Adv., 2017, 7, 27496–27505 RSC.
- S. S. Turgut, A. Soyer and F. Işikçi, Meat Sci., 2016, 116, 126–132 CrossRef CAS.
- C.-Y. Tai, K. H. Lee and B. H. Chen, Food Chem., 2001, 75, 309–316 CrossRef CAS.
- M. A. E. Johansson and M. Jägerstad, Food Chem., 1996, 56, 69–75 CrossRef CAS.
- B. G. Abdulkarim and J. S. Smith, J. Agric. Food Chem., 1998, 46, 4680–4687 CrossRef CAS.
- M. Johansson and M. Jägerstad, Food Chem. Toxicol., 1993, 31, 971–979 CrossRef CAS.
- S. Diem and M. Herderich, J. Agric. Food Chem., 2001, 49, 2486–2492 CrossRef CAS.
| This journal is © The Royal Society of Chemistry 2021 |