
 Open Access Article
 This Open Access Article is licensed under a Creative Commons Attribution-Non Commercial 3.0 Unported Licence
The electrochemical performance of reduced graphene oxide prepared from different types of natural graphites
Luo Yangab,
Lingyan Zhangab,
Xuan Jiao *c,
Yangshuai Qiu*ab and
Wenlu Xuab
*c,
Yangshuai Qiu*ab and
Wenlu Xuab
aSchool of Resources and Environmental Engineering, Wuhan University of Technology, Luoshi Road 122, Wuhan, Hubei 430070, China. E-mail: qiuyangshuai@whut.edu.cn
bHubei Province Key Laboratory for Processing of Mineral Resources and Environment, Wuhan University of Technology, Luoshi Road 122, Wuhan, Hubei 430070, China
cSoutheast University, Southeast Road 2nd, Nanjing, Jiangsu 211189, China. E-mail: x.jiao@seu.edu.cn
First published on 20th January 2021
Abstract
Graphene, as a new type of carbon material in the forefront of research, has been applied widely in the area of supercapacitors with the advantages of a large positive specific surface, high conductivity, stable chemical properties and good supercapacitor performance. In this study, an investigation on the electrochemical performance of reduced graphene oxides (rGOs) prepared from various natural graphites was conducted. X-ray diffraction, X-ray photoelectron spectroscopy, Fourier transform infrared spectroscopy, Raman spectroscopy, atomic force microscopy and electrochemical performance analysis were performed to characterize the as-prepared GOs and rGOs. The results demonstrated that a reduction modification of GO was necessary to optimize its electrochemical performance. The rGO has a great electrochemical performance with a good repair ability, better oxygen-containing functional group removal effect, lower structural defects, larger average size of the in-plane sp2 region and great specific capacitance.
1 Introduction
The increasing shortage of energy and environmental pollution drive supercapacitors, a new type of energy storage device, to receive more and more attention and research.1 Due to their long service life, excellent cycling performance, large specific capacitance, high power density and safety,2–5 supercapacitors have been widely used in traditional industry, transportation, electromechanical products, new energy development and utilization, and military affairs.6,7 According to the mechanism of energy storage, supercapacitors can be divided into two categories: double-layer capacitors and pseudo-capacitors. It is very important to choose the electrode material since the selection of electrode material plays a leading role in the performance of the supercapacitor. Carbon, transition metal oxides and conductive polymers are commonly used for electrode preparation in current applications.8–10Graphene, one of the new carbon materials in the forefront of research, has been used widely in the preparation of supercapacitors with the advantages of a large positive specific surface, high conductivity, stable chemical properties, good electrochemical performance and good supercapacitor performance.11 Numerous methods, including mechanical exfoliation,12,13 electrostatic deposition,14 chemical vapor deposition (CVD),15,16 liquid-phase exfoliation,17 solvothermal methods,18 epitaxial growth via thermal graphitization of silicon carbide,19 unzipping carbon nanotubes,20 and reduction of graphene oxide21,22 have been proposed to synthesize graphene. Among them, the reduction of graphene oxide has been widely used in the large-scale preparation of graphene in industrial applications, which is the most important field of preparation of graphene and carbon-based composite materials.23
Due to the preparation based on different kinds of natural graphite, there is a great difference on the degrees of structural defects, existence and content of oxygen-containing functional groups of graphene, all of which display a great influence on the performance of supercapacitors.24,25 Therefore, the study of the electrochemical performance of graphene prepared from four different types of natural graphite is of great significance to the selection of electrode materials for supercapacitors. The electrochemical performance on different types of graphene samples was analyzed by cyclic voltammetry tests, constant current charge–discharge tests and alternating-current (AC) impedance tests. In addition, XPS and Raman analysis were used to explain the difference in electrochemical performance of the produced rGO at the microstructure level. This work reveals the influence of different types of graphite on the structural properties and electrochemical properties of graphene oxide, establishing the correlation between natural graphite raw materials and the application direction of synthetic graphene oxide, and providing a theoretical basis to select a suitable one for graphene oxide-related industrial applications.
2 Experimental
2.1 Materials and chemicals
Four different types of natural graphite were selected as the raw materials. The vein graphite from Sri Lanka was marked as VG (vein graphite), the large flake graphite from Madagascar was marked as LG (large flake graphite), the fine flake graphite from Mozambique was labeled as FG (fine flake graphite), and the cryptocrystalline graphite from the Panshi area of Jilin Province was named as AG (aphanitic graphite). The purities of these were all more than 99%. Besides, the size fraction of the samples was 38–45 μm. Potassium permanganate, sodium nitrate, 98% sulfuric acid, 36% hydrochloric acid, 30% hydrogen peroxide and 85% hydrazine hydrate were all purchased from Sinopharm Chemical Reagent Co., Ltd, China. The resistivity of the deionized water used in this experiment was 18.25 MΩ cm.2.2 Preparation of reduced graphene oxide (rGO)
Graphite oxide (GrO) was prepared according to the Hummers method as reported previously.26,27 The GrOs prepared from VG, LG, FG and AG were labeled as GrO-VG, GrO-LG, GrO-FG and GrO-AG. The milled GrO powders were dispersed into deionized water to form yellow-brown suspensions. The suspensions were ultrasonically exfoliated using a Cole Parmer ultrasonic processor with 60% amplitude for 12 min, and then were centrifuged at 2800 rpm for 20 min to remove the non-exfoliated GrO, and GOs were obtained. The GOs were labelled as GO-VG, GO-LG, GO-FG, and GO-AG based on the materials. Furthermore, 5 mL of 85% hydrazine hydrate was mixed with the GO suspension, while the pH was adjusted to 10 using a 0.1 M NaOH aqueous solution. Subsequently, the reaction mixture was filtered and washed the with methanol and water several times after being kept at 97 °C for 8 h. Finally, the rGO powders were obtained after drying at 60 °C for 24 h in vacuo. The rGOs obtained after the reduction of GO-VG, GO-LG, GO-FG and GO-AG were labelled as rGO-VG, rGO-LG, rGO-FG and rGO-AG, respectively.2.3 Preparation of electrodes
The electrochemical performance test was completed with a three-electrode test system under room temperature conditions in the laboratory. Firstly, the KOH solution of 6.0 mol L−1 was applied as the electrolyte, and the counter electrode was a platinum wire electrode, with a saturated Hg/HgO electrode as the reference electrode.The specific preparation process of the working electrode is as follows:
First of all, a mixture composed of the testing sample, acetylene black and polytetrafluoroethylene emulsion with a mass ratio of 85![[thin space (1/6-em)]](https://www.rsc.org/images/entities/char_2009.gif) :10:5 was obtained, and then a certain amount of isopropanol was added with sustained stirring for 5 min until it became viscous. Subsequently, the as-prepared mixture was evenly coated in the middle of two foamed nickel sheets with a size of 1 cm × 1 cm, drying in a constant temperature drying oven at 60 °C for 12 hours. Finally, the dried foamed nickel interlayer was placed in an electric tablet press under a pressure of 10 MPa for 5 min. The tested working electrode was obtained after cutting off the excess material over the edge of the foamed nickel sheets.
:10:5 was obtained, and then a certain amount of isopropanol was added with sustained stirring for 5 min until it became viscous. Subsequently, the as-prepared mixture was evenly coated in the middle of two foamed nickel sheets with a size of 1 cm × 1 cm, drying in a constant temperature drying oven at 60 °C for 12 hours. Finally, the dried foamed nickel interlayer was placed in an electric tablet press under a pressure of 10 MPa for 5 min. The tested working electrode was obtained after cutting off the excess material over the edge of the foamed nickel sheets.
2.4 Measurements
An X-ray diffractor (XRD) purchased from the Bruker Corporation of Germany was used to generate patterns, which were recorded in the range 2θ = 5–80° using a D8 Advance model X-ray powder diffractometer with Cu Kα radiation (λ = 1.5406 Å).The X-ray photoelectron spectroscopy (XPS) spectra were obtained on a VG Multilab 2000 brought from the Thermo Electron Corporation of the USA. The machine has a monochromatic Al X-ray source operating at 300 W and the spectra were corrected using the C 1s peak at 284.6 eV.
A Nicolet IS-10 infrared spectrometer purchased from the Nicolet Corporation of the USA was used to record the Fourier transform infrared (FT-IR) spectra within the range from 400 to 4000 cm−1.
A Renishaw INVIA Raman microscope equipped with an Ar laser probe was brought from the Renishaw Corporation of England to obtain the Raman spectra of all the samples at the 514.5 nm mode, 500 to 3500 cm−1 Raman region.
Atomic force microscopy (AFM) images of the as-prepared rGOs were recorded using a Bruker MultiMode 8 AFM produced by the Bruker Corporation of Germany in a peak force tapping mode.
Cyclic voltammograms (CV) were conducted over a sweep potential scope of −0.90 to 0.10 V at various scan rates. The specific capacitance of the electrodes could be calculated by the following equation:
 | (1) |
3 Results and discussion
3.1 The properties of natural graphites
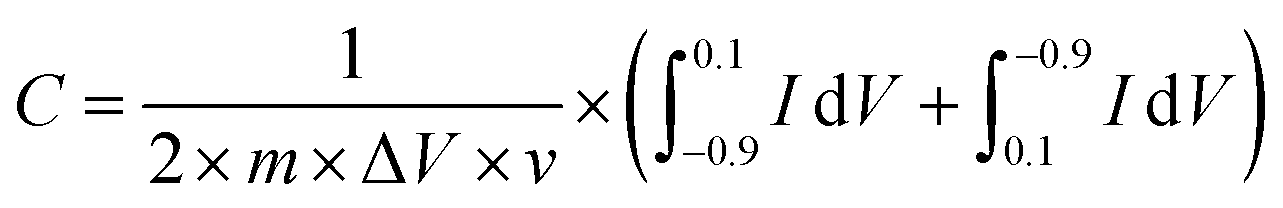
Fig. 1a demonstrates that the four types of graphite samples present similar X-ray diffraction patterns with typical graphite peaks. The sharp and strong peaks appear at 2θ = 26.5°, corresponding to the (002) reflection plane of natural graphite. And the relatively weak peaks appear at 2θ = 54.6° due to the (004) reflection plane of natural graphite. The high purity of the sample means that almost no diffraction peaks of other impurity minerals appear. Comparing the XRD patterns of the samples, it can be seen that the difference in the intensity of the characteristic diffraction peaks of the four samples was particularly obvious. Among these, the intensities of the diffraction peaks of VG and LG were relatively higher than those of FG and AG, which is mainly caused by the crystal difference, including the difference in surface oxygen atom content, the degree of crystal defects, and crystal grain size. VG and LG have a higher crystallinity and diffraction peak intensity. However, FG and AG are the opposite. From the FWHM in Fig. 1a, the half-width values of the VG and LG samples were higher than those of FG and AG, indicating that the first two samples have a greater crystallinity, identifying with the previous analysis results. Graphitization can reflect the degree of graphite crystallization.28–30 According to the mathematical model, the graphitization degree can be calculated on the basis of the (002) mesh spacing in the X-ray diffraction pattern. The formula is shown below .31–33
 | (2) |
 | ||
| Fig. 1 Characterization of different natural graphites. (a) XRD pattern of natural graphite samples. (b) The variation trend of unit cell volumes with graphitization degree. (c) XPS spectrum of natural graphite samples. (d) Raman spectrum of natural graphite samples. | ||
The corresponding d002 values of VG, LG, FG and AG were 0.33786, 0.33668, 0.33596 and 0.33558 nm, respectively. The corresponding graphitization degrees calculated according to the formula were 97.91%, 93.48%, 85.12% and 71.39%, respectively, indicating that the crystalline morphology from AG to VG gradually approached the graphitization degree of ideal graphite.
In addition, since different crystal types also have a crucial role in impacting the crystal structure of graphite, the content of 3R polytypes in the graphite crystals is also used as an important indicator to measure the integrity of the graphite structure. Besides the mesh spacing, d002 is directly proportional to the 3R polytype content, while the graphitization degree is inversely proportional to it. The calculation formula is as (3)–(5).
| Rh(1) = 44.3113 − 38.7846g | (3) |
| Rh(2) = 684.33d002 − 2283.02 | (4) |
| Rh = (Rh(1) + Rh(2))/2 | (5) |
The results for the 3R polymorphism content of VG, LG, FG and AG were 9.895%, 12.06%, 16.14% and 23.26%, respectively. Different types of natural graphite all contain 3R polytype graphite to varying degrees. From VG to AG, there was an increasing trend in the 3R polytype content and the degree of graphitization, while the degree of crystallization gradually weakened.
The unit cell parameters calculated based on the X-ray diffraction results of the natural graphite sample were 0.03533 V nm−3 for VG, 0.03540 V nm−3 for LG, 0.03554 V nm−3 for FG, and 0.03593 V nm−3 for AG. It can be seen from Fig. 1b that the unit cell volume of AG was the largest, followed by FG, and the unit cell volumes of LG and VG were relatively small. The reason was that from VG to AG, the graphitization degree of graphite was getting increasingly low, and the amount of other oxygen-containing impurity components and oxygen-containing functional groups that can increase the oxygen content in the graphite crystal structure gradually augmented, resulting in a gradual upgrade in the degree of defects. In addition, the larger atomic radius of oxygen atoms than of carbon atoms balanced the small size effect of the graphite sample, so that the unit cell volume increased with the boost of oxygen content.
It can be seen from Fig. 1c that the XPS full spectrum scans of the four natural graphite samples had similar shapes, with strong peaks appearing at around 284.50 eV, and relatively weak peaks appearing at the binding energy of about 531.5 eV, indicating that carbon was the highest element content on the sample surface, followed by the oxygen element. Since the content of Si was tiny, the intensity of the Si 2p peak at about 153.30 eV was very weak. Among them, from VG to AG, the binding energy of O 1s and C 1s showed a gradually increasing trend. According to the results of the relative content of C/O elements, it can be concluded that a larger C/O ratio corresponded to the more complete graphite crystals, which is consistent with the XRD results.
Fig. 1d shows that all the Raman spectra of the four natural graphite samples have a D peak caused by the breathing mode of A1g symmetric K-order phonons, and the G peak caused by the scattering of the first-order E2g phonons, located at 1350 cm−1 and around 1585 cm−1, both were closely related to the lattice defects and disorder of graphite. Generally, the calculated relative strength ratio (ID/IG) of the two can be used to measure the degree of structural defects and crystal disorder of graphite and its derivative materials.34 Table 1 illustrates that the intensity ratio ID/IG of the D peak to the G peak of the four samples from VG to AG continued to swell, implying that the graphite with a low graphitization degree had an inferior crystallinity and severe crystallinity defects. In addition, the higher the degree of defect in graphite, the more activated carbon atoms exposed on the surface.
| Sample | D peak/cm−1 | G peak/cm−1 | ID/IG |
|---|---|---|---|
| VG | 1345.12 | 1585.56 | 0.05 |
| LG | 1337.74 | 1585.56 | 0.19 |
| FG | 1336.82 | 1584.68 | 0.25 |
| AG | 1339.59 | 1582.90 | 0.36 |
3.2 Electrochemical performance of the rGOs
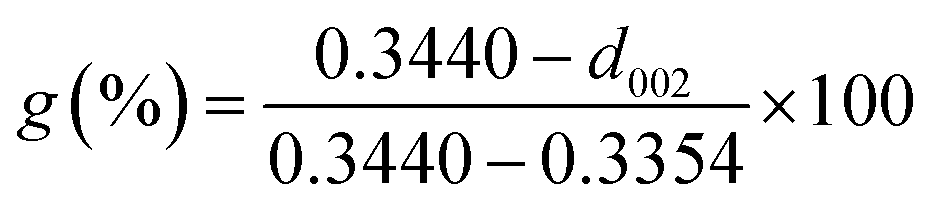
The CV curves of graphene products with different reduction degrees after adding different dosages of hydrazine hydrate to the GO-VG suspension are shown in Fig. 2a–d. A small dose of hydrazine hydrate was not enough to remove a large dose of electrochemically inert oxygen-containing functional groups on the surface of the graphene oxide hydroxyl and carboxyl groups, resulting in a poor specific capacitance. Therefore, a sloping curve appears in Fig. 2a.35 The CV curve gradually approached an ideal rectangle and had an excellent double-layer capacitor performance when the amount of hydrazine hydrate was higher than 5.0. Due to the high degree of graphitization of VG, great crystallinity and difficulty of oxidization,36 the oxidation degree of GO-VG was relatively low. This sample can be completely reduced as the amount of hydrazine hydrate was 5.0, and had a satisfying specific capacitance value. As the amount of hydrazine hydrate continued to increase, too much of the strong reducing hydrazine hydrate slightly damaged the structure of the graphene, and the specific capacitance of graphene oxide after the reduction slightly decreased.37 In addition, the shape of the CV curve deviated at different scan rates, and the quicker the scan rate, the more obvious the deviation of the curve from the ideal rectangle. | ||
| Fig. 2 CV curves of rGO-VG with different reduction rates at different scanning rates. | ||
Fig. 3 shows CV curves of the graphene products with different degrees of reduction after hydrazine hydrate was added to the GO-LG suspension. It can be seen from the curve that the overall change trend was similar to that of rGO-VG. A small amount of hydrazine hydrate caused a larger curve slope, severe polarization, and a poor double capacitor. The CV curve gradually approached the ideal rectangular shape as the amount of hydrazine hydrate became higher than 5.0, and there was no obvious Faraday redox peak at both ends of the voltage window, which showed a good double capacitance.38 Compared with rGO-VG, the sufficient oxidation and reduction process removed more oxygen-containing functional groups on the surface of rGO-VG, resulting in an electron mobility and electrical conductivity that were superior to those of rGO-VG, so it showed a more excellent electrochemical performance. Similar to the reduction process of rGO-VG, when the amount of reducing agent was extreme, the specific capacitance tended to drain away.
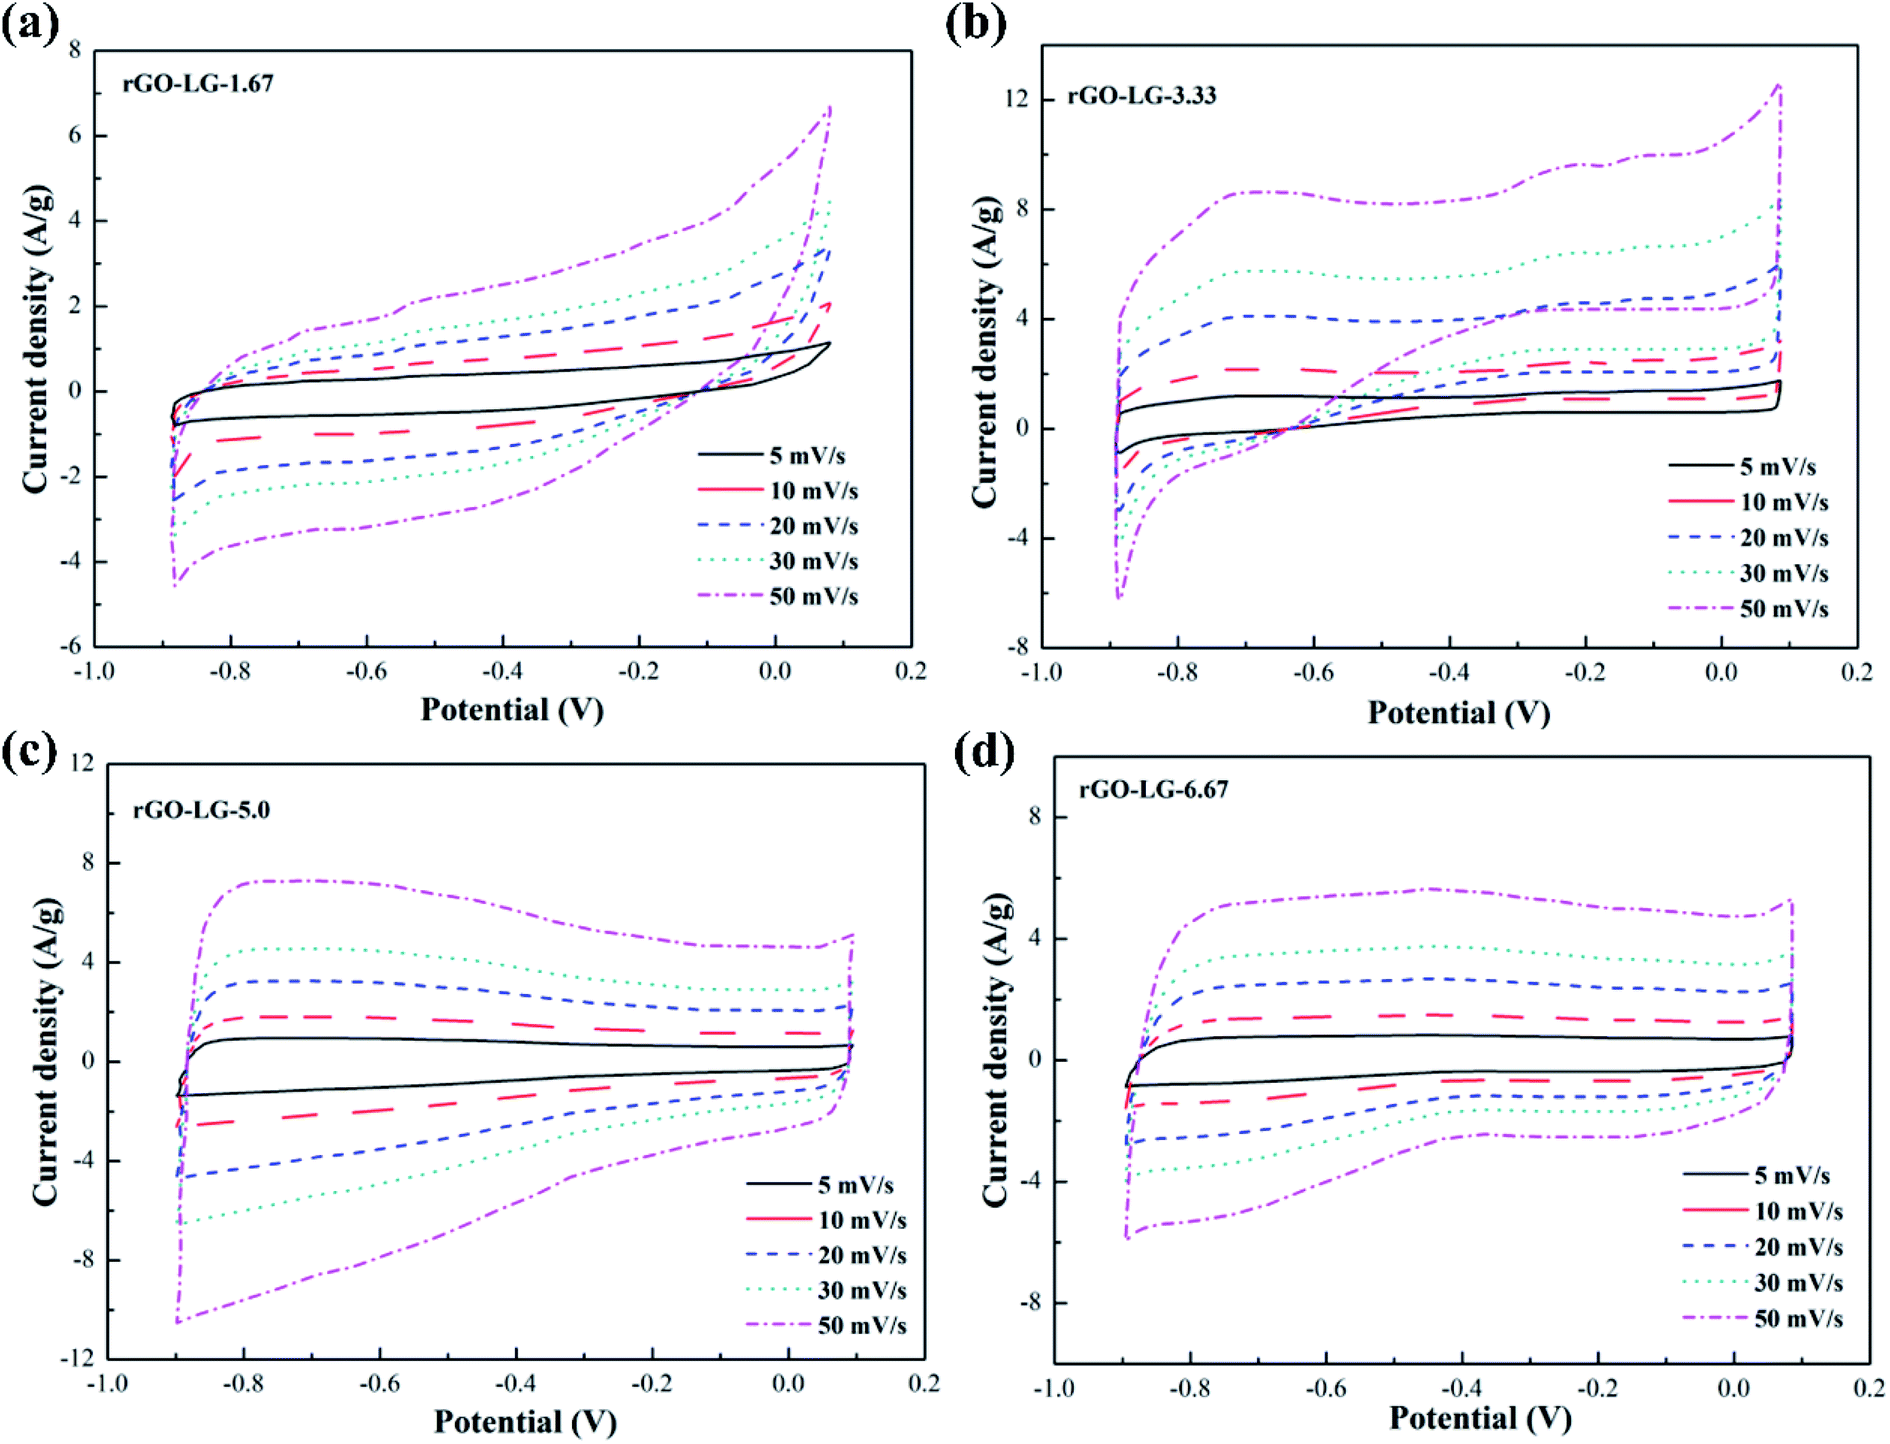 | ||
| Fig. 3 CV curves of rGO-LG with different reduction rates at different scanning rates. | ||
The CV curves of graphene products with different degrees of reduction after adding hydrazine hydrate to the GO-FG suspension are presented in Fig. 4. The overall curve is inclined and shows an irregular shape as less hydrazine hydrate was added. As the amount of hydrazine hydrate increased, the CV curve gradually approached the ideal rectangular shape for electrode materials with different reduction degrees. Compared with rGO-VG and rGO-LG, the lower graphitization and crystallinity made FG less problematic when oxidized during the oxidation process, and its surface exposed more oxygen-containing functional groups, which made it difficult to entirely remove a large number of electrochemically inert groups during the reduction process, and the surface still remained. In addition, as the scanning rate increased, the CV curve gradually deviated from the rectangular contour, and an electrochemical polarization was manifest, which led to irregular diffusion of ions in the electrolyte and a deterioration in the specific capacitance.
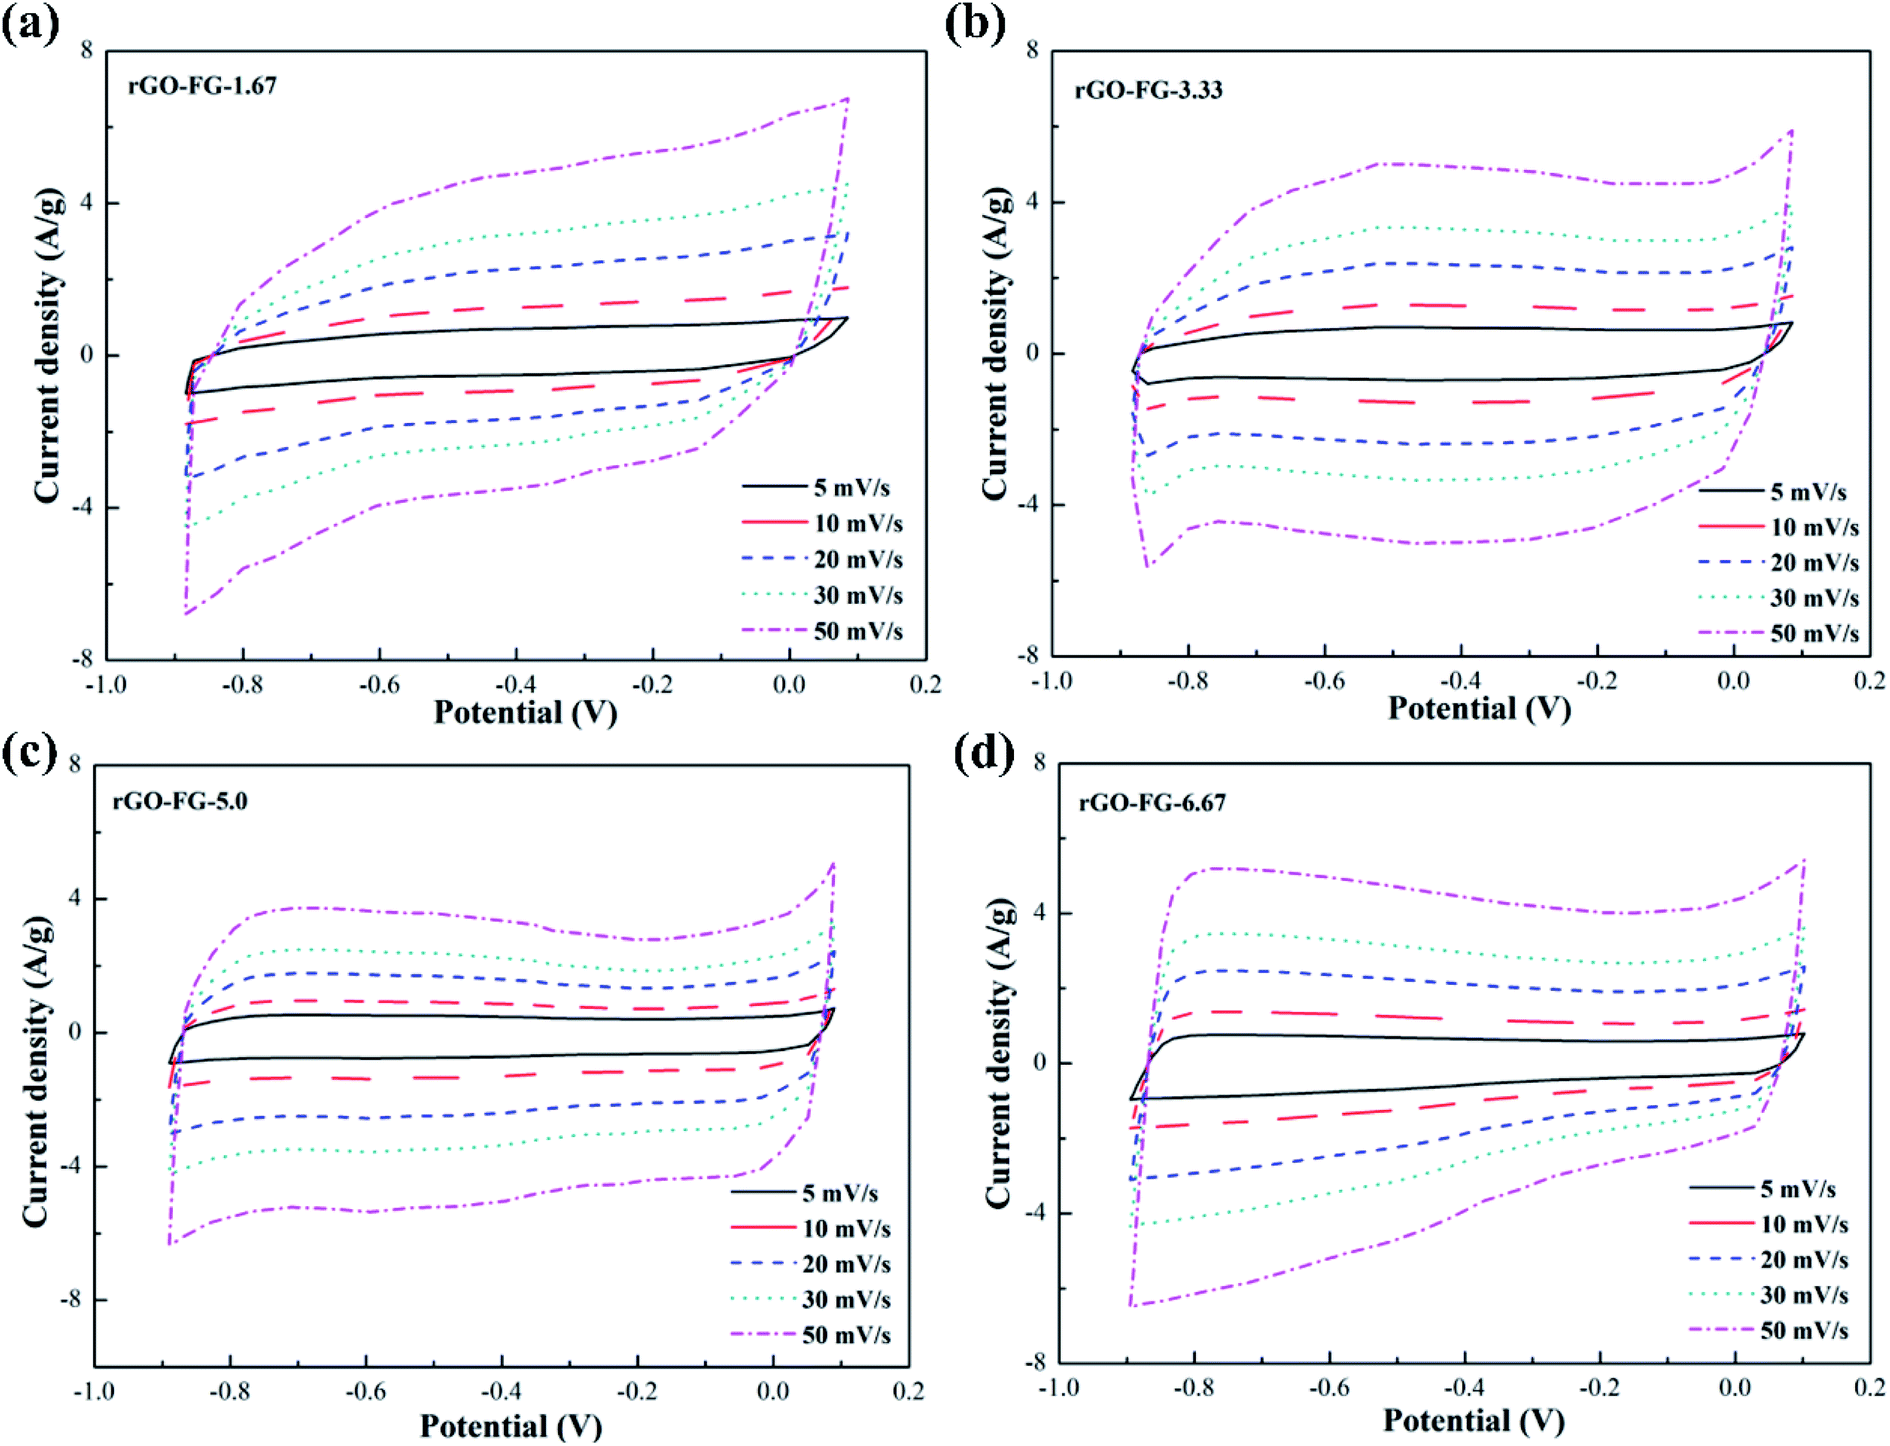 | ||
| Fig. 4 CV curves of rGO-FG with different reduction rates at different scanning rates. | ||
Fig. 5 illustrates the CV curves of graphene products with different degrees of reduction by adding hydrazine hydrate to the GO-AG suspension. It can be seen from the curves that the overall trend of change was similar to that for the rGO-FG products. A little bit of reducing agent left a large number of oxygen-containing functional groups on the surface, and the polarization effect was stronger during the electrochemical reaction. The curve as a whole extended to the window at both ends of the voltage, which deviated significantly from a rectangular shape. With an increase in the amount of reducing agent, the surface electrochemical inert functional groups were removed significantly, and the CV curve gradually approached a rectangular shape. Compared with the other three samples, AG's inferior crystallinity, graphitization degree, and superior degree of oxidation made it require a larger amount of reducing agent in the reduction process. The sufficient oxidation process made the surface of the product full of oxygen-containing functional groups, so that the reduction process couldn't thoroughly remove them, and the structural defects were serious, which reduced its conductivity.
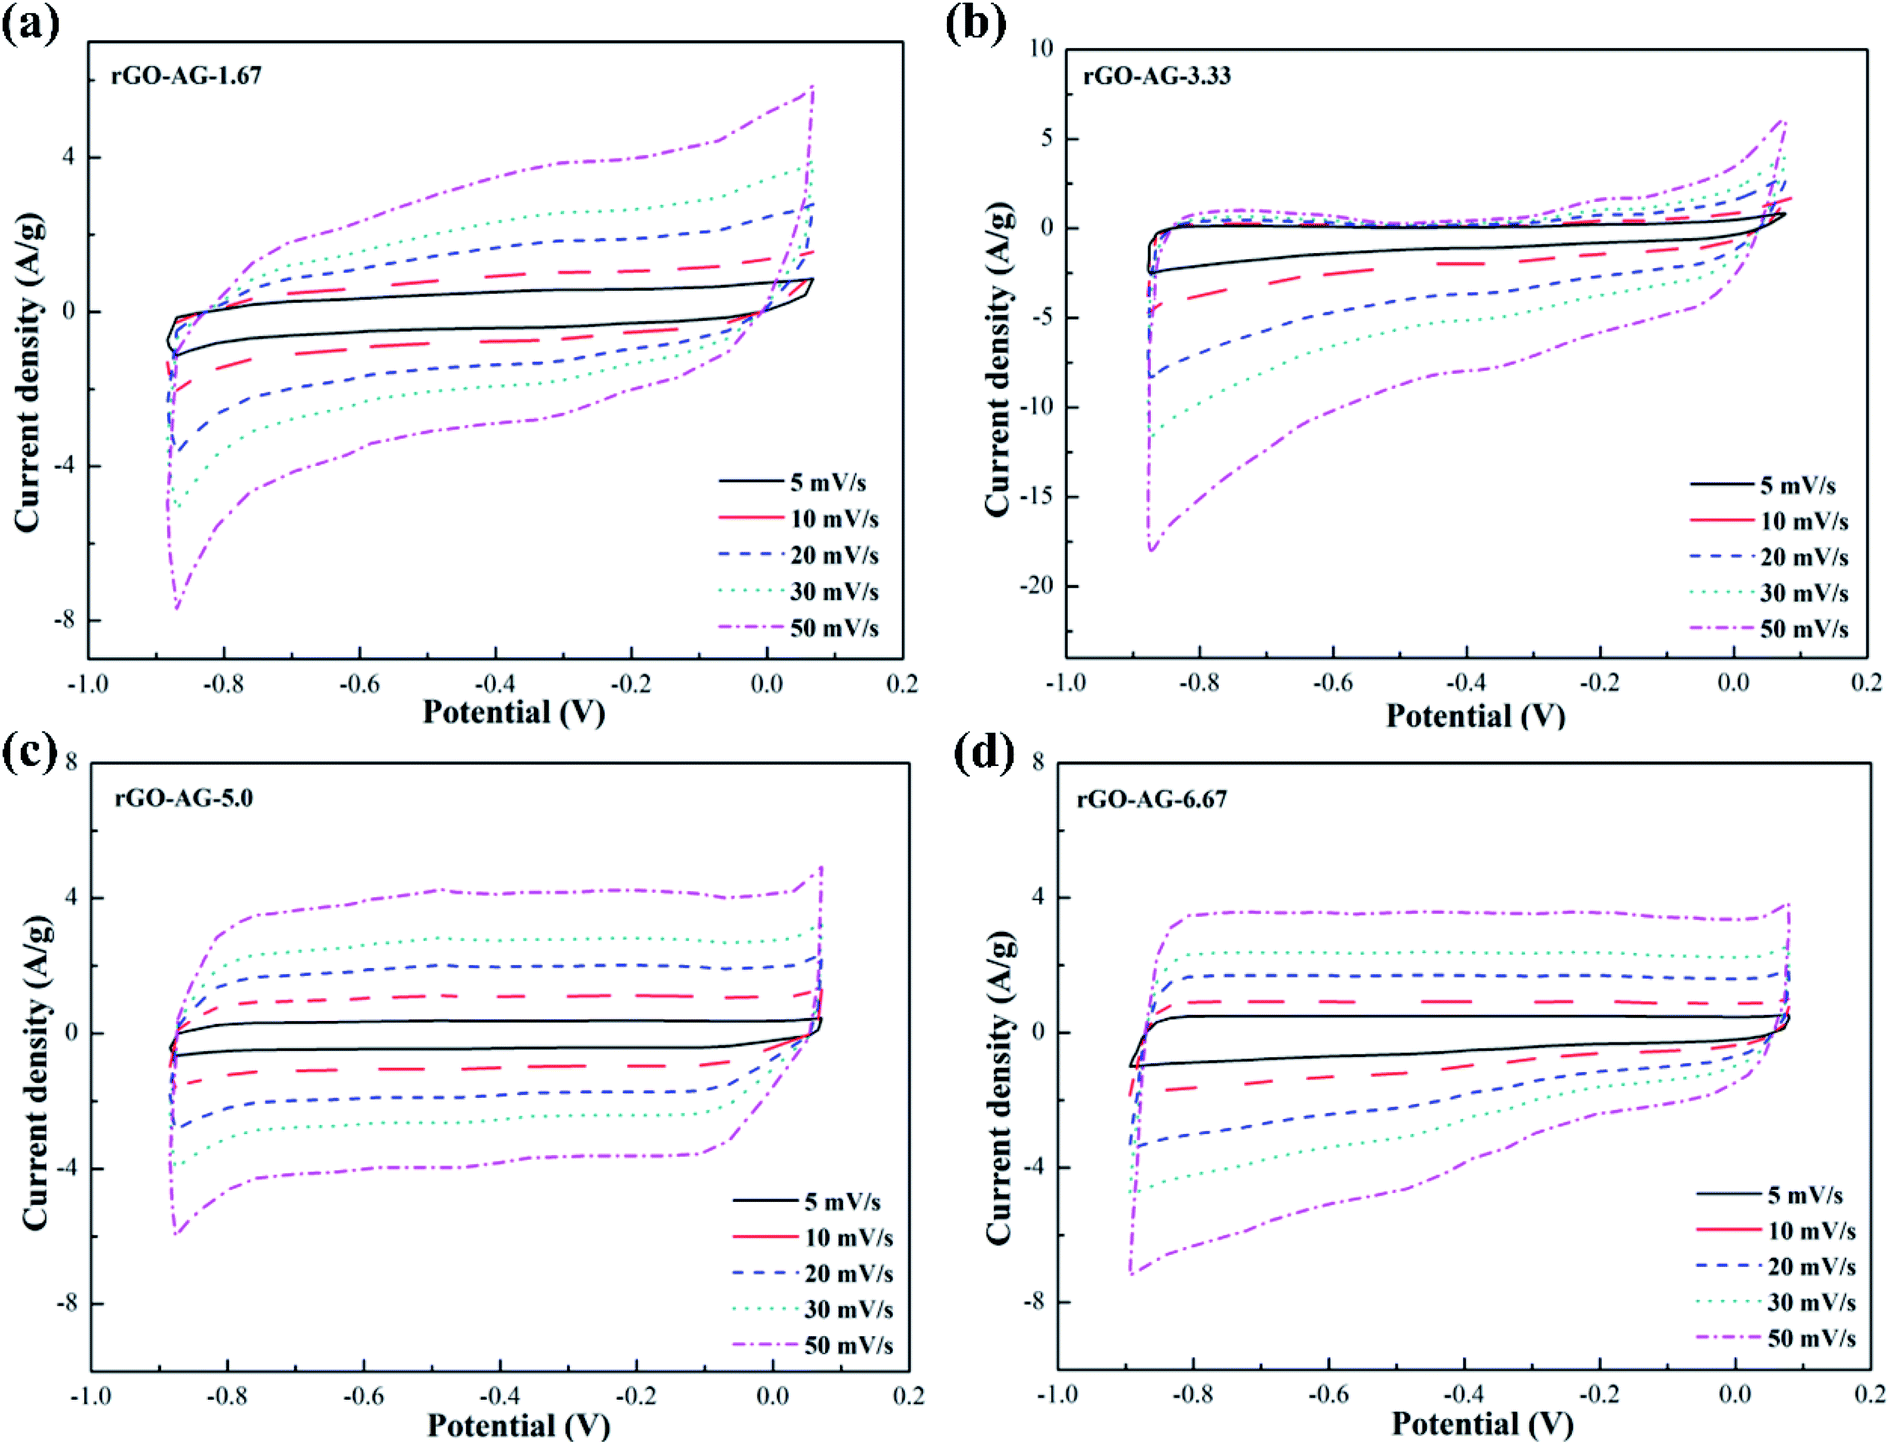 | ||
| Fig. 5 CV curves of rGO-AG with different reduction rates at different scanning rates. | ||
Fig. 6 shows the AC impedance diagrams of rGOs with different degrees of reduction as electrodes. The AC impedance diagram of the electrode material shows a significant change with the increase in the amount of reducing agent. The entire spectrum is composed of two parts, the high-frequency area in the shape of a circular arc and the low-frequency area in the form of a linear curve. The diameter of the incomplete semicircular arc in the high-frequency region represents the interface resistance between the electrode and the electrolyte. The smaller the semicircle diameter, the weaker the interface resistance. The slope of the similar linear curves in the low frequency region is related to the double layer capacitance of the electrode material. The closer the linear curve was to the vertical, the preferable the double layer capacitance of the electrode material, and the weaker the resistance of electrolyte ions in the diffusion process.
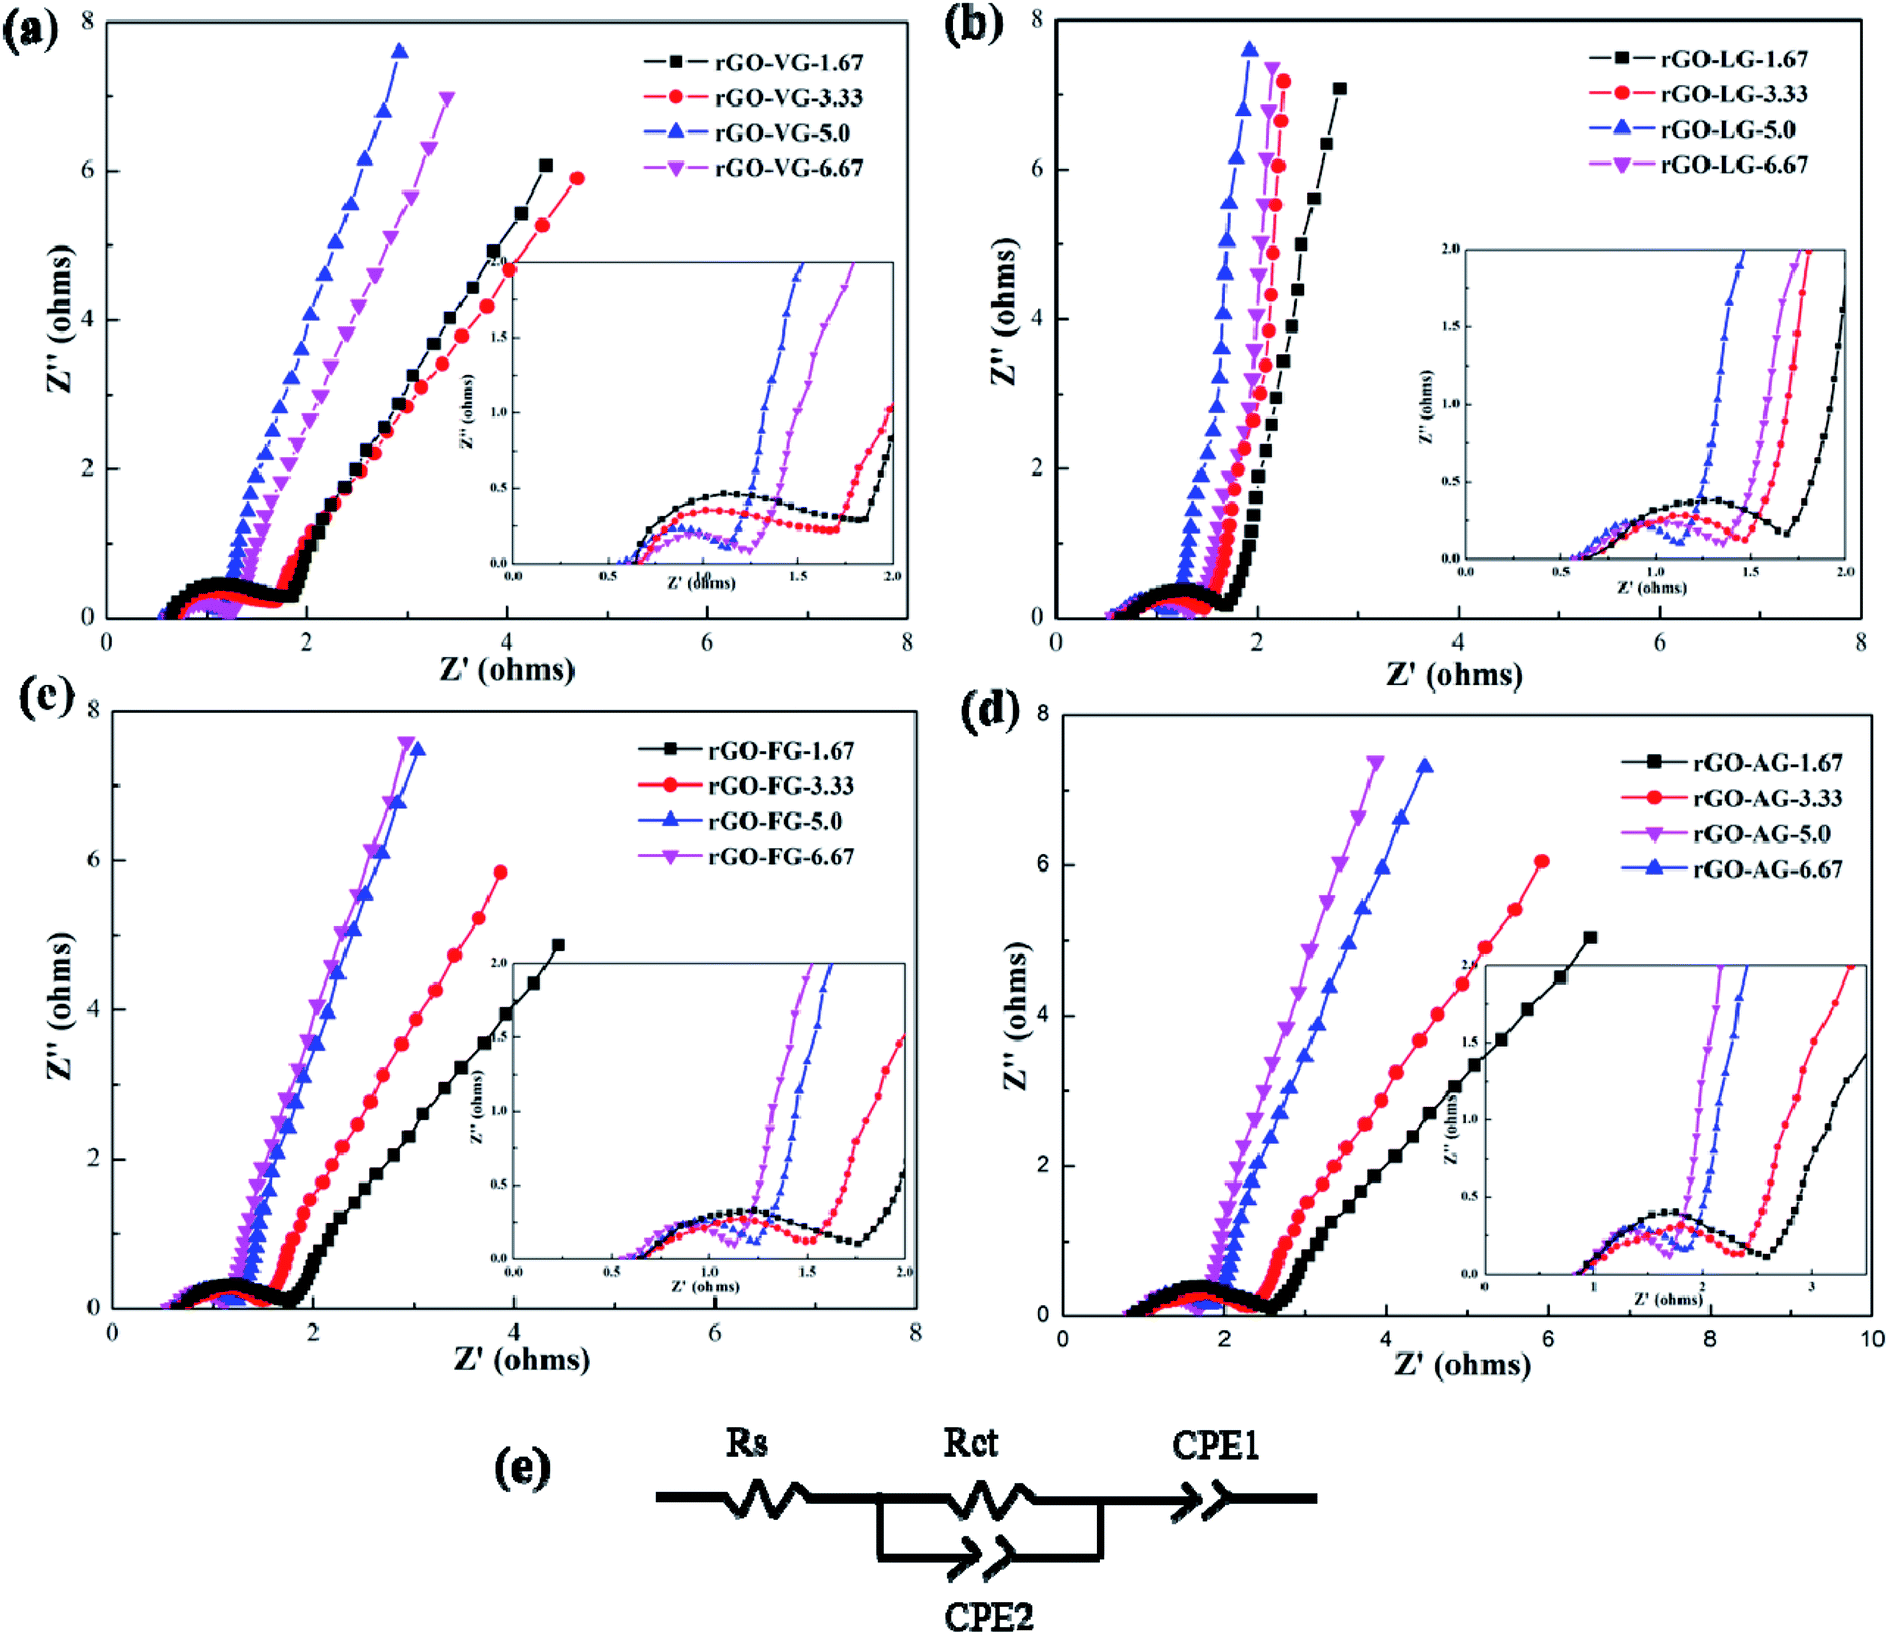 | ||
| Fig. 6 AC impedance curves of rGOs with different degrees of reduction and the equivalent circuit used to analyze EIS. | ||
It can be seen from Fig. 6a and b that the trends in impedance change of the rGO-VG and rGO-LG products as electrodes were relatively similar. As the degree of product reduction upgraded, the diameter of the semi-circular arc curve in the high-frequency region first decreased and then increased, which was contrary to the law in the low-frequency region. When the amount of reducing agent was 5.0, the transfer resistance of the electrode and electrolyte interface and the diffusion resistance of electrolyte ions were the minutest, and an excellent capacitance performance occurred, consistent with the previous test results. Compared with the rGO-VG products as electrode materials, the rGO-LG products had a weaker resistance to interface diffusion and ion flow, so they exhibited a better capacitance and outstanding specific capacitance. It was worth noting that when rGO-LG products with different reduction levels were used as the electrode materials, the slope of the curve in the AC impedance spectrum was relatively large, close to the vertical line, indicating that the oxygen-containing functional groups on the surface were effectively removed during the reduction process. With the result that the capacitance of the reduction product was better than that of the other three graphene electrode materials, the specific capacitance value was relatively high, which was consistent with the previous electrochemical test results.
Comparing Fig. 6c and d, it can be seen that the changes in the processes of the AC impedance diagram of the rGO-FG and rGO-AG products as electrodes were similar. When the amount of reducing agent increased continuously, the radius of the semicircular arc in the high frequency region decreased, and the electrode interface resistance tapered off. At the same time, the curve in the low frequency region was became more sloping, and the diffusion resistance of the electrolyte ions in the reaction gradually degraded. In particular, when rGO-AG products with different reduction degrees were used as the electrode materials, the semicircular arc diameter in the AC impedance spectrum was larger than those of the other three products, and the slope of the linear curve was relatively gentle, meaning that there were still more oxygen-containing functional groups remaining on the surface of the AG reduced graphene oxide product after the reduction reaction. Hydration reduction could only remove part of them, resulting in a larger degree of structural defects of the product, and the capacitance was weaker than that of the other three graphene electrode materials, such that the specific capacitance value was relatively low, which was consistent with the previous electrochemical test results.
The results of equivalent circuits on different graphene samples is shown in Table 2. The Rct values of rGO-AG and rGO-FG decreased with an increasing reduction degree, while the values of rGO-VG and rGO-LG first decreased and then rose, displaying an identical trend to the previous CV and charge–discharge curves.
| Hydrazine dose | Samples | |||
|---|---|---|---|---|
| rGO-VG | rGO-LG | rGO-FG | rGO-AG | |
| 1.67 | 0.85 Ω | 0.74 Ω | 1.26 Ω | 1.60 Ω |
| 3.33 | 0.79 Ω | 0.68 Ω | 1.21 Ω | 1.55 Ω |
| 5.0 | 0.75 Ω | 0.65 Ω | 1.19 Ω | 1.51 Ω |
| 6.67 | 0.81 Ω | 0.70 Ω | 1.15 Ω | 1.43 Ω |
3.3 Characterization of the rGOs
Fig. 7a shows the XRD spectra of reduced graphene oxide products with different degrees of reduction. Unlike the XRD spectra of the four kinds of GO, the sharp diffraction peak disappeared at 2θ = 10° and a clear diffraction peak appeared at 2θ = 26.53°, with the characteristic peak wider than that of natural graphite. The (002) mesh spacings calculated by the Bragg formula of rGO-VG, rGO-LG, rGO-FG and rGO-AG were 0.3554, 0.3546, 0.3569 and 0.3579 nm, respectively, close to that of natural graphite, indicating that the original destroyed graphite crystal structure could be repaired to a certain extent by hydration reduction with hydrazine hydrate. Nevertheless, the remaining large amount of oxygen-containing functional groups introduced during the oxidation process caused the (002) surface to widen, evidencing that the reduced graphene products were not completely stacked in order.39 Moreover, compared with the mesh spacing of ideal crystalline graphite, the (002) mesh spacing of the reduced product increased in the order of rGO-LG, rGO-VG, rGO-FG, to rGO-AG, implying that the repair degree of the reduced product structure decreased in turn, the impedance effect of the electrochemical performance was boosted successively, and the specific capacitance value subsided in turn.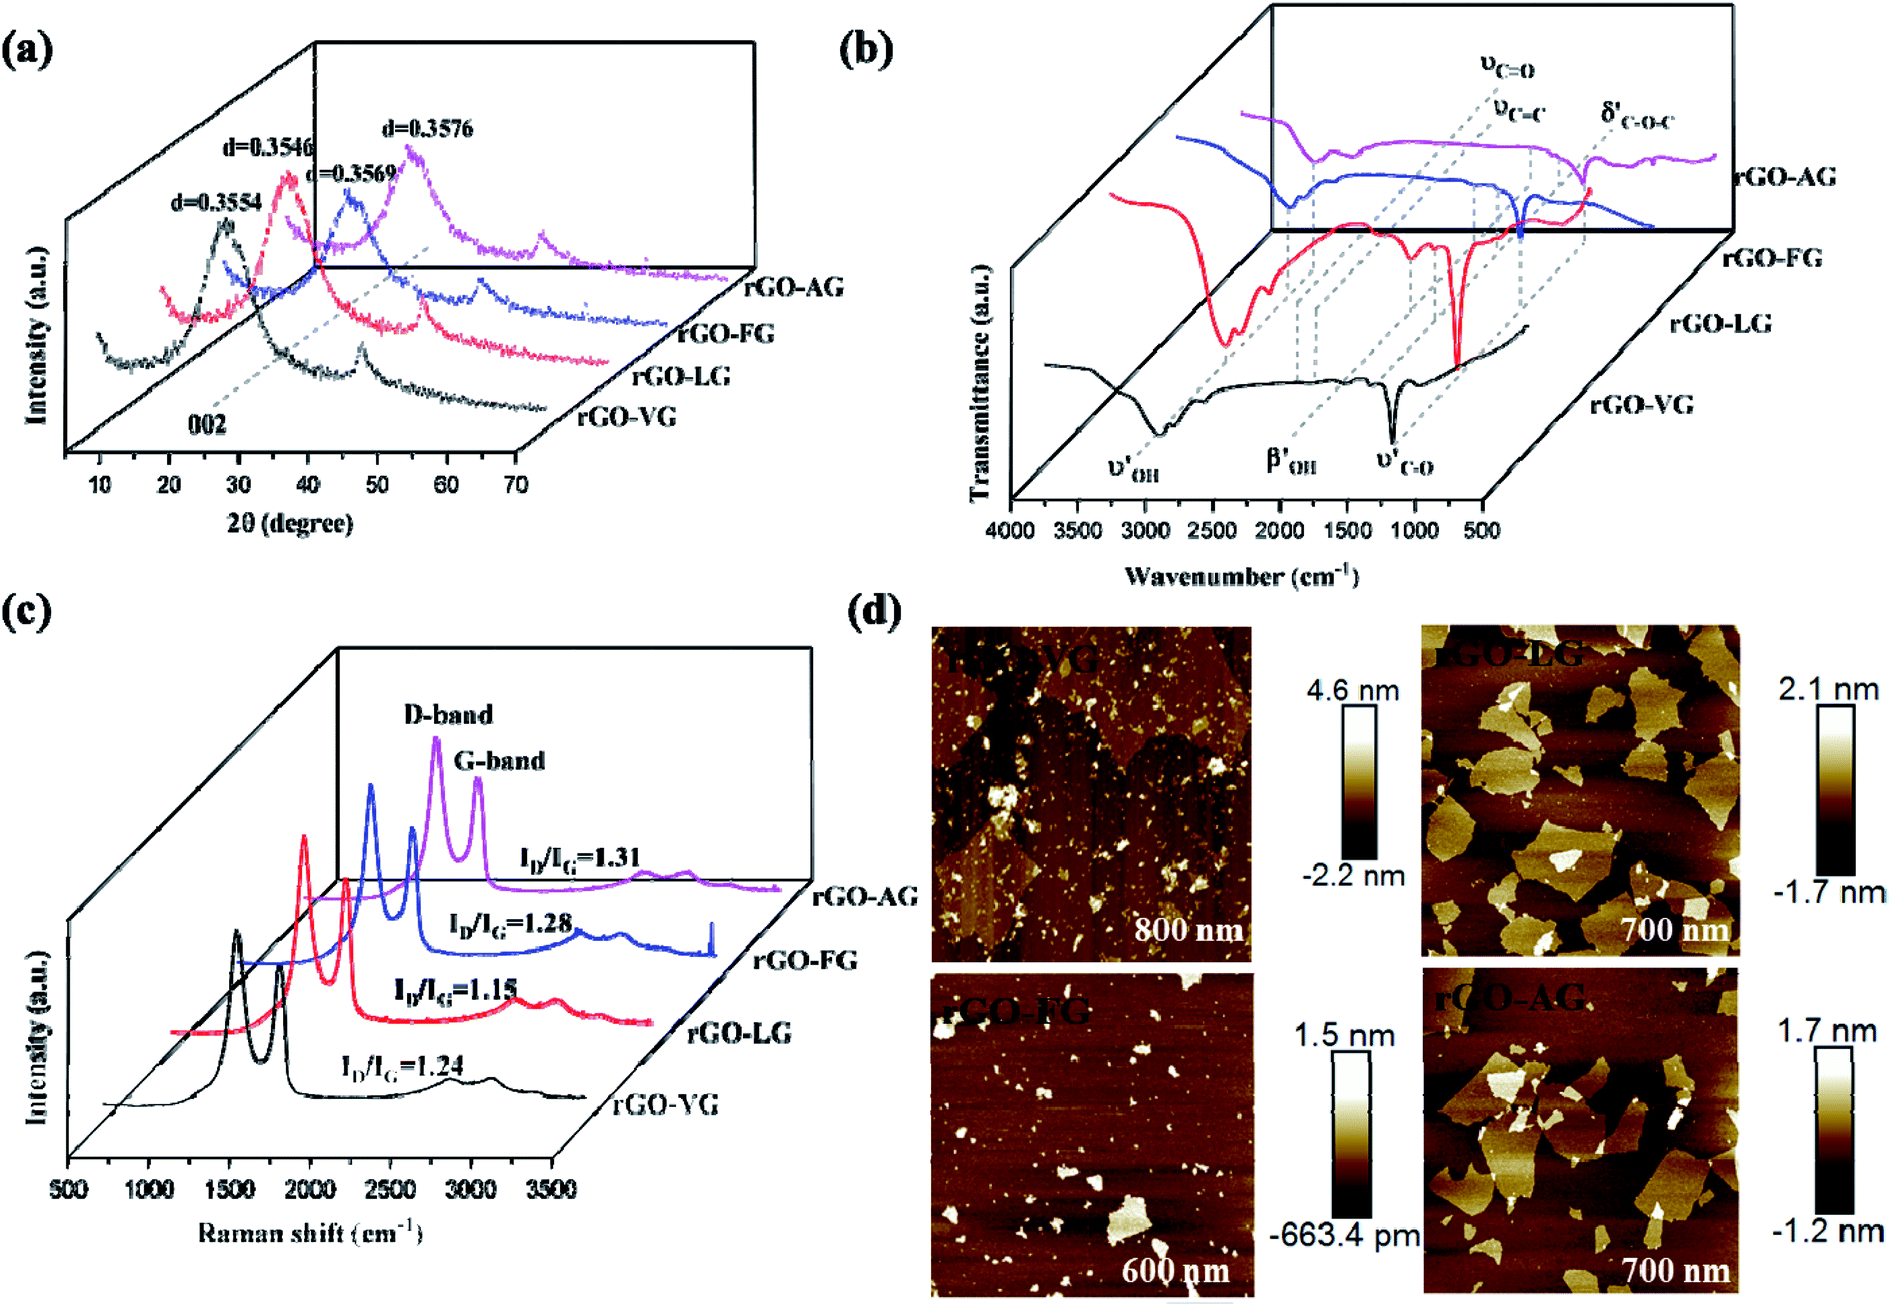 | ||
| Fig. 7 Characterization of rGOs prepared from different natural graphites. (a) XRD spectra of four kinds of rGO. (b) FT-IR spectra of four kinds of rGO. (c) Raman spectra of four kinds of rGO. (d) AFM images of the rGOs. | ||
Fig. 7b presents the FT-IR spectra of the reduced oxidized graphene products at different levels of reduction. The absorption peaks in of 3440, 1724, 1400, 1224 and 1063 cm−1 were, respectively, attributed to the –OH stretching vibration, C![[double bond, length as m-dash]](https://www.rsc.org/images/entities/char_e001.gif) O stretching vibration, –OH bending vibration, and O–C–O and C–O stretching vibrations. Compared with the FT-IR spectra of graphene oxide, the intensity of the absorption peaks near 1724, 1400 and 1224 cm−1 subsided significantly, even almost disappeared. The absorption peak intensity at 1063 cm−1 was obviously enhanced, meaning that water and the reduction process could effectively remove the hydroxyl group, carboxyl group and other oxygen-containing functional groups in the structure of graphene oxide, accompanying the vibration peak intensity of these oxygen functional groups being obviously weak. But the oxidized functional groups still remaining on the surface meant the absorption peak did not completely disappear. The intensity of the absorption peak at 1063 cm−1 increased in the order of rGO-AG, rGO-FG, rGO-VG, rGO-LG, implying that the removal of oxygen-containing functional groups of the rGO-LG reduction products was the best, and the electrochemical inert groups were reduced. The performance of double capacitance was more incomparable.
O stretching vibration, –OH bending vibration, and O–C–O and C–O stretching vibrations. Compared with the FT-IR spectra of graphene oxide, the intensity of the absorption peaks near 1724, 1400 and 1224 cm−1 subsided significantly, even almost disappeared. The absorption peak intensity at 1063 cm−1 was obviously enhanced, meaning that water and the reduction process could effectively remove the hydroxyl group, carboxyl group and other oxygen-containing functional groups in the structure of graphene oxide, accompanying the vibration peak intensity of these oxygen functional groups being obviously weak. But the oxidized functional groups still remaining on the surface meant the absorption peak did not completely disappear. The intensity of the absorption peak at 1063 cm−1 increased in the order of rGO-AG, rGO-FG, rGO-VG, rGO-LG, implying that the removal of oxygen-containing functional groups of the rGO-LG reduction products was the best, and the electrochemical inert groups were reduced. The performance of double capacitance was more incomparable.
From the Raman spectra of the reduced graphene oxide products with different reduction degrees displayed in Fig. 7c, similar to the Raman spectrum of graphene oxide, obvious peak D and peak G appeared near 1350 and 1580 cm−1, respectively. Peak G of graphene reduction products shifted slightly to the low-frequency region, indicating that the hydration reduction process repaired the structural defects of graphene oxide, which was consistent with the results of XRD analysis. The ID/IG values of rGO-VG, rGO-LG, rGO-FG and rGO-AG were calculated to be 1.24, 1.15, 1.28 and 1.31, respectively, implying that hydrazine hydrate reduction could remove some oxygen-containing functional groups on the surface. However, structural defects still existed, and defect degree gradually increased in the order of rGO-LG, rGO-VG, rGO-FG, rGO-AG. In addition, La can be used to measure the average size of the sp2 region in the plane, and the specific calculation is as follows:
| La = 44 × (ID/IG)−1 | (6) |
The calculated La values of rGO-VG, rGO-LG, rGO-FG and rGO-AG were 35.48, 38.26, 34.38 and 33.59 nm, respectively, signifying that the average size of the sp2 region in the plane was rGO-LG > rGO-VG > rGO-FG > rGO-AG.
Fig. 7d shows the AFM images of rGOs. Since there were residual epoxy groups, carboxyl groups and hydroxyl groups on both sides of the rGO sheet, the thickness of these samples was much higher than the ideal graphene thickness (0.335 nm). It can be seen from the figure that the thicknesses of rGO-VG and GO-LG were significantly larger than those of rGO-FG and rGO-AG, meaning that natural graphite with a low degree of graphitization was more suitable to synthesize few-layered rGO.
4 Conclusion
The Hummers hydration oxidation method was used to prepare graphene oxide with four different types of natural graphite as raw materials, and the amount of reducing agent was controlled to reduce the GOs to different degrees. The electrochemical properties of the GOs and rGOs with different reduction degrees were also studied. The raw samples are all typical graphite crystal structures, belonging to vein graphite, large flake graphite, fine flake graphite and cryptocrystalline graphite. The results demonstrated that graphite with a lower graphitization degree contained more 3R polytypes, lower C/O ratio, and more oxygen content on the surface, as well as more exposed activated carbon atoms. For the four types of natural graphites, the lower the graphitization degree, the weaker the degree of crystallinity, which was more conducive to the oxidation process, exposed with more oxygen-containing functional groups on the surface after oxidation, and higher defects. Based on the experiments, the interface charge resistance and diffusion resistance of different rGO-AG and rGO-FG products gradually reduced with the elevating reduction degree. However, the electrochemical impedances of rGO-VG and rGO-LG first enhanced and then declined under the same variables. Comparing four graphene products with the same reduction degree, the interface and diffusion resistance have the law of rGO-LG < rGO-VG < rGO-FG < rGO-AG. The results indicate that rGO-LG has a better repair degree, a great oxygen-containing functional group removal effect, lower structural defects and a larger average size of the sp2 region in the plane, which gives rGO-LG a more excellent electrochemical performance.Conflicts of interest
There are no conflicts to declare.Acknowledgements
The financial support for this work provided by the Fundamental Research Funds for the Central Universities (WUT: 2020IVA022) is gratefully acknowledged.References
- F. Wang, X. Wu, X. Yuan, Z. Liu, Y. Zhang, L. Fu, Y. Zhu, Q. Zhou, Y. Wu and W. Huang, Latest advances in supercapacitors: from new electrode materials to novel device designs, Chem. Soc. Rev., 2017, 46, 6816–6854, 10.1039/c7cs00205j.
- Y. Huang, J. Liang and Y. Chen, An Overview of the Applications of Graphene-Based Materials in Supercapacitors, Small, 2012, 8, 1805–1834, DOI:10.1002/smll.201102635.
- J. Sun, B. Cui, F. Chu, C. Yun, M. He, L. Li and Y. Song, Printable Nanomaterials for the Fabrication of High-Performance Supercapacitors, Nanomaterials, 2018, 8, 528, DOI:10.3390/nano8070528.
- P. Yang and W. Mai, Flexible solid-state electrochemical supercapacitors, Nano Energy, 2014, 8, 274–290, DOI:10.1016/j.nanoen.2014.05.022.
- G. Wang, L. Zhang and J. Zhang, ChemInform Abstract: A Review of Electrode Materials for Electrochemical Supercapacitors, ChemInform, 2012, 43, 797–828, DOI:10.1002/chin.201218217.
- J. Yan, Q. Wang, T. Wei and Z. Fan, Supercapacitors: Recent Advances in Design and Fabrication of Electrochemical Supercapacitors with High Energy Densities, Adv. Energy Mater., 2014, 4, 1–43, DOI:10.1002/aenm.201300816.
- Y. Wang, Y. Song and Y. Xia, ChemInform Abstract: Electrochemical Capacitors: Mechanism, Materials, Systems, Characterization and Applications, ChemInform, 2016, 47, 5925–5950, DOI:10.1002/chin.201650247.
- J. Li, X. Wang, Q. Huang, S. Gamboa and P. J. Sebastian, Studies on preparation and performances of carbon aerogel electrodes for the application of supercapacitor, J. Power Sources, 2005, 158, 784–788, DOI:10.1016/j.jpowsour.2005.09.045.
- D. Dong, Y. Zhang, Y. Xiao, T. Wang, J. Wang, C. E. Romero and W.-p. Pan, High performance aqueous supercapacitor based on nitrogen-doped coal-based activated carbon electrode materials, J. Colloid Interface Sci., 2020, 580, 77–87, DOI:10.1016/j.jcis.2020.07.018.
- C. C. Chen and J. C. Chou, All-Solid-State Conductive Polymer Miniaturized Reference Electrode, Jpn. J. Appl. Phys., 2009, 48, 111501, DOI:10.1143/JJAP.48.111501.
- Y. Zhu, S. Murali, W. Cai, X. Li, J. W. Suk, J. R. Potts and R. S. Ruoff, Graphene and Graphene Oxide: Synthesis, Properties, and Applications (vol 22, pg 3906, 2010), Adv. Mater., 2010, 22, 5226, DOI:10.1002/adma.201090156.
- M. Yi and Z. Shen, A review on mechanical exfoliation for the scalable production of graphene, J. Mater. Chem. A, 2015, 3, 11700–11715, 10.1039/c5ta00252d.
- K. S. Siow, Graphite Exfoliation to Commercialize Graphene Technology, Sains Malays., 2017, 46, 1047–1059, DOI:10.17576/jsm-2017-4607-06.
- C. Trudeau, L.-I. Dion-Bertrand, S. Mukherjee, R. Martel and S. G. Cloutier, Electrostatic Deposition of Large-Surface Graphene, Materials, 2018, 11, 116, DOI:10.3390/ma11010116.
- T.-o. Terasawa and K. Saiki, Growth of graphene on Cu by plasma enhanced chemical vapor deposition, Carbon, 2011, 50, 869–874, DOI:10.1016/j.carbon.2011.09.047.
- R. Xue, I. H. Abidi and Z. Luo, Domain size, layer number and morphology control for graphene grown by chemical vapor deposition, Funct. Mater. Lett., 2017, 10, 1–21, DOI:10.1142/S1793604717300031.
- L. Mustafa, H. Yenny, J. K. Paul, S. J. Ronan, N. Valeria, S. K. Lisa, M. B. Fiona, D. Sukanta, W. Zhiming, I. T. McGovern, S. D. Georg and N. C. Jonathan, Liquid phase production of graphene by exfoliation of graphite in surfactant/water solutions, J. Am. Chem. Soc., 2009, 131, 3611–3620, DOI:10.1021/ja807449u.
- D. Deng, X. Pan, L. Yu, Y. Cui, Y. Jiang, J. Qi, W.-X. Li, Q. Fu, X. Ma, Q. Xue, G. Sun and X. Bao, Toward N-Doped Graphene via Solvothermal Synthesis, Chem. Mater., 2011, 23, 1188–1193, DOI:10.1021/cm102666r.
- A. L. Lipson, S. Chattopadhyay, H. J. Karmel, T. T. Fister, J. D. Emery, V. P. Dravid, M. M. Thackeray, P. A. Fenter, M. J. Bedzyk and M. C. Hersam, Enhanced Lithiation of Doped 6H Silicon Carbide (0001) via High Temperature Vacuum Growth of Epitaxial Graphene, J. Phys. Chem. C, 2012, 116, 20949–20957, DOI:10.1021/jp307220y.
- D. V. Kosynkin, A. L. Higginbotham, A. Sinitskii, J. R. Lomeda, A. Dimiev, B. K. Price and J. M. Tour, Longitudinal unzipping of carbon nanotubes to form graphene nanoribbons, Nature, 2009, 458, 872–U5, DOI:10.1038/nature07872.
- S. Pei, J. Zhao, J. Du, W. Ren and H.-M. Cheng, Direct reduction of graphene oxide films into highly conductive and flexible graphene films by hydrohalic acids, Carbon, 2010, 48, 4466–4474, DOI:10.1016/j.carbon.2010.08.006.
- C. C. Kiang and P. Martin, Chemical reduction of graphene oxide: a synthetic chemistry viewpoint, Chem. Soc. Rev., 2014, 43, 291–312, 10.1039/c3cs60303b.
- V. A. Labunov, L. V. Tabulina, I. V. Komissarov, D. V. Grapov, E. L. Prudnikova, Y. P. Shaman, S. A. Basaev and A. A. Pavlov, Features of the reduction of graphene from graphene oxide, Russ. J. Phys. Chem. A, 2017, 91, 1088–1092, DOI:10.1134/s0036024417060140.
- X. Jiao, Y. Qiu, L. Zhang and X. Zhang, Comparison of the characteristic properties of reduced graphene oxides synthesized from natural graphites with different graphitization degrees, RSC Adv., 2017, 7, 52337–52344, 10.1039/c7ra10809e.
- E. Choi, J. Kim, Y. Cui, K. Choi, Y. Gao, S. Han, S. G. Pyo and S. Yoon, Effect of the graphene oxide reduction temperature on supercapacitor performance, Electron. Mater. Lett., 2017, 13, 324–329, DOI:10.1007/s13391-017-1603-4.
- W. Peng, H. Li, Y. Liu and S. Song, Comparison of Pb(II) adsorption onto graphene oxide prepared from natural graphites: Diagramming the Pb(II) adsorption sites, Appl. Surf. Sci., 2016, 364, 620–627, DOI:10.1016/j.apsusc.2015.12.208.
- S. S. Kumar and P. Jürgen, Recent Advances in Preparation, Structure, Properties and Applications of Graphite Oxide, J. Nanosci. Nanotechnol., 2015, 15, 1984–2000, DOI:10.1166/jnn.2015.10047.
- N. Iwashita, M. Inagaki and Y. Hishiyama, Relations between degree of graphitization and galvanomagnetic properties of pyrolytic carbons and cokes, Carbon, 1997, 35, 1073–1077, DOI:10.1016/S0008-6223(97)00062-6.
- H. Yang, S. H. Yoon, Y. Korai, I. Mochida and O. Katou, Improving graphitization degree of mesophase pitch-derived carbon fiber by solid-phase annealing of spun fiber, Carbon, 2003, 41, 397–403, DOI:10.1016/s0008-6223(02)00320-2.
- T. Nishida and H. Sueyoshi, Effect of graphitization on solid state bonding of carbon to nickel, Mater. Trans., 2006, 47, 399–404, DOI:10.2320/matertrans.47.399.
- J. L. Liu, J. Q. Gao, J. K. Cheng, H. F. Yang and G. J. Qiao, Effects of graphitization degree of crucible on SiC single crystal growth process, Diamond Relat. Mater., 2006, 15, 117–120, DOI:10.1016/j.diamond.2005.08.028.
- L. H. Zou, B. Y. Huang, Y. Huang, Q. H. Huang and C. A. Wang, An investigation of heterogeneity of the degree of graphitization in carbon-carbon composites, Mater. Chem. Phys., 2003, 82, 654–662, DOI:10.1016/s0254-0584(03)00332-8.
- H. Fujimoto, A new estimation method for the degree of graphitization for random layer lattices, Carbon, 2010, 48, 3446–3453, DOI:10.1016/j.carbon.2010.05.041.
- Z.-S. Wu, W. Ren, L. Gao, J. Zhao, Z. Chen, B. Liu, D. Tang, B. Yu, C. Jiang and H.-M. Cheng, Synthesis of Graphene Sheets with High Electrical Conductivity and Good Thermal Stability by Hydrogen Arc Discharge Exfoliation, ACS Nano, 2009, 3, 411–417, DOI:10.1021/nn900020u.
- O. Movil, C. Schadeck and J. A. Staser, Investigation of double-layer and pseudocapacitance of surface-modified ionic liquid-functionalized graphene oxide, J. Electroanal. Chem., 2015, 755, 127–135, DOI:10.1016/j.jelechem.2015.07.047.
- G. Shao, Y. Lu, F. Wu, C. Yang, F. Zeng and Q. Wu, Graphene oxide: the mechanisms of oxidation and exfoliation, J. Mater. Sci., 2012, 47, 4400–4409, DOI:10.1007/s10853-012-6294-5.
- L. Qiu, H. Zhang, W. Wang, Y. Chen and R. Wang, Effects of hydrazine hydrate treatment on the performance of reduced graphene oxide film as counter electrode in dye-sensitized solar cells, Appl. Surf. Sci., 2014, 319, 339–343, DOI:10.1016/j.apsusc.2014.07.133.
- Z. Lin, Y. Liu, Y. Yao, O. J. Hildreth, Z. Li, K. Moon and C.-p. Wong, Superior Capacitance of Functionalized Graphene, J. Phys. Chem. C, 2011, 115, 7120–7125, DOI:10.1021/jp2007073.
- Q. Zhuo, J. Gao, M. Peng, L. Bai, J. Deng, Y. Xia, Y. Ma, J. Zhong and X. Sun, Large-scale synthesis of graphene by the reduction of graphene oxide at room temperature using metal nanoparticles as catalyst, Carbon, 2013, 52, 559–564, DOI:10.1016/j.carbon.2012.10.014.
| This journal is © The Royal Society of Chemistry 2021 |