 Open Access Article
Manipulation of light transmission from stable magnetic microrods formed by the alignment of magnetic nanoparticles†
Yoon Ji Seo‡
,
Hyung Gyu Lee‡,
Jun Seok Yang,
Hwanyeop Jeong,
Jeonghun Han ,
Ji-Hye Kim,
Hyung-Jun Koo and
Hyunsik Yoon
 *
*
Department of Chemical and Biomolecular Engineering, Seoul National University of Science & Technology, Seoul, 01811, Korea. E-mail: hsyoon@seoultech.ac.kr
First published on 12th January 2021
Abstract
Due to the increasing energy consumption, smart technologies have been considered to automatically control energy loss. Smart windows, which can use external signals to modulate their transparency, can regulate solar energy by reflecting excess energy and retaining the required energy in a building without using additional energy to cool or heat the interiors of the building. Although many technologies have been developed for smart windows, they still need to be economically optimised. Here, we propose a facile method to synthesise magnetic microrods from magnetic nanoparticles by alignment using a magnetic field. To maximise the transparency difference in the ON and OFF states, we controlled the nanoparticle concentration in a dispersion liquid, magnetic field application time, and viscosity of the dispersant. Interestingly, the magnetic microrods remained stable when we mixed short-chain polymers (polyethylene glycol) with a liquid dispersant (isopropyl alcohol). Furthermore, the Fe2O3 microrods maintained their shape for more than a week, while the Fe3O4 microrods clustered after a day because they became permanent magnets. The anisotropic features of the magnetic rods were used as a light valve to control the transparency of the smart window.
Buildings, factories, and houses consume a considerable amount of energy resulting in energy shortages. In addition, the depletion of fossil fuels is threatening the current energy supply. Therefore, the smart window technology is considered for reducing the current energy consumption, because a “SMART” window can regulate solar energy.1,2 When it is too sunny outside, for example, the window can block the sunlight to remove the need for operating cooling systems which consume electrical energy. In addition, the smart technology can be used to artificially control the transparency of windows, which enhances the comfort in automobiles and aircrafts. Many researchers have developed optimised materials that use external signals, such as temperature, electricity, or magnetic field to control their transmittance.1–11 For example, electrochromic and thermochromic materials, such as nanocrystal and amorphous metal oxide composites, monolithic-phased vanadium dioxide (VO2), and hydrogel microparticles, have been recently studied for use in smart windows. To adjust optical transmittance, nanocrystals embedded in metal oxide exploit their electrochemical charging and discharging,3 vanadium dioxide uses a reversible metal-to-insulator transition,4 and hydrogel microparticles control their diameter to modulate the light scattering by changing the temperature.5 Mechanoresponsive smart windows, which use the light scattering effects on particle-embedded films or micropillars, are also potential candidates for these applications.6–8 In addition, the use of mechanoresponsive and electrically driven wrinkles on a surface has been proposed as a smart window to scatter the light.9,10 Functional materials such as liquid crystals (LCs) and particles have been used to manipulate transmittance. Polymer-dispersed liquid crystals (PDLCs) modulate the alignment direction of LCs by applying electrical signals.1,2,11 Suspended particle (SP)-based smart windows that utilise the alignment of microparticles to change their transmittance have also been used.1,2 In addition, magnetic materials have been used to modulate transmittance.12–14 The use of magnetically responsive elastomeric micropillar arrays has also been demonstrated for controlling the light.13 Previously, our group reported a smart window inspired by a squid skin that uses the movement of magnetic nanoparticles within a tapered structure to control its transparency.14 However, the switching time based on this movement was long for practical utilisation. Although many materials have been developed for smart windows, these materials still need to be economically optimised.
Here, we introduce a facile method for preparing stable magnetic microrods that can be utilised for smart windows by changing the direction of the magnetic field. Therefore, we applied a magnetic field to align magnetic Fe2O3 nanoparticles to form magnetic microrods. These rods have high aspect ratios; therefore, they can be used as light valves to control light transparency. Furthermore, we examined the effect of the nanoparticle concentration, magnetic field application time, and dispersant fluid viscosity on the formation of these magnetic rods. We also assessed their stability via mechanical agitation. Finally, we compared the stability of the Fe2O3 rods with that of microrods formed from Fe3O4 nanoparticles.
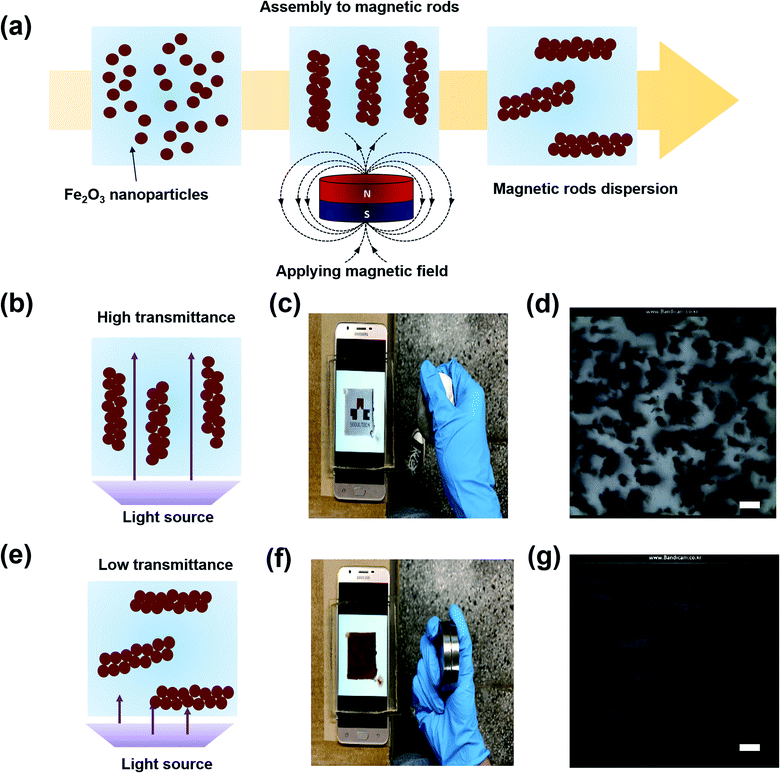
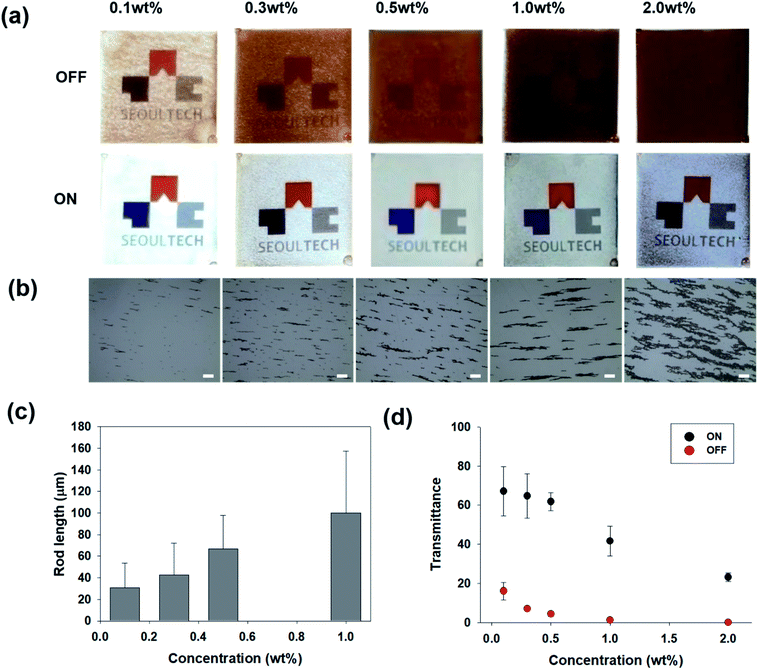
Fig. 1(a) shows a schematic illustration of the formation of the magnetic microrods by applying a magnetic field. Initially, we prepared the magnetic nanoparticles and dispersion liquid mixture; thereafter, we applied a magnetic field using a neodymium magnet for 10 to 30 minutes to obtain magnetic rods dispersed in liquid. The Fe2O3 nanoparticles used were ∼50 nm in diameter. Meanwhile, an isopropyl alcohol (IPA) and polyethylene glycol (PEG) (molecular weight = 300) mixture was used as the dispersion liquid. Once the rods were formed, the applied magnetic field was removed. The dispersion liquid was filled in a transparent cavity (4 cm × 4 cm × 3 mm); thereafter, the direction of the magnetic rods was switched by controlling the magnetic field. A detailed procedure of the transparent cavity preparation is described in the experimental section and ESI (Fig. S1†). The smart window filled with magnetic rods was placed on a display device (Samsung Galaxy J7), and then, the device screen was examined through the window. When the magnetic rods were vertically oriented (Fig. 1(b)), the university logo shown on the screen could be seen through the transparent cavity filled with magnetic rods (Fig. 1(c)). As shown in the microscopic image in Fig. 1(d), the transparent region could be seen. The black region is the top view of the vertically oriented magnetic rods. When we switched the orientation of the magnetic rods (Fig. 1(e)), the display device screen could not be seen (Fig. 1(f)) because the magnetic rods were parallel to the substrate, making the whole region dark (Fig. 1(g)). Since the transmittance change originated from the rotation of the magnetic rods, a faster response to the magnetic field was achieved here than in our previous study. In the previous study, we used the movement of nanoparticles within a confined microstructure filled with a dispersant to induce the transmittance change.14 The real time switch of the transmittance is found in the ESI (Movie S1†). To adjust the anisotropy features of the magnetic rods, we controlled the magnetic nanoparticle concentration, magnetic field application time, and dispersion liquid viscosity. Fig. 2(a) shows the display device screen through the smart window (thickness = 3 mm) filled with microrods formed by applying the magnetic field for 30 min at different magnetic nanoparticle concentrations. To control the concentration of nanoparticles, the mixing ratio of PEG and IPA was fixed at 4![[thin space (1/6-em)]](https://www.rsc.org/images/entities/char_2009.gif) :
:![[thin space (1/6-em)]](https://www.rsc.org/images/entities/char_2009.gif) 6. At a concentration of 0.1 wt%, the screen was visible through the smart window in the OFF state; however, it darkened as the concentration increased. In contrast, at a concentration of 2 wt%, the screen in the ON state was dark. To measure the length of the magnetic rods, we placed one drop of a liquid on a glass slide and measured its length with a microscope (Fig. 2(b)). When the concentration increased, the length of the rod increased until the concentration reached 1 wt%. The rods clustered at a concentration of 2 wt%. Fig. 2(c) shows that the rod length is proportional to the concentration. The length of the rod at a concentration of 2 wt% was excluded because it could not be measured due to clustering. Fig. 2(d) shows the transmittance measured by a window tint metre (AT-173, Guangzhou Amittari Instruments Co., Ltd.) at different nanoparticle concentrations. The transmittance in the ON and OFF states decreased with increasing nanoparticle concentration. At a concentration of 0.5 wt%, the transmittances were 4.5% and 62% in the OFF and ON states, respectively.
6. At a concentration of 0.1 wt%, the screen was visible through the smart window in the OFF state; however, it darkened as the concentration increased. In contrast, at a concentration of 2 wt%, the screen in the ON state was dark. To measure the length of the magnetic rods, we placed one drop of a liquid on a glass slide and measured its length with a microscope (Fig. 2(b)). When the concentration increased, the length of the rod increased until the concentration reached 1 wt%. The rods clustered at a concentration of 2 wt%. Fig. 2(c) shows that the rod length is proportional to the concentration. The length of the rod at a concentration of 2 wt% was excluded because it could not be measured due to clustering. Fig. 2(d) shows the transmittance measured by a window tint metre (AT-173, Guangzhou Amittari Instruments Co., Ltd.) at different nanoparticle concentrations. The transmittance in the ON and OFF states decreased with increasing nanoparticle concentration. At a concentration of 0.5 wt%, the transmittances were 4.5% and 62% in the OFF and ON states, respectively.
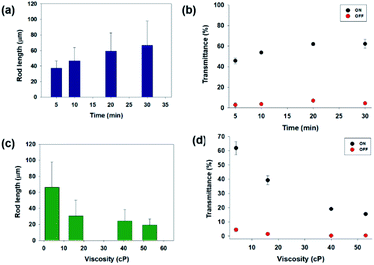
Fig. 3(a) depicts a graph of the length of the magnetic rods with respect to the magnetic field application time (the fixed concentration of magnetic particles = 0.5%, and the viscosity of dispersion liquids = 4.4 cPs). The rod length was proportional to the application time and saturated after approximately 30 min. The transmittance had a similar trend as that shown by the rod length, as shown in Fig. 3(b). To control the dispersion liquid viscosity, in this study, a mixture of low viscosity IPA and high viscosity PEG was used. We measured the liquid mixture viscosities at different ratios (see the ESI Fig. S2†) using a rheometer (Rheometer R/S plus, Brookfield). The measured viscosities of IPA and PEG were 0.78 and 91 cPs, respectively. When we increased the fraction of the relatively viscous PEG, the viscosity increased. Fig. 3(c) shows the rod length under different liquid viscosity conditions (the concentration was fixed at 0.5 wt% and time at 30 min). When the viscosity was higher, the rod length decreased. As shown in Fig. 3(d), the transmittance had the same trend as that shown by the lengths of the magnetic rods. We note the experimental data in Fig. 1, 4, 5, and 6 were obtained in the optimized condition for forming microrods (concentration = 0.5 wt%, magnetic field applying time = 30 min, and the viscosity of dispersion liquids = 4.4 cPs).
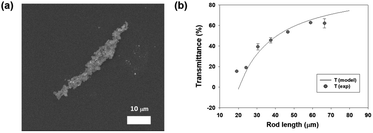 | ||
| Fig. 4 (a) SEM image of the magnetic rods. (b) Graph showing the relation between the length of the magnetic rods and transmittance at a fixed concentration. | ||
Fig. 4(a) shows a scanning electron microscope (SEM) image of the magnetic rods. The rod length and width were 50 and 6 μm, respectively, which implies that the aligned magnetic nanoparticles were parallel to each other to be grown in both directions to the magnetic field. The anisotropy of the microfeatures showed a transmittance change as the orientation changed, as shown in Fig. 2 and 3. When the number of nanoparticles is N, the number of rods is inversely proportional to the rod length l. When the magnetic rods are vertically oriented, the transmittance (T) can be derived using eqn (1) below.
| T ∼1 − αN/l | (1) |
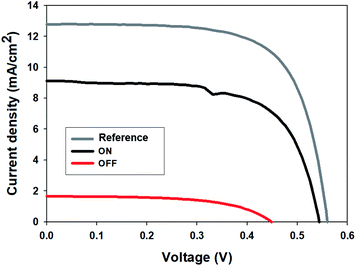
To emphasize the possibility of regulation of solar energy which has a broad wavelength spectrum, we measured J–V curves with a photovoltaic cell in ON and OFF states of the smart window. We used a calibrated reference photovoltaic cell (91150-KG5) and placed the smart window on it. First, we measured the efficiency of the solar cell as a reference (4.92%), which used a window without nanoparticles. And then, we measured the efficiency of a solar cell covered by the smart window in the ON state (3.24%) and OFF state (0.43%), respectively (Fig. 5). The ON/OFF ratio of the efficiency of the solar cells was about 7.5 which could modulate the solar energy with a wide spectrum. It is also noted that we assumed that the regulation of thermal radiation is dominant in our smart windows because the concentration of magnetic nanoparticles is less than 2 wt%, which can be a small effect on conduction and convection of heat transfer between the windows.
The formation of the linear magnetic chains or rods has been studied for decades by applying a magnetic field on the nanoparticles.15–21 The aligned magnetic microfeatures can be incorporated into polymers to enhance their mechanical properties or promote their suitability for special uses or serve as nanometre-sized stir bars for mixing. The lengths of the magnetic chains were controlled by the magnetic field, nanoparticle concentration, and magnetic field application time. Other groups have shown that the chain length is proportional to the field strength, concentration, and magnetic field application time, which agrees with our experimental results.15,16,21 Another important aspect in the formation of the magnetic chains is their stability. When formed in a polymer, the chains are cannot be moved after the polymer is cured.17,18 However, when the magnetic chains are formed in a liquid, the chains can be disassembled after the magnetic field is removed. Another challenge is clustering when the microchains become permanent magnets. To maintain the aligned features of the magnetic chains, polymeric surfactants bonded to a colloid19 or silica encapsulating the chain are used after forming the magnetic chains.20 The Velev group demonstrated flexible microfilaments by assembling lipid-coated iron oxide particles.21 These researchers explained that the filaments were formed by a combination of the dipole–dipole interparticle attraction and magnetophoretic attractions of the particles. In addition, these filaments were stable due to nanocapillary lipid binding. Their work can provide explanation to our experimental observations.
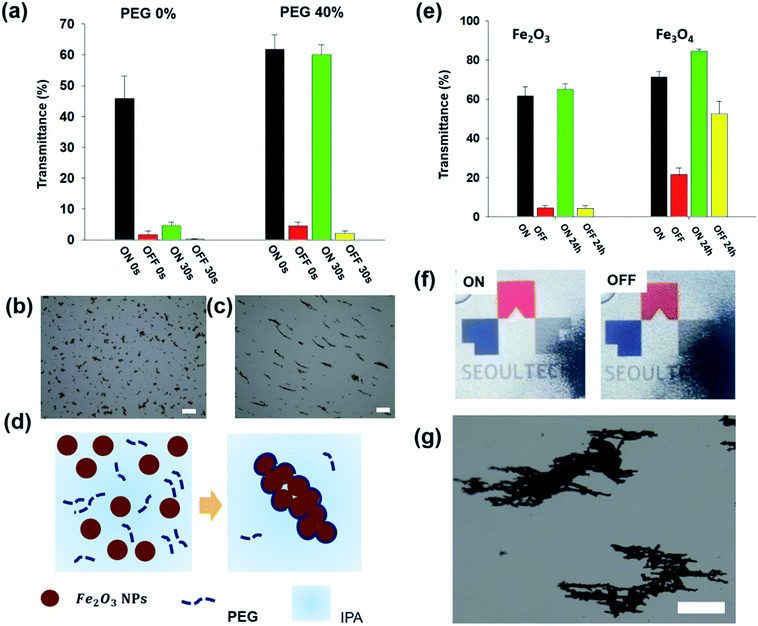
In this study, we used viscous PEG (40 wt%) as one of the dispersion liquids in the mixture, which can hinder interparticle attraction for obtaining longer microrods. Therefore, the rod length was shorter when the PEG fraction was higher (Fig. 3(c–d)). PEG could have adhered to the surfaces of the nanoparticles and coated the entire surface of the microrods, making the magnetic rods stable even after the magnetic field was removed. To prove this, the magnetic rods formed in IPA only and those formed from the mixture were compared. After the formation of the magnetic rods, the transmittance values in the ON/OFF states of the two samples were measured. Thereafter, a vortex mixer (Genie2, Neolab) was used to mechanically vibrate (1380 rpm for 30 s) the magnetic rods. Fig. 6(a) shows the transmittance in the ON and OFF states before and after agitation. For the magnetic rods formed in IPA, the transmittances in the ON and OFF states were 45.8% and 4.7%, respectively. However, when we agitated them mechanically, the transmittance in the ON state reduced to 1.6%. On the other hand, for the magnetic rods formed in the liquid mixture (40% PEG), the transmittance did not change in the ON state even after mechanical agitation. Fig. 6(b and c) shows the microscopic images of the magnetic rods after 30 s of agitation. When we used IPA only, the magnetic rods disassembled after agitation (Fig. 6(b)) However, the rods maintained their shape when a mixture of PEG and IPA was used (Fig. 6(c)). Fig. 6(d) shows a schematic illustration of the formation of the stable magnetic rods. PEG plays a role as a stabiliser by coating the magnetic rods after they have been formed, thereby stabilizing them.
For the ageing test, we prepared smart windows with magnetic rods formed from the Fe2O3 and Fe3O4 nanoparticles. After applying the magnetic field, the magnetic rods were formed in both cases. When the Fe2O3 nanoparticles were used, the transmittances in the ON/OFF states did not change after the sample was allowed to remain for 24 h (Fig. 6(e)). When Fe3O4 nanoparticles were used, however, the transmittances in the OFF states changed significantly (from 21.6% to 52.5%) after 24 h. Fig. 6(f) shows the display screen through the smart window filled with Fe3O4 microrods after 24 h in the ON and OFF states. The microrods were clustered and moved to the boundary. When we examined these magnetic rods in the dark region, as shown in Fig. 6(e), using a microscope, we found that the magnetic rods had clustered (Fig. 6(g)). Meanwhile, the magnetic rods formed from the Fe2O3 nanoparticles were stable even after one week. Liu et al. reported the magnetization (M) - magnetizing field (H) curves of Fe2O3 and Fe3O4 nanoparticles and they demonstrated that Fe2O3 showed superparamagnetism whereas Fe3O4 exhibited ferromagnetic behaviour.22 It can explain Fe2O3 microrods can be rotated by the magnetic field without clustering and Fe3O4 microrods are clustered because they became permanent magnets.
Conclusions
A facile method for preparing anisotropic magnetic microrods dispersed in a liquid mixture was proposed. The rod length was controlled by the nanoparticle concentration, magnetic field application time, and dispersion liquid viscosity. Due to the stabilizing effect of the high molecular weight liquid, the magnetic rods became stable even after mechanical agitation. Furthermore, we demonstrated that the Fe2O3 magnetic microrods remained stable even after a period of one week. This simple preparation method of the anisotropic microfeatures can be key in addressing the economical limitations of smart window technologies.Experimental
Materials
We purchased iron oxide (III) (Fe2O3) nanoparticles with an average particle size of 50 nm or less from Sigma-Aldrich and used them without further treatment. Isopropyl alcohol (IPA) and polyethylene glycol (PEG) were purchased from Sigma-Aldrich and used as dispersion liquids.Formation of the magnetic microrods
After preparing the magnetic nanoparticles and dispersion liquid mixture, we applied a magnetic field using a neodymium magnet (N42, surface magnetic field = 3605 Gauss). We controlled the nanoparticle concentrations, magnetic field application time, and dispersion liquid viscosity to modulate the magnetic rod length.Fabrication of smart windows
We prepared a polydimethylsiloxane (PDMS) cavity (4 cm × 4 cm × 3 mm) to fill the magnetic rods dispersed in the liquid. After fabricating the master using a 3D printer (LITHO, Illuminade Co., Ltd.), we poured a mixture of PDMS prepolymer and curing agent at a 10![[thin space (1/6-em)]](https://www.rsc.org/images/entities/char_2009.gif) :
:![[thin space (1/6-em)]](https://www.rsc.org/images/entities/char_2009.gif) 1 ratio and cured it in an oven at 60 °C for 3 h to make the cavity. Thereafter, the PDMS cavity was detached from the master. The thickness of the dispersed liquid volume was defined by the height of the master. Punch holes on both ends of the prepared PDMS mould were used as inlets for the magnetic rods dispersed in the solution.
1 ratio and cured it in an oven at 60 °C for 3 h to make the cavity. Thereafter, the PDMS cavity was detached from the master. The thickness of the dispersed liquid volume was defined by the height of the master. Punch holes on both ends of the prepared PDMS mould were used as inlets for the magnetic rods dispersed in the solution.
Photovoltaic measurements
We obtained J–V curves of a calibrated reference photovoltaic cells (91150-KG5) by using Keithly 2400 source measure unit after placing our smart windows on the device. Photovoltaic measurements were carried out using a solar simulator equipped with a 480W Xenon lamp (Newport Oriel, USA). The active area was 4 cm2.Characterization
We used a microscope (OLYMPUS, BX51M) to examine the formation of the magnetic rods and a window tint metre (AT-173, Guangzhou Amittari Instruments Co., Ltd.) to measure the transmittance in the visible light wavelength (380–760 nm) through the smart window.Conflicts of interest
There are no conflicts to declare.Acknowledgements
This work has been supported by the Seoul National University of Science & Technology.References
- R. Baetens, B. P. Jelle and A. Gustavsen, Sol. Energy Mater. Sol. Cells, 2010, 94, 87 CrossRef CAS.
- F. Ren, S. Huang, F. Yang, A. Yurtsever and D. Ma, J. Mater. Chem. A, 2018, 6, 24157 RSC.
- A. Llordes, G. Garcia, J. Gazquez and D. J. Milliron, Nature, 2013, 500, 323 CrossRef CAS.
- T. Chang, X. Cao, Y. Long, H. Luo and P. Jin, J. Mater. Chem. A, 2019, 7, 24164 RSC.
- Y. Zhou, X. Dong, Y. Mi, F. Fan, Q. Xu, H. Zhao, S. Wang and Y. Long, J. Mater. Chem. A, 2020, 8, 10007 RSC.
- H. –N. Kim, D. Ge, E. Lee and S. Yang, Adv. Mater., 2018, 30, 1803847 CrossRef.
- D. Ge, E. Lee, L. Yang, Y. Cho, M. Li, D. S. Gianola and S. Yang, Adv. Mater., 2015, 27, 2489–2495 CrossRef CAS.
- S. G. Lee, D. Y. Lee, H. S. Lim, D. H. Lee, S. Lee and K. Cho, Adv. Mater., 2010, 22, 5013–5017 CrossRef CAS.
- M. Shrestha, A. Asundi and G. –K. Lau, ACS Photonics, 2019, 5, 3255–3262 CrossRef.
- P. Kim, Y. H. Hu, J. Alvarenga, M. Kolle, Z. G. Suo and J. Aizenberg, Adv. Opt. Mater., 2017, 5, 7 Search PubMed.
- H.-K. Kwon, K.-T. Lee, K. Hur, S. H. Moon, M. M. Quasim, T. D. Wilkinson, J.-Y. Han, H. Ko, I.-K. Han, B. Park, B. K. Min, B.-K. Ju, S. M. Morris, R. H. Friend and D.-H. Ko, Adv. Energy Mater., 2014, 5, 1401347 CrossRef.
- B. P. V. Heiz, Z. Pan, L. Su, S. T. Le and L. Wondraczek, Adv. Sustainable Syst., 2018, 2, 1700140 CrossRef.
- Z. Yang, J. K. Park and S. Kim, Small, 2018, 14, 1702839 CrossRef.
- J. Yang, H. Lee, S. G. Heo, S. Kang, H. Lee, C. H. Lee and H. Yoon, Adv. Mater. Technol., 2019, 4, 1900140 CrossRef CAS.
- N. A. Yusuf, J. Phys. D: Appl. Phys., 1989, 22, 1916–1919 CrossRef CAS.
- D. Lorenzo, D. Fragouli, G. Bertoni, C. Innocenti, G. C. Anyfantis, P. D. Cozzoli, R. Cingolani and A. Athanassiou, J. Appl. Phys., 2012, 112, 083927 CrossRef.
- P. S. Owuor, V. Chaudhary, C. F. Woellner, V. Sharma, R. V. Ramanujan, A. S. Stender, M. Soto, S. Ozden, E. V. Barrera, R. Vajtai, D. S. Galvao, J. Lou, C. S. Tiwary and P. M. Ajayan, Mater. Today, 2018, 21, 475–482 CrossRef CAS.
- K. E. Roskov, J. E. Atkinson, L. M. Bronstein and R. J. Spontak, RSC Adv., 2012, 2, 4603–4607 RSC.
- B. D. Korth, P. Keng, I. Shim, S. E. Bowles, C. Tang, T. Kowalewski, K. W. Nebesny and J. Pyun, J. Am. Chem. Soc., 2006, 128, 6562–6563 CrossRef CAS.
- W. H. Chong, L. K. Chin, R. L. S. Tan, H. Wang, A. Q. Liu and H. Chen, Angew. Chem., Int. Ed., 2013, 52, 8570–8573 CrossRef CAS.
- B. Bharti, A.-L. Fameau and O. D. Velev, Faraday Discuss., 2015, 181, 437 RSC.
- W. Liu, B. Cheng, T. Miao, J. Xie, L. Liu, J. Si, G. Zhou, H. Qin and J. Hu, J. Magn. Magn. Mater., 2019, 491, 165500 CrossRef CAS.
Footnotes |
| † Electronic supplementary information (ESI) available. See DOI: 10.1039/d0ra09511g |
| ‡ These authors contributed equally to this work. |
| This journal is © The Royal Society of Chemistry 2021 |

