
 Open Access Article
 This Open Access Article is licensed under a Creative Commons Attribution-Non Commercial 3.0 Unported Licence
Improving heavy oil recovery, part (I): synthesis and surface activity evaluation of some novel organometallic surfactants based on salen–M complexes†
M. M. Abdelhamid *ac,
S. A. Rizkb,
M. A. Betihaac,
S. M. Desoukya and
A. M. Alsabaghac
*ac,
S. A. Rizkb,
M. A. Betihaac,
S. M. Desoukya and
A. M. Alsabaghac
aEgyptian Petroleum Research Institute (EPRI), Nasr City, Cairo 11727, Egypt. E-mail: mahmmoud.mmohamed@gmail.com
bChemistry Department, Faculty of Science, Ain Shams University, 11566, Cairo, Egypt
cEnhanced Oil Recovery Unit (EOR Unit), Nasr City, Cairo 11727, Egypt
First published on 6th January 2021
Abstract
This study focuses on preparing a new family of organometallic surfactants based on five ion complexes, namely Co2+, Ni2+, Cu2+, Fe3+, and Mn2+. The first step is the preparation of 5-chloromethyl salicylaldehyde (Salen, S). The second step is the formation of sodium alkoxide of Pluronic F-127 (AP). The third step is the formation of the modified AP–Salen (new ligand). This ligand was reacted with the metal chlorides as mentioned earlier to obtain the organometallic surfactants (OMS) named AP–Salen–M complexes. FT-IR, 1H-NMR, SEM, and EDX justified the chemical structure of the as-prepared materials. The surface tension of these surfactants was measured for surfactant solutions at different concentrations to determine the CMC and calculate their surface–active properties. The interfacial tension at CMC was measured against heavy crude oil to predict the availability and use these surfactants in the enhanced oil recovery (EOR) process. From the results, this class of surfactants exhibited good surface–active properties and high efficiency on the interface adsorption; besides, they reduced the interfacial tension in the order between 10−1 and 10−2 mN m−1, which gives a good indication to use these surfactants in EOR application for the heavy crude oil.
1. Introduction
The heavy crude oil is mainly composed of high molecular weight paraffin, asphaltenes, and resins and a low concentration of aromatic and naphthene components.1,2 This oil has an API of less than twenty and a high viscosity and density. Indeed, these properties cause low flowability in porous media and pipeline transportation.2,3 Thus, the heavy crude oil production process faces numerous challenges, including the cost of production and the nature of the facilities used.2 In general, several methodologies have been developed to enhance the percentage of heavy crude oil production from oil wells after reducing the reservoir's energy.2 Crude oil production passes through three different stages: primary, secondary, and tertiary (enhanced) oil recovery. The primary stage is the extraction of oil under natural driving forces existing in the reservoir. Secondary recovery refers to the increase in the cumulative oil produced using water and immiscible gas flooding.11–13 Tertiary recovery or EOR is used for recovering additional oil (residual oil) remaining in reservoirs after applying primary and secondary oil extractions.14,15In the past decades, several theoretical and laboratory studies have been conducted to validate the EOR techniques such as thermal, chemical, microbial, and miscible flooding methods. The most widely and promising applied process is chemical EOR (C-EOR), which was developed since the 1950s.4 Among them, chemically enhanced oil recovery is the most promising and also the particle method due to the broadness of the type of chemicals used that accomplish the purpose.2 The C-EOR includes using alkalis, surfactants, polymers, or a mix of the previous example, such as surfactant/polymers, alkaline/surfactant/polymer (ASP), and nano-fluids.5 The prominent role of a surfactant in C–EOR is the change of rock wettability by reducing the interfacial tension and improvement of water/oil mobility ratio due to the reduction of flow properties of heavy oil.6
The surfactant approach in EOR via the reduction of the interfacial tension between oil and water is very important. This approach leads to a remarkable displacement efficiency of crude oil as the IFT decreases.7 Agista et al. reported that the metal nanoparticles could promote the action of the surfactant to achieve more reduction in IFT.2,8
In this study, materials that include the surfactant metal complex moieties are prepared as a new surfactant (OMS) in different steps. In the first step, 5-chloromethyl salicylaldehyde was prepared by the reaction of salicylaldehyde and formaldehyde (Salen, S). In the second step, the formation of sodium alkoxide was carried out by the reaction of Pluronic F-127 with sodium metal (AP). In the third step, a new ligand was prepared by the reaction of the alkoxide with the Salen compound to form a modified AP–Salen (ligand) with other chlorides, including Co2+, Ni2+, Cu2+, Fe3+, and Mn2+, to achieve the new chemical-based structure of AP–Salen–M OMS complexes. These compounds will be characterized via FT-IR, 1H-NMR, SEM, and TEM. The surface–active properties and interfacial tension against heavy crude oil might be investigated to predict the spectrum opportunity to use them in the EOR application.
2. Experimental
2.1. Materials
All used chemicals including salicylaldehyde (2-hydroxybenzaldehyde) (98%), formaldehyde solution (37%), Pluronic-F-127 (polyethylene–polypropylene–polyethylene) block co-polymer powder, 4-aminobenzenesulfonic acid (≥99.0%), zinc oxide (≥99.0%), cobalt(II) chloride (97%), nickel(II) chloride (98%), copper(II) chloride (99%), iron(III) chloride (97%), manganese(II) chloride (≥99%), sodium metal, potassium chloride (99%), sodium sulphite (≥98.0%), diethyl ether (≥97.0%), benzene ACS reagent (>99%), ethanol pure (≥99.0%), isopropanol (≥99.0%), hydrochloric acid reagent (37%) were purchased from Sigma Aldrich Co.2.2. Preparation of 5-chloromethyl salicylaldehyde (Salen)
Hydrochloric acid (37%, 150 mL (4.74 mol)), salicylaldehyde (0.141 mol, 17.22 g), and formaldehyde (37%, 10.8 mL (0.57 mol)) in the presence of (0.01%) zinc chloride powder as a catalyst were prepared. All materials were stirred well in a 250 mL three-necked flask for 24 h. This flask was attached to two necked flasks filled with sodium chloride, equipped with a glass dropping funnel charged with sulfuric acid to generate fresh HCl gas through a silicon rubber line. The product was washed by diethyl ether and distilled water ratio 1![[thin space (1/6-em)]](https://www.rsc.org/images/entities/char_2009.gif) :1 (v/v), followed by washing with pure ethanol and dried (yield = 89%, 13.8 g). The product physical appearance is white powder.9
:1 (v/v), followed by washing with pure ethanol and dried (yield = 89%, 13.8 g). The product physical appearance is white powder.9
2.3. Preparation of alkoxide (AP)
A 100 mL round flask charged with (0.003 mol, 18.6 g) of Pluronic F127 (polyethylene oxide (100)–polypropylene oxide (67)–polyethylene oxide (100)) block copolymer was dissolved in 30 mL toluene and 30 mL toluene in the presence of sodium metal (0.006 mol, 0.14 g) under continuous stirring until the complete disappearance of the sodium metal,16 and the product participated in the shape of white powder. The solvent was discarded, and then dried using a vacuum oven at 70 °C (yield = 74%, 12.84 g).2.4. Preparation of potassium 4-aminobenzenesulfonate
4-Aminobenzenesulfonic acid (0.017 mol, 2.9 g) was dissolved in an adequate amount of water and (0.017 mol, 0.95 g) potassium hydroxide 80 °C with stirring for 4 h. The water evaporated, and the remaining potassium 4-aminobenzenesulfonate with a molecular weight of 211.28 was collected as a fine pale-yellow powder (yield = 91%, 3.60 g).172.5. Preparation of modified AP–Salen sodium 2-(1-(2-(3-formyl-4-hydroxyphenoxy)ethoxy)propan-2-yloxy)ethanoate
In a 100 mL round flask (0.002 mol, 12.3 g), alkoxide was reacted with (0.002 mol, 0.34 g) of 5-chloromethylsalisaldehyde (Salen) in the presence of ethanol as a solvent to form sodium-2-(1-(2-(3-formyl-4-hydroxyphenoxy)ethoxy)propan-2-yloxy)ethanolate (modified AP–Salen). The product was white powder (yield = 89%, 11.5 g).2.6. Preparation of Schiff base (SB)
In a 100 mL round flask attached with a condenser (0.001 mol, 6.3 g), the modified AP–Salen reacted with (0.001 mol, 0.21 g) potassium 4-amino benzenesulfonate dissolved in ethanol to form a Schiff base at 60 °C for 2 h with continuous stirring; the waxy pale yellow product was obtained (yield = 82%, 5.2 g).2.7. Preparation of organo-metallic surfactant, OMS
In a 250 mL three-neck flask, with a condenser, nitrogen source, and thermometer (0.0008 moles, 5 g), SB was reacted with the corresponding molar ratio of NiCl2, CoCl2, CuCl2, FeCl3, and MnCl2 individually. The reaction proceeded in ethanol as a solvent at 60 °C for 8 h to form the organometallic surfactant OMS. The purification was carried out by removing the ethanol carefully at 45–55 °C using a rotary evaporator. Then, the materials were dissolved in isopropyl alcohol individually, and then the salting-out by the supersaturated NaCl solution was carried out. The two layers were separated, and then isopropanol was distilled off at 60 °C. The color of the products was waxy greenish-yellow, green apple, brown, black, and dark brown, respectively (yield was 83% ± 2).2.8. Measures of surface tension, ST
The surface tension of the OMS solutions at the interface was measured at different temperatures using a Biolin Scientific, Theta Attention tensiometer embedded with a HP/HT chamber in the formation of water18 (TDS 19917.1 mg L−1. Salinity 18090.6 mg L−1, alkalinity 800.3 mg L−1, density 1.0202 g mL−1 and pH at 25 °C, 8.24). The measured value of surface tension of this formation water as blank was 68 mN m−1 at 303 K. The data was employed to calculate the various surface–active and thermodynamic parameters to predict the behavior of the new type of surfactants (OMS) molecules at the interface (air/liquid) and the bulk of formation water.
2.9. Measures of interfacial tension, IFT
The IFT measurements were investigated using a Theta Attention Tensiometer between heavy asphaltenic crude oil and the OMS solutions at different temperatures at the CMC concentration.19,20 The crude oil specifications were (API gravity at 60 °F,°F 18. Asphaltene content 12.78 wt%, wax 1.91 wt% and density 0.9887 g L−1). The data of the tensiometer technique. The crude oil drop was injected into a capillary tube containing the surfactant solution.21 The measured blank value of IFT of crude oil against formation water was 26 mN m−1 at 50 °C. The values of IFT at the CMC and alcohol effect on their efficiency should be used in the excluded study of the chemical flooding of heavy crude oil.2.10. Measures of conductivity
Conductivity for OMS was measured using an auto-temperature electrical conductivity meter JENWAY-Japan 4510. The solutions were thermostated at different temperatures in a thermostated glass vessel controlled by a temperature controller. CMC values for an adequate quantity of surfactant were dissolved in water to change the surfactant concentration.22 The degree of counterion binding (β) is calculated from the slope of conductivity data after and before the CMC values give (α); the degree of concentration dissociation, and (1 − α) gives β values.23
3. Results and discussion
3.1. Structure confirmation of Salen–M(II) complexes
The new family of surfactants in the term of organometallic surfactants was prepared through different steps. The first step is the preparation of 5-chloromethyl salicylaldehyde (Salen, S). The second step is the formation of sodium alkoxide of Pluronic F-127 (AP). The third step is the formation of the modified AP–Salen (new ligand). This ligand was reacted with the metal chlorides, as mentioned earlier, to obtain the organometallic surfactants (OMS) named AP–Salen–M complexes. The reaction steps are shown in Schemes 1–3. The chemical structure was justified by 1H-NMR, FT-IR, SEM, and TEM of modified AP–Salen sodium 2-(1-(2-(3-formyl-4-hydroxyphenoxy)ethoxy)propan-2-yloxy)ethanolate. | ||
| Scheme 1 Preparation of sodium 2-(1-(2-(3-formyl-4-hydroxybenzyloxy)ethoxy)propan-2-yloxy)ethanolate. | ||
 | ||
| Scheme 2 Preparation of potassium sodium (E)-4-(2-hydroxy-5-((2-(2-(2-oxidoethoxy)propoxy)ethoxy)methyl)benzeylideneamino)benzenesulfonate. | ||
 | ||
| Scheme 3 Preparation of the Bi-AP–Salen sodium 2-(1-(2-(3-formyl-1,4-hydroxyphenoxy)ethoxy)propan-2-yloxy)ethanolate Ni(II) complex (OMS). | ||
3.2. Nuclear magnetic resonance 1H-NMR
1H-NMR confirmed the molecular structure of the target product.S.1 shows the 1H-NMR for 5-chloromethyl salicylaldehyde (CMS) in (DEMSO, TMS): δ ppm, 10.21 (a, 1H, –C![[H with combining low line]](https://www.rsc.org/images/entities/char_0048_0332.gif) O); 14.9 (b, 1H, –O); 7.6 (c, 3H,
O); 14.9 (b, 1H, –O); 7.6 (c, 3H,  CH2–CH2); 4.68 (d, 2H, C2–Cl).
S.2 the 1H-NMR for sodium alkoxide in (DEMSO, TMS), δ ppm: 3.52 (a, 4H, –O–C2–C2–O–); 3.68 (b, 4H, –O–C2–C2–O–); 1.2 (c, 3H, C3).
Fig. 1 the 1H-NMR for modified AP–Salen in (DEMSO, TMS), δ ppm: 1.19 (a, 3H, C3); 3.37 (b, 4H, –O–C2–C2–O–); 4.3 (c, 2H, C2–O–); 5.28 (d, 1H, –OH); 10.28 (e, 1H, CO–); 7.58 (g, 3H,  CH2–CH2).
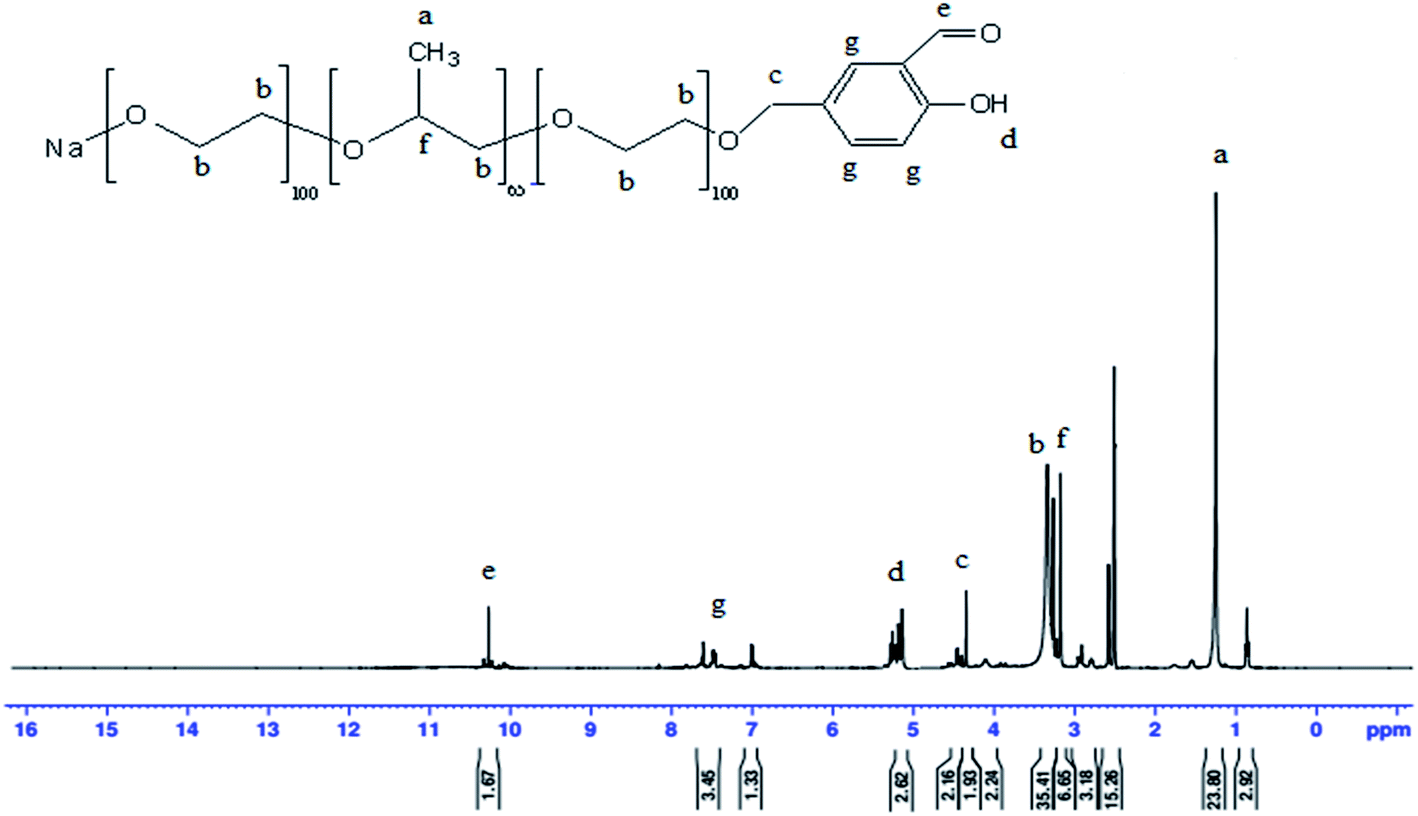 | ||
| Fig. 1 1H NMR for 2-hydroxy-5-((2-(2-(2-hydroxyethoxy)propoxy)ethoxy)methyl)benzaldehyde (modified AP–Salen). | ||
Fig. 2 the 1H-NMR for SB in (DEMSO, TMS), δ ppm: 8.9 (a, 1H, –CN); 2.6 (b, 1H, –O); 3.4 (4H, –O–C2–C2–O–); 7.8 (d, 3H,  CH2–CH2); 8.9 (e, 2H, C2–Cl); 5.3 (f, 1H, –O); 4.51 (d, 2H, C2–).
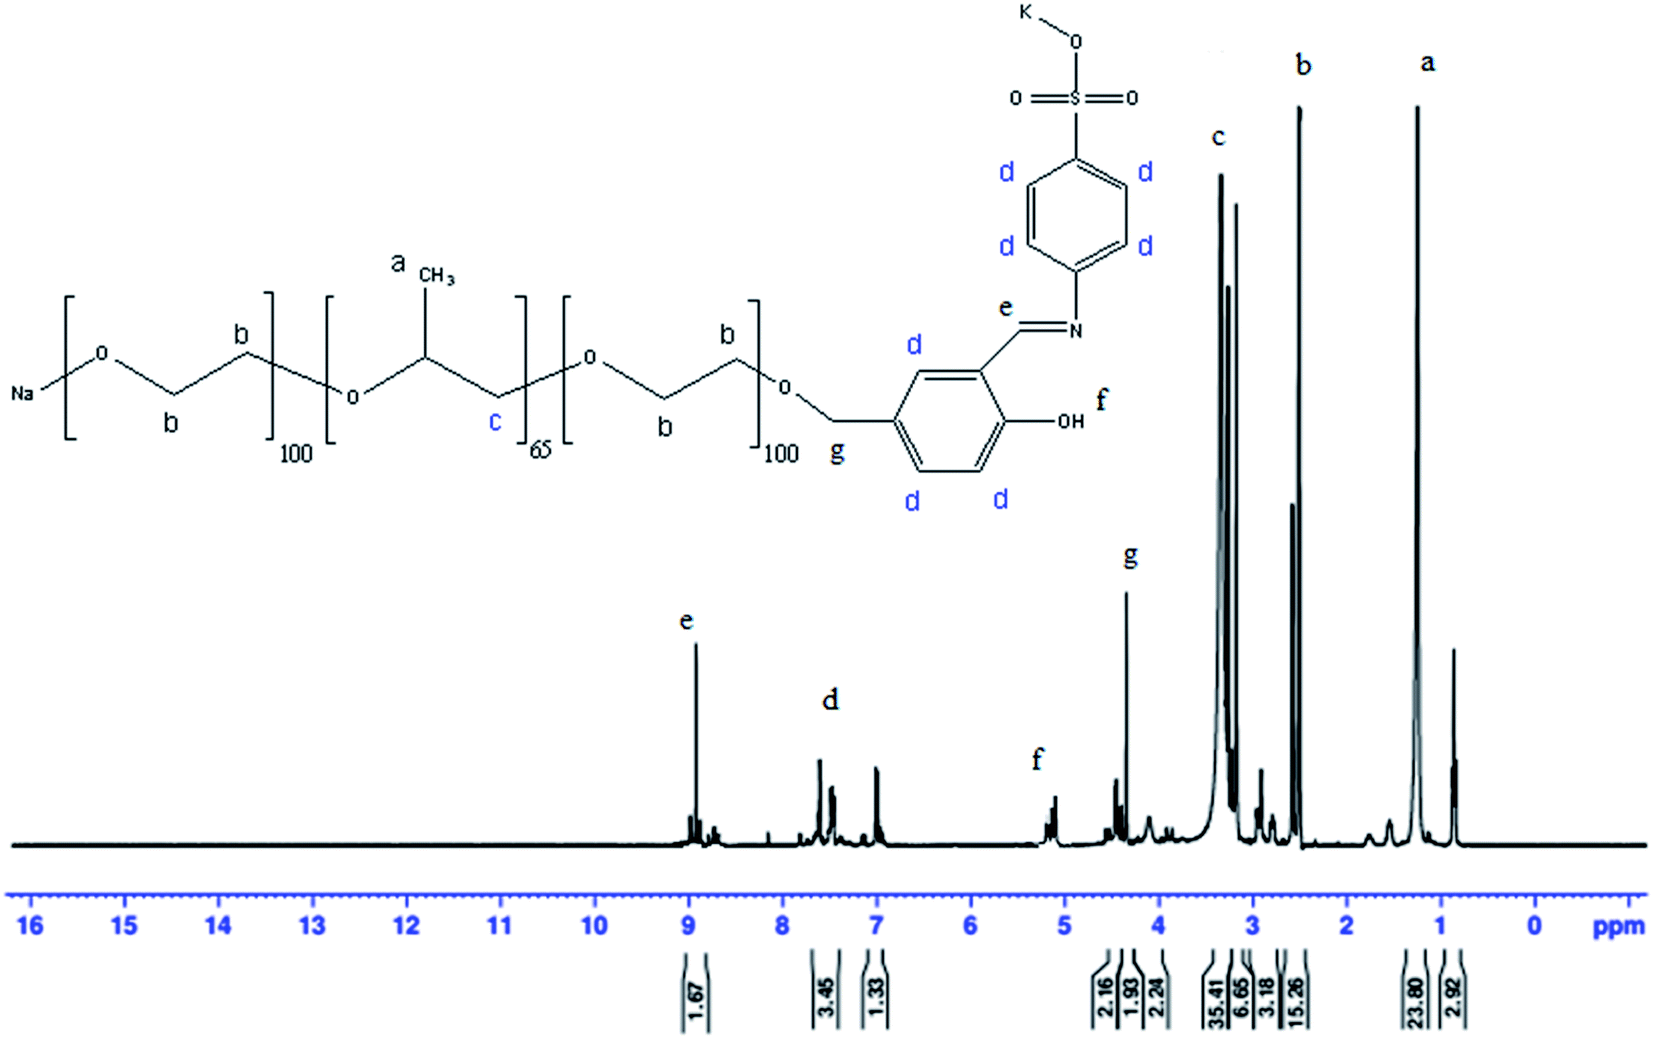 | ||
| Fig. 2 1H NMR for potassium sodium (E)-4-(2-hydroxy-5-((2-(2-(2-oxidoethoxy)propoxy)ethoxy)methyl)benzylideneamino)benzenesulfonate (SB). | ||
Fig. 3 the 1H-NMR for organo-metallic surfactants OMS Ni2+ (DEMSO, TMS): δ ppm: 6.83 (d, 2H, Ar-); 7.59 (s, 2H, Ar-).10,11
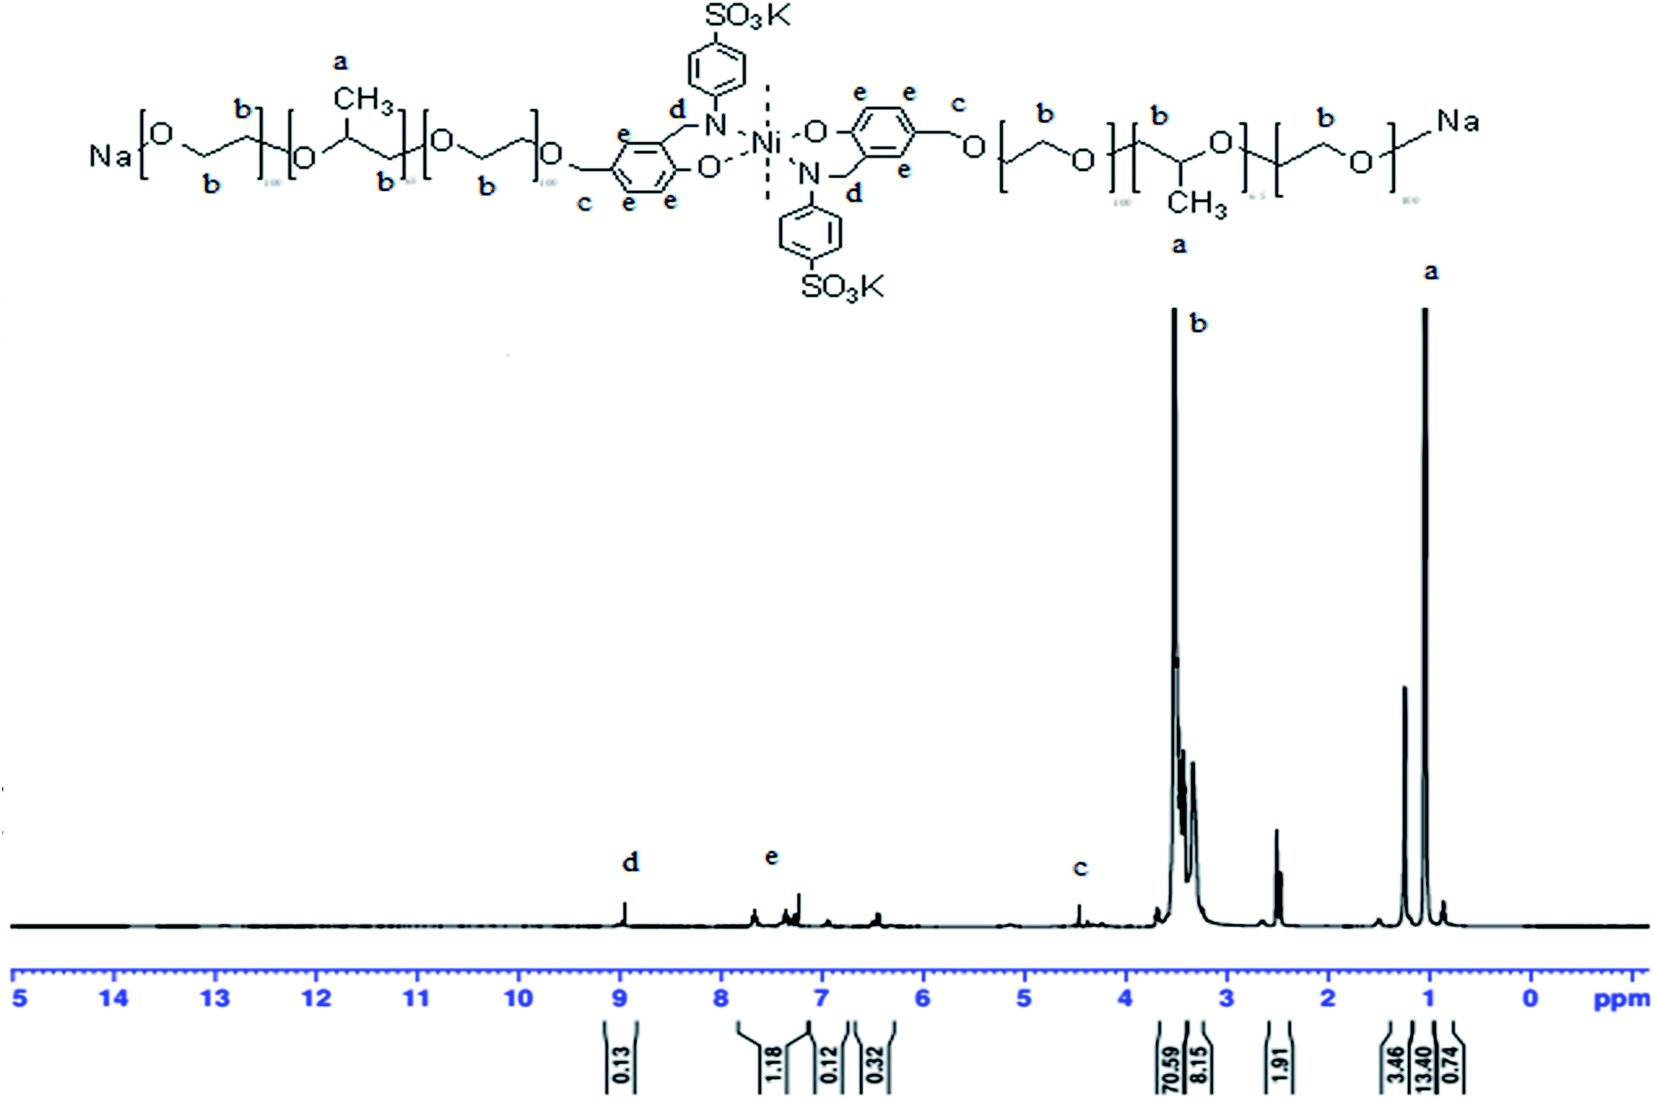 | ||
| Fig. 3 1H NMR of the Bi-AP–Salen sodium 2-(1-(2-(3-formyl-1,4-hydroxy-phynoxy)ethoxy)propan-2-yloxy)ethanolate Ni(II) complex. | ||
3.3. IR spectroscopy
Fig. 4 shows the IR spectrum of the target product. From Fig. 4, it can be seen that the absorption peaks at 2924 and 2853 cm−1 are caused by the tensile and bending vibrations of –CH2 and –CH3, respectively, while the absorption peaks at 1618 and 1492 cm−1 are caused by the vibrations of the benzene ring skeleton. The absorption peak at 1256 cm−1 corresponds to the vibration of the ester group, and the absorption peak near 1184 cm−1 is related to the vibration of the sulfonic acid group.12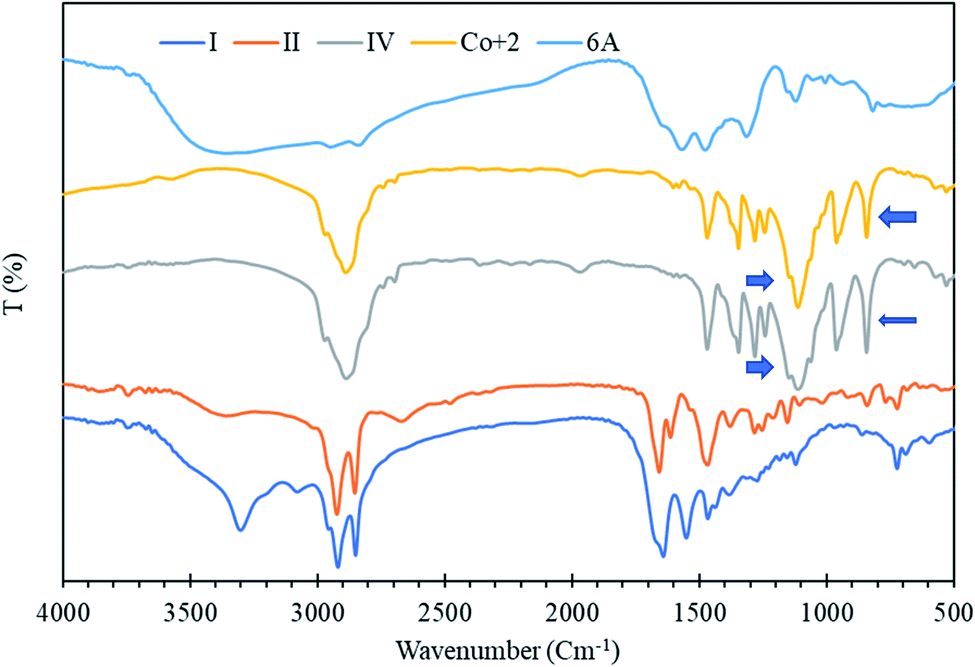 | ||
| Fig. 4 FTIR for the prepared materials (I) Salen, S, (II) sodium alkoxide, (IV) SB MOS–Co2+. | ||
The peak at 1097 cm−1 is attributed to the presence of the SO– group. The small absorption peaks at 710 and 632 cm−1 correspond to the SO group.32,33
3.4. SEM/EDX investigation
The X-ray diffractograms were carried out using an XPERT X-ray diffractometer equipped with a silicon detector and X-ray accelerating voltage 18 kV with a magnification of 1448×.Fig. 5(a)–(e) shows the EDX diagram and the K orbital metal in the OMS surfactants in the solid phase. The metals in the complex structures were as following; 20.4, 11.92, 10.21, 15.74, and 3.70 against MOS–Ni2+, MOS–Co2+, MOS–Cu2+, MOS–Fe2+, and MOS–Mn2+, respectively. The SEM images show the shape of MOS–Ni2+, MOS–Co2+, MOS–Cu2+, MOS–Fe2+, and MOS–Mn2+, which look like layers, needles, brain, scales, and leaves, respectively.
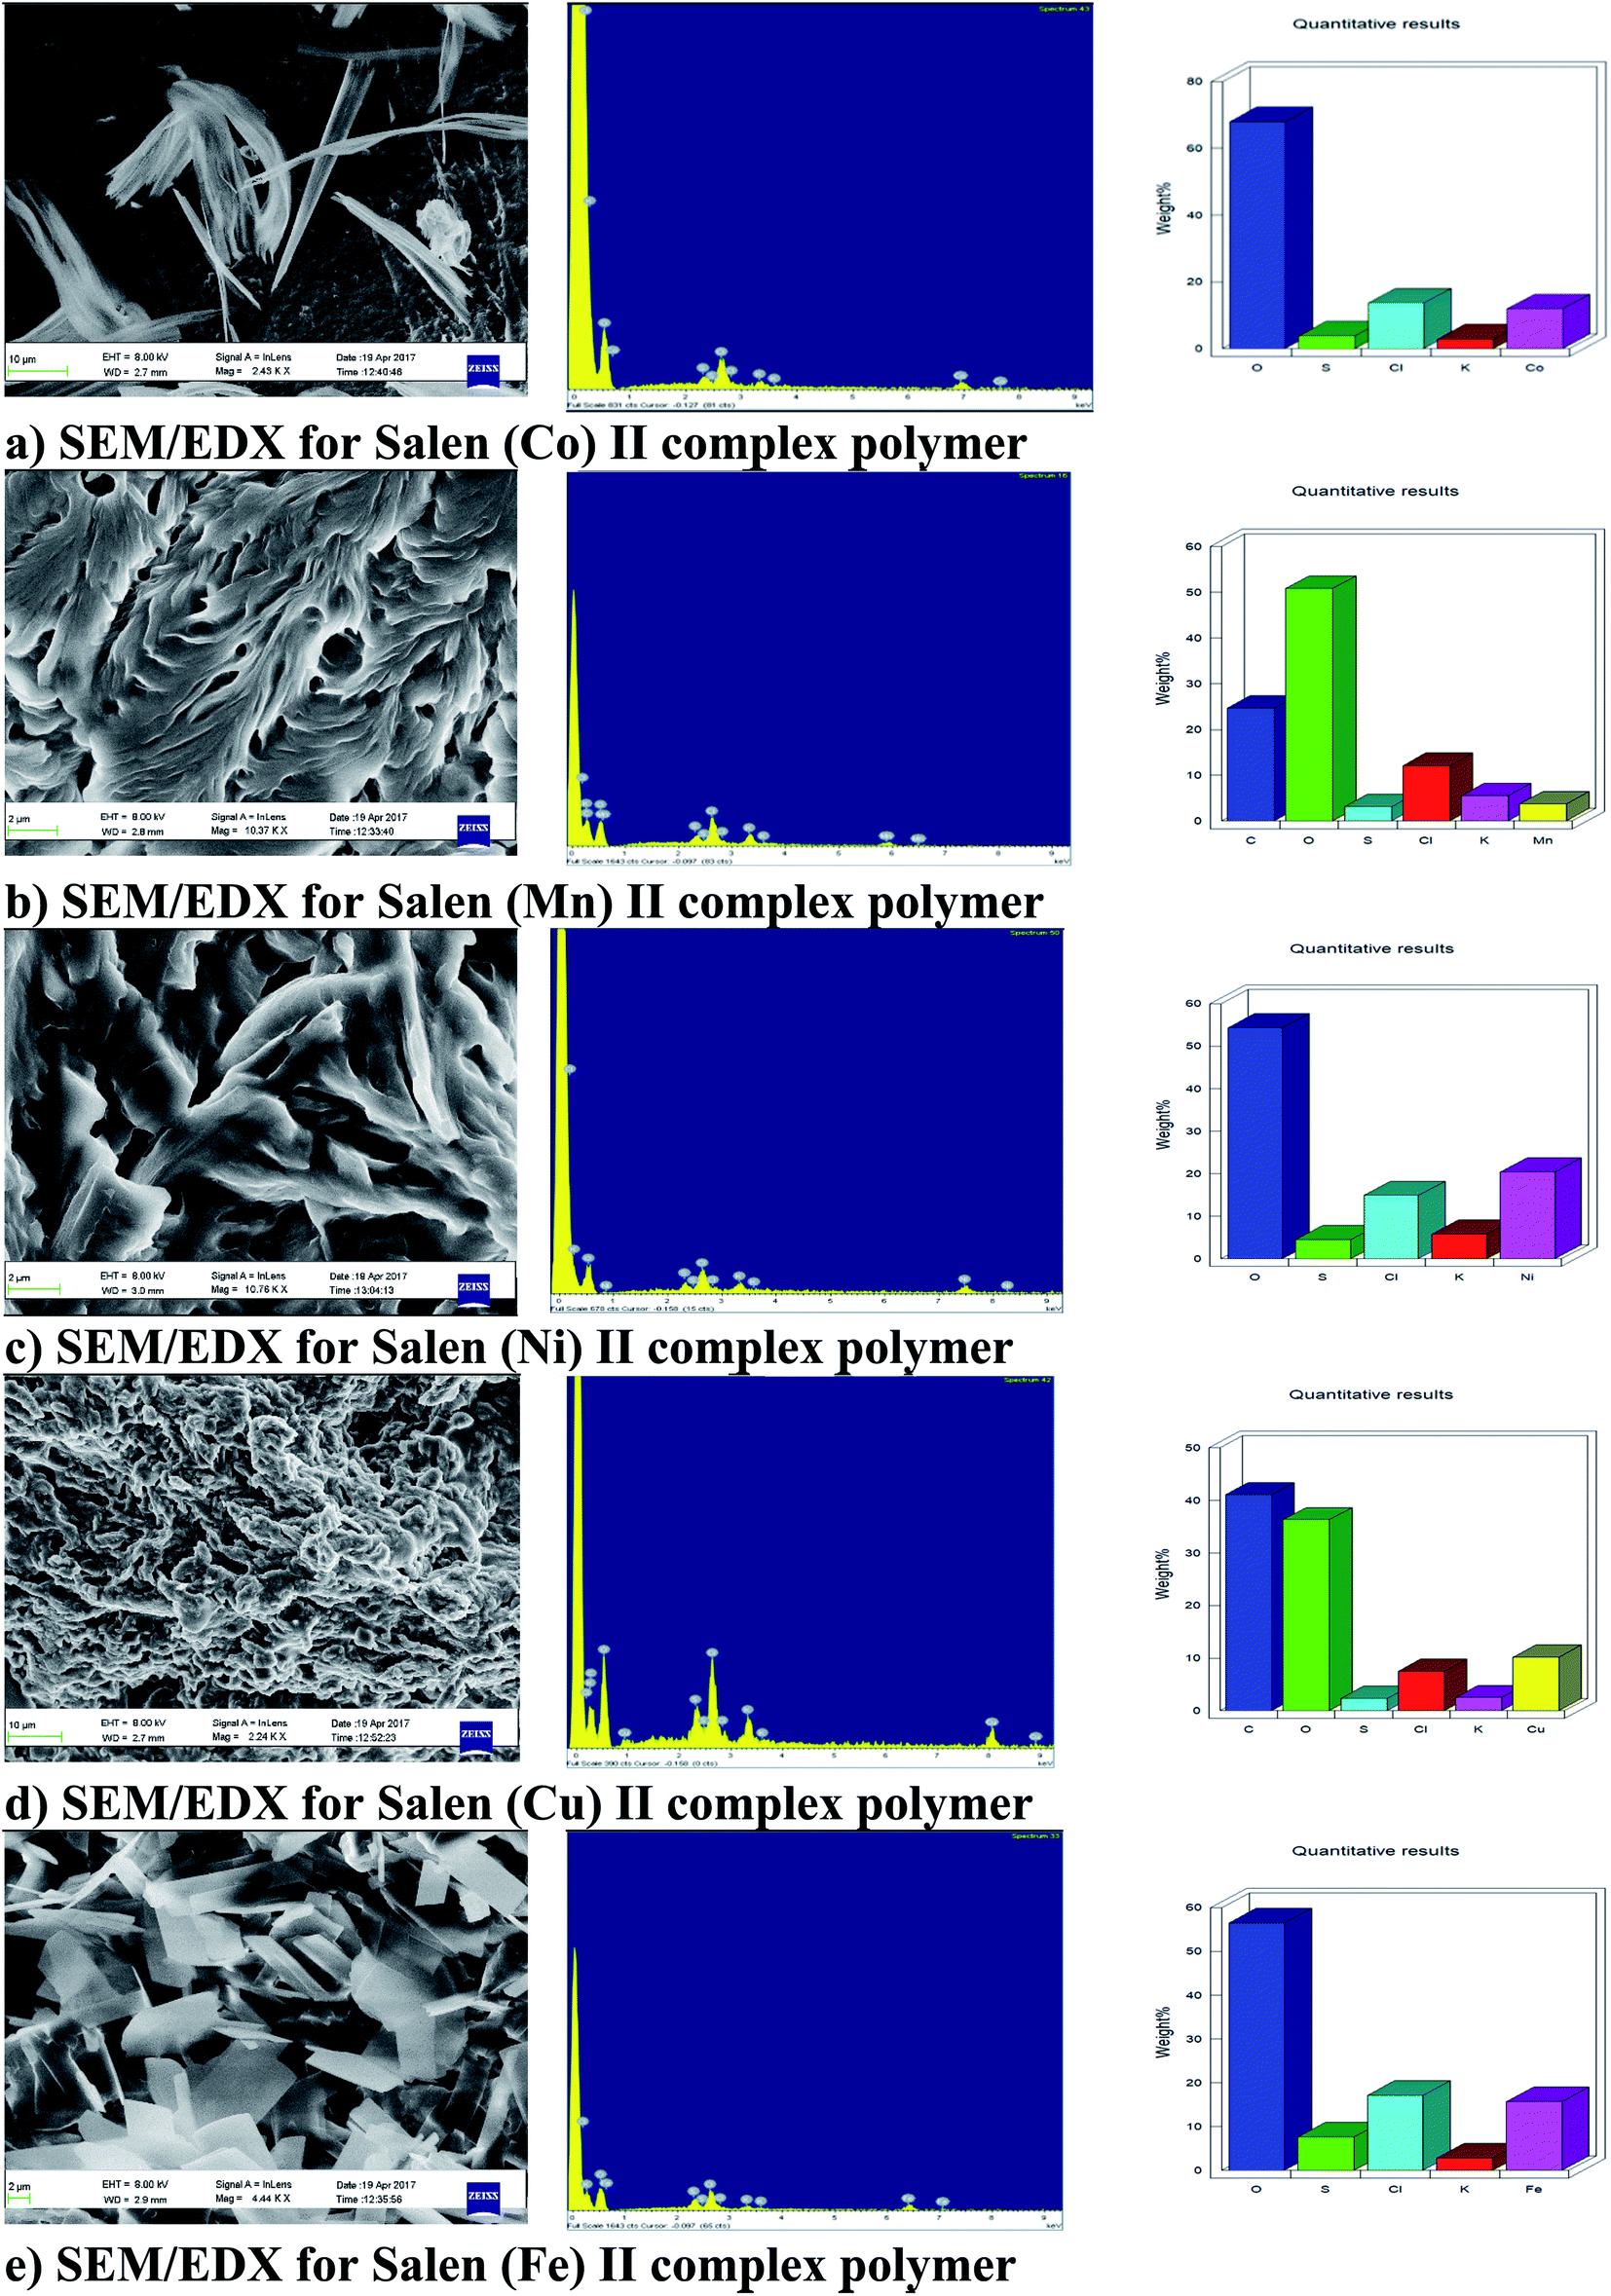 | ||
| Fig. 5 The SEM and EDX of the OMS for (a) Co2+, (b) Mn2+, (c) Ni2+, (d) Cu2+ and (e) Fe3+. | ||
From the SEM/EDX results, it can be concluded that the used metal was successfully embedded by the chemical reaction to form the new family of the organo-metallic surfactants OMS.
The H1NMR, FTIR, and SEM/EDX justified the chemical structure of the new family of surfactants as we expected.
3.5. Gibbs adsorption isotherm and thermodynamic properties of the OMS
The γ–lnC adsorption isotherm of the OMS solutions at different temperatures is plotted in Fig. 6. By increasing the concentration of the surfactant, the surface tension decreases until the change is a constant, and this point indicates the critical micelle concentration (CMC). At higher concentrations than the critical change, the aqueous/air interface becomes completely saturated with monolayers named as Gibbs adsorption monolayers. This layer is promoting the formation of spherical micelles in the bulk of the solution phase. The minimum surface tension value of 29 and 31 mN m−1 was pronounced at CMC (9.14 × 10⁻³ mol dm−3) for the Ni–OMS and Cu–OMS, respectively.
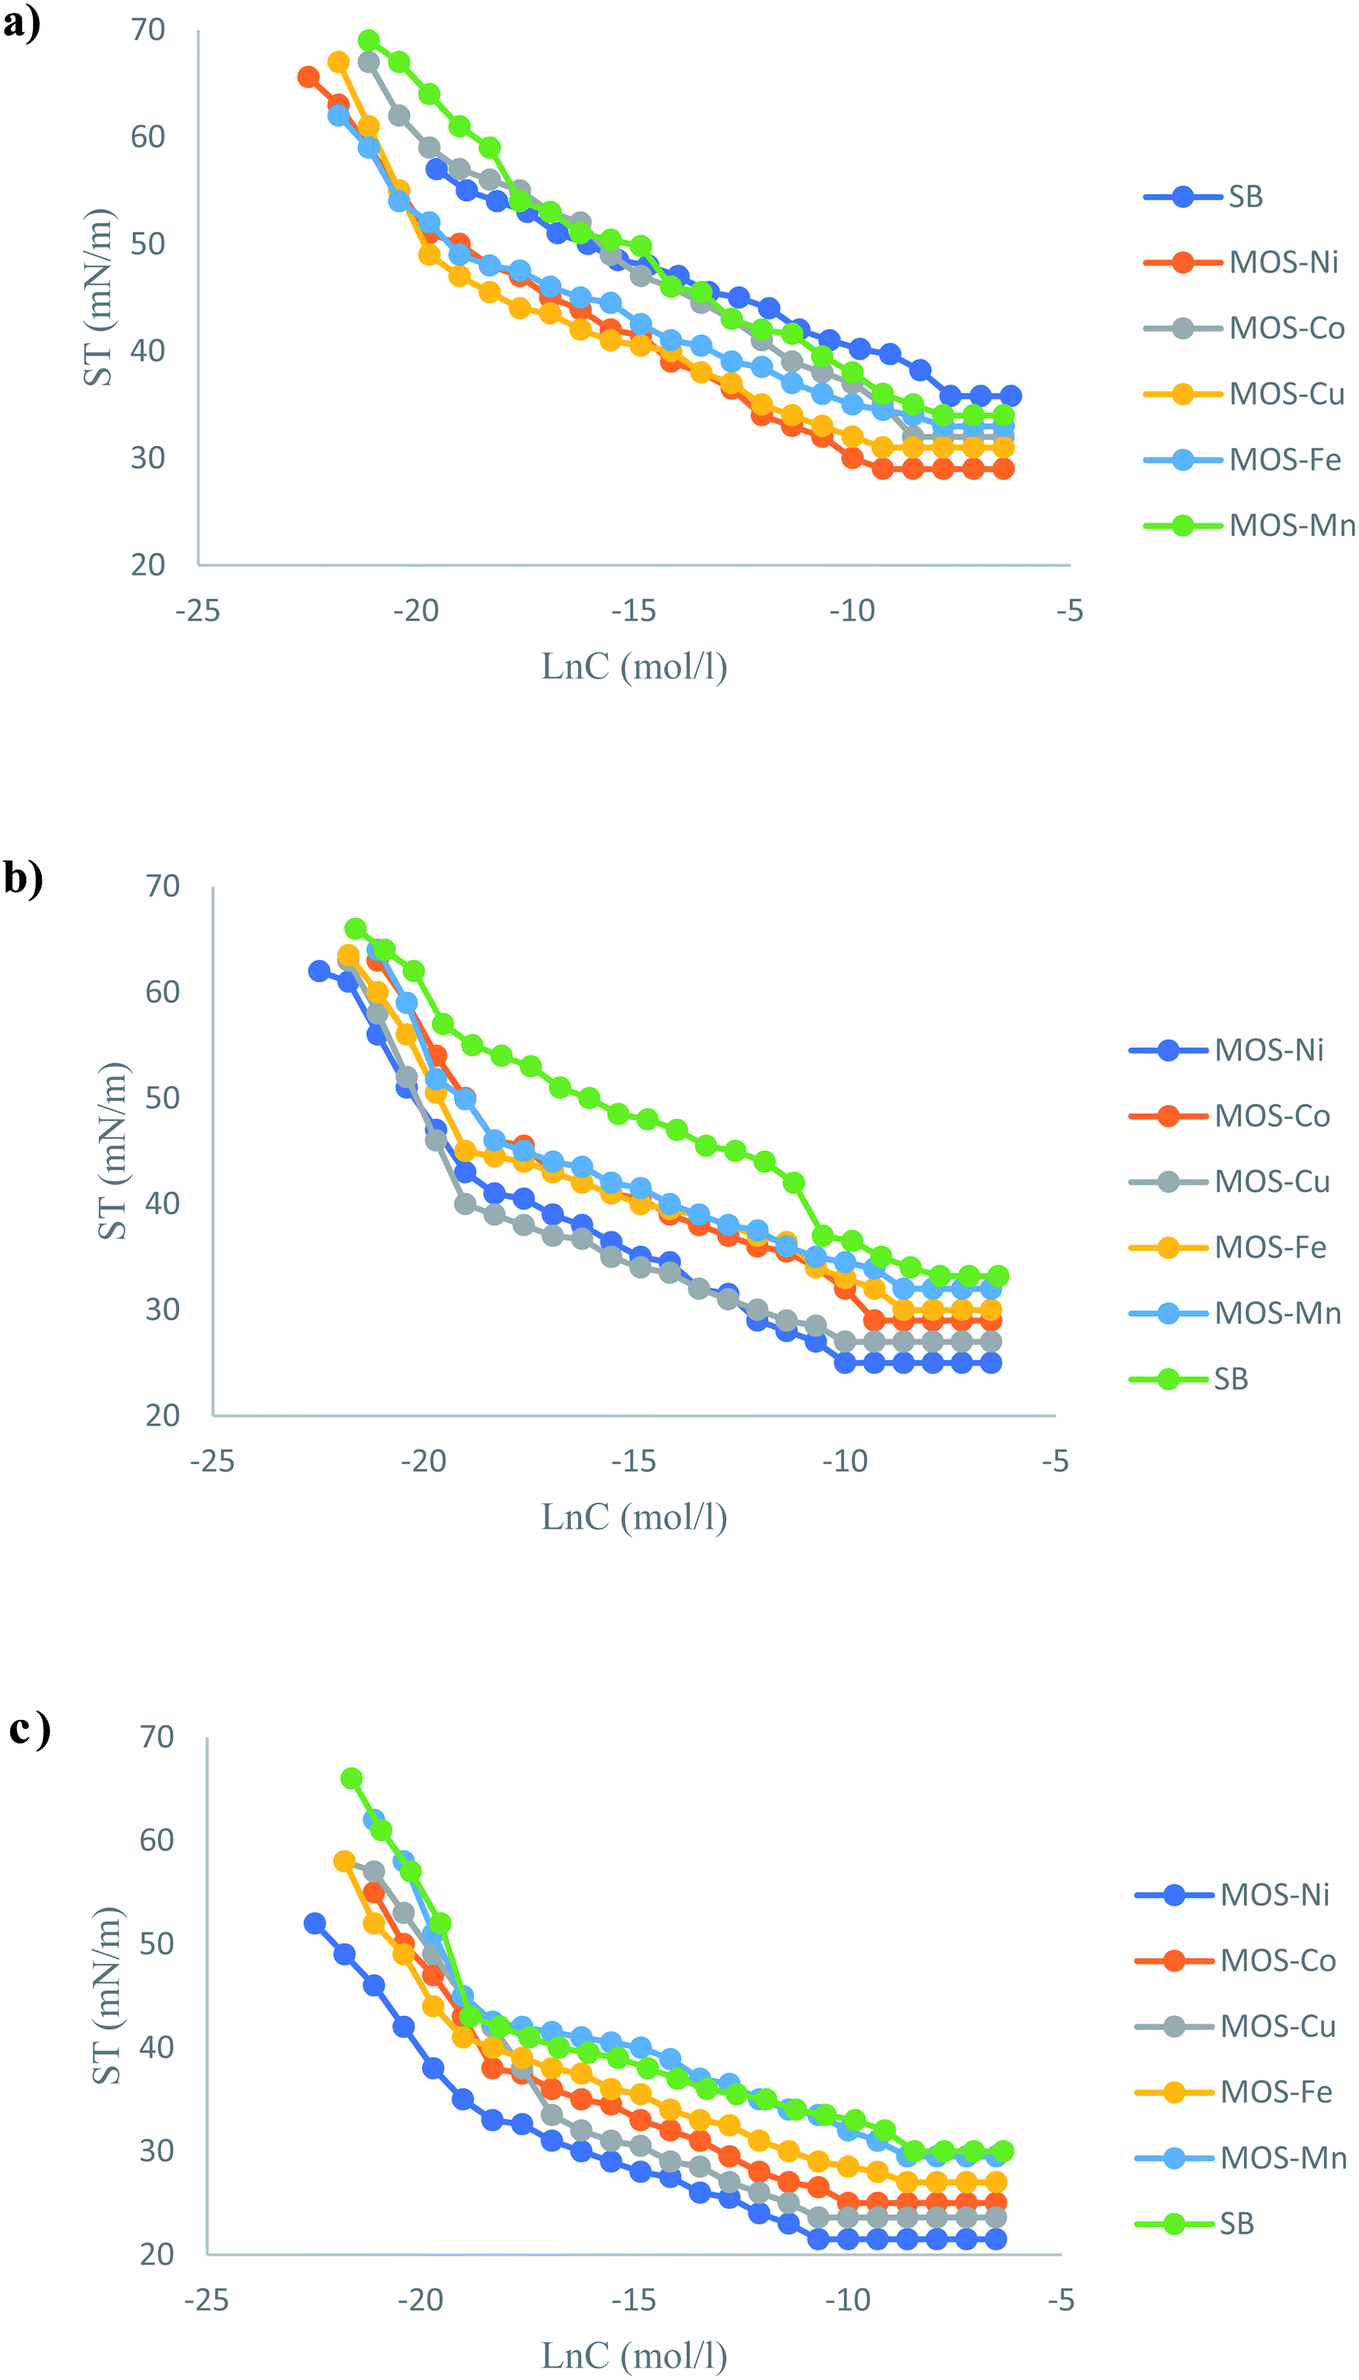 | ||
| Fig. 6 γ–lnC isotherm for the OMS, (a) at 20 °C, (b) at 35 °C, (c) at 50 °C. | ||
The surface tension at CMC for Co–OMS, Fe–OMS, and Mn–OMS was 32, 33, and 34 mN m−1, respectively, and the CMC was situated between 37.1 and 18.4 mol dm−3 for them. The surface–active properties of the OMS aqueous solution are described in terms of two items: surface effectiveness (πCMC) and adsorption efficiency (PC20). These two parameters were calculated using eqn (1) and (2):
| πCMC = γo − γCMC(t) | (1) |
|
PC20 = −logC20
| (2) |
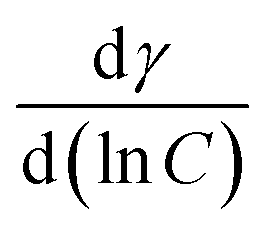
That means these two surfactants have effectiveness higher than the other OMS surfactants (Co–OMS, Fe–OMS, and Mn–OMS). These results show that Ni–OMS and Cu–OMS can effectively saturate any interface, thereby showing surface attributes with required flexibility and favorably low interfacial tension.24–26 The surfactant molecules lower the surface tension, which contribute towards a quantitative investigation showing the Ni–OMS and Cu–OMS concentration that continuously adsorbed onto the aqueous solution interface (air/aqueous). So that, the concentration values less than the CMC can be completely ignored. From surface tension versus the natural logarithm of the OMS concentration plots just below the CMC, the maximum surface excess concentration (Γmax) is calculated by the Gibbs adsorption equation, (3).
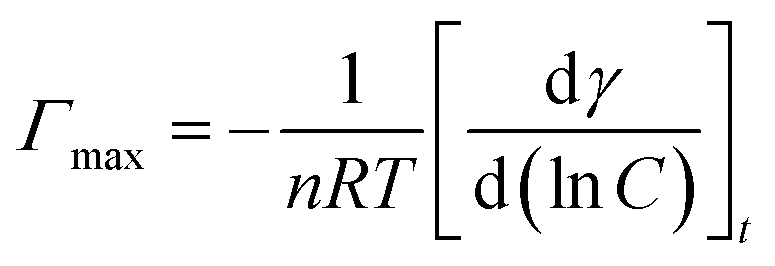 | (3) |
 is the slope of the pre-CMC line in the plots (Fig. 6). R is the universal gas constant equal (8.314 J K−1 mol−1), T is the temperature in Kelvin and γ is the surface tension value, mN m−1.27,28 The Gibbs adsorption coefficient (n) is a function of the number of constituent species that are adsorbed at the interface and is taken as two values for the anionic surfactant system.29
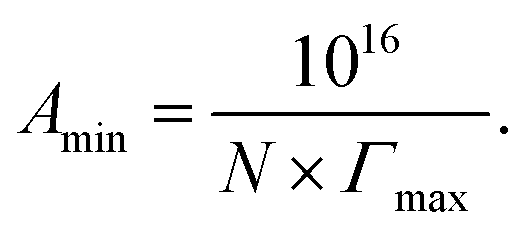
The minimum area Amin occupied per surfactant molecule Å2 per molecule at the air/aqueous interface is the inverse proportion with +ve values (Γmax), as shown in the following equation:
 | (4) |
The electric conductivity was measured at different concentrations and temperatures to determine two terms. The first term is the determination of CMC for the OMS as an ionic molecule (Fig. 6). The second term is the calculation of the ionic molecule mole fraction (α) of the counterion to determine the degree of binding (β) of the ionic surfactant molecule. The values of (β) are listed in Table 2. The degree of counter ion binding (β) of OMS is calculated from the ratio of the slopes of the two linear lines of the conductivity plot (Fig. 7). The (β) value of the aqueous solution indicates the negatively charged counter ions of Na+ and K+ associated with the micelles and is a significant factor in calculating the free energy of the micellization of the ionic surfactant solution. The (β) values for OMS decrease with the increase in temperature. As seen in Table 2, with the increase in temperature, the electrostatic repulsion of counter ion decreases; this maybe lead to an increase in the thermodynamic stability of micelle formation—further ease in enhancing the thermodynamic stability of microemulsion. In the anionic moiety of OMS, the micelle formation occurs by a combined effect of the electrostatic repulsive interactions between the polar head groups that prevent the formation of the large micelles and the attractive hydrophobic forces between the hydrocarbon tail chains aiding in aggregation. Hence, the micellization is necessarily an association–dissociation process that allows the coexistence of micelles and surfactant molecules. The Gibbs free energy change of micellization (ΔGmic) for the OMS surfactant solution with the multivalent cations is calculated using the following equation.33
|
ΔGmic = (1 + β)RTlnCMC
| (5) |
| ID | M. wt | Temp., °C | CMC, mol dm−3 | PC20, mol dm−3 | γCMC, mN m−1 | πCMC, mN m−1 | Γmax × 10−10 | Amin × 102 | ΔGmic, kJ mol−1 | ΔGads, kJ mol−1 |
|---|---|---|---|---|---|---|---|---|---|---|
| OMS–Ni | 6458.7 | 20 | 9.14 × 10⁻³ | 4.03 | 29 | 38.4 | 74.23 | 2.24 | −22.65 | −27.83 |
| OMS–Co | 6458.9 | 18.4 × 10⁻³ | 3.73 | 32 | 35.4 | 88.92 | 1.87 | −20.94 | −24.93 | |
| OMS–Cu | 6463.5 | 9.14 × 10⁻³ | 4.03 | 31 | 36.4 | 57.56 | 2.89 | −22.65 | −28.98 | |
| OMS–Fe | 6455.8 | 37.1 × 10⁻³ | 3.43 | 33 | 34.4 | 57.96 | 2.87 | −19.24 | −25.18 | |
| OMS–Mn | 6454.9 | 37.1 × 10⁻³ | 3.43 | 34 | 33.4 | 77.80 | 2.13 | −19.24 | −23.54 | |
| SB | 6391 | 45.3 × 10⁻³ | 3.34 | 35.7 | 31.7 | 64.31 | 2.58 | −18.76 | −23.70 | |
| OMS–Ni | 6858.7 | 35 | 4.59 × 10⁻³ | 4.33 | 25 | 42.4 | 64.31 | 2.58 | −25.58 | −25.58 |
| OMS–Co | 6858.9 | 9.14 × 10⁻³ | 4.03 | 29 | 38.4 | 65.90 | 2.52 | −23.81 | −23.82 | |
| OMS–Cu | 6863.5 | 4.59 × 10⁻³ | 4.33 | 27 | 40.4 | 46.84 | 3.55 | −25.58 | −25.58 | |
| OMS–Fe | 6855.8 | 18.4 × 10⁻³ | 3.73 | 30 | 37.4 | 52.80 | 3.15 | −22.02 | −22.02 | |
| OMS–Mn | 6854.9 | 18.4 × 10⁻³ | 3.73 | 32 | 35.4 | 52.40 | 3.17 | −22.02 | −22.02 | |
| SB | 6800 | 45.3 × 10⁻³ | 3.34 | 33.2 | 34.2 | 77.41 | 2.15 | −19.72 | −19.72 | |
| OMS–Ni | 6858.7 | 50 | 2.30 × 10⁻³ | 4.63 | 21.5 | 45.9 | 46.84 | 3.55 | −29.12 | −38.92 |
| OMS–Co | 6858.9 | 4.59 × 10⁻³ | 4.33 | 25 | 42.4 | 65.90 | 2.52 | −27.24 | −33.68 | |
| OMS–Cu | 6863.5 | 2.28 × 10⁻³ | 4.64 | 23.6 | 43.8 | 44.86 | 3.70 | −29.15 | −38.91 | |
| OMS–Fe | 6855.8 | 18.4 × 10⁻³ | 3.73 | 27 | 40.4 | 49.62 | 3.35 | −23.45 | −31.59 | |
| OMS–Mn | 6854.9 | 18.4 × 10⁻³ | 3.73 | 29.6 | 37.8 | 49.22 | 3.37 | −23.45 | −31.13 | |
| SB | 6800 | 21.6 × 10⁻³ | 3.66 | 30 | 37.4 | 44.06 | 3.77 | −23.02 | −31.50 |
| ID | β conductivity, μS | ||
|---|---|---|---|
| 20 °C | 35 °C | 50 °C | |
| MOS–Ni2+ | 1.36 | 2.47 | 2.89 |
| MOS–Co2+ | 1.65 | 2.59 | 3.05 |
| MOS–Cu2+ | 1.90 | 2.86 | 3.18 |
| MOS–Fe3+ | 2.14 | 3.01 | 3.42 |
| MOS–Mn2+ | 2.26 | 3.12 | 3.78 |
| SB | 2.55 | 3.38 | 3.90 |
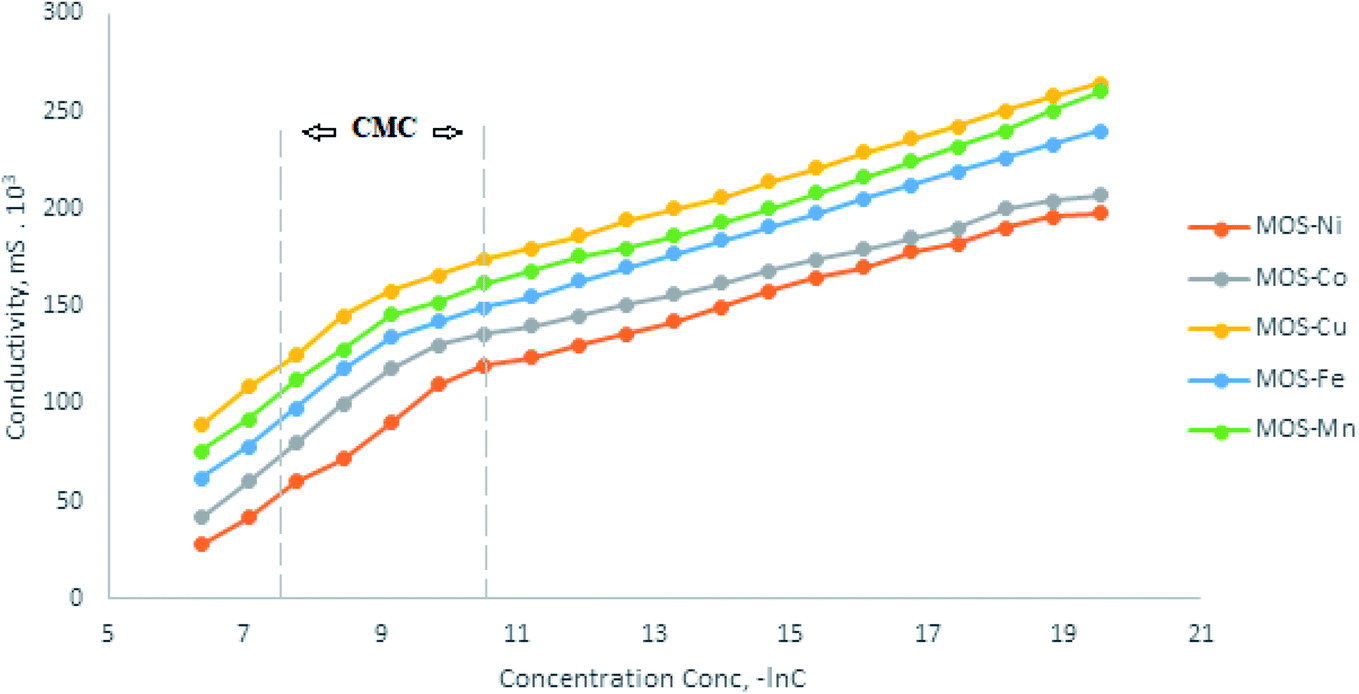 | ||
| Fig. 7 Conductivity, mS × 103 and concentration, −lnC at 50 °C. | ||
The values of ΔGmic, as are seen in Table 1, are negative for all OMS surfactants at different temperatures. The β value is a measure of the counterions present in the stern layers, which counterbalance the electrostatic forces of repulsion among polar head groups.34–36 As temperature increases, the value of β increased showing an increased tendency to micellization in the bulk phase. As a result, ΔGmic was observed to increase on the negative side with a temperature rise, showing increased micellization spontaneity. That means that the OMS molecule is just added to the aqueous phase, and the surfactant molecules initially adsorb at the interface. The Gibbs free energy of adsorption (ΔGads) is determined using the following equation:
| ΔGads = ΔGmic − [6.023πCMCAmin] × 10−3. | (6) |
The negative values of ΔGads show the tendency of the adsorption of the OMS molecules at the interface. By investigation of the thermodynamics parameters of OMS molecules,37 the two processes, micellization and adsorption, are spontaneous. However, ΔGads was observed to be more negative in comparison to ΔGmic. The net results show that the adsorption is more favorable to the OMS molecules than the micellization process. The negative values of ΔGmic increase with temperature, showing that the tendency of surfactant molecules to form micelles improved due to a reduction in surfactant CMC by temperature (Table 1). As a result of the CMC decrease with the increase in temperature in the experimental range, the tendency of OMS molecules to aggregate is evident at a lower concentration in the aqueous solution. The more negative value of ΔGads increases due to an increase in the curvature of the air-aqueous surface. This means that the number of available vacancy sites for adsorption is increased, and more OMS molecules should be adsorbed at the interface with temperature elevation. The surfactant enhances microemulsion at the CMC concentration. The results of ΔGmic and ΔGads are −ve values, and then OMS molecules formed a stable microemulsion phase and also exhibited effective interfacial interactions with the surrounding media. The inspection of the aggregation and adsorption properties of surfactant systems contributes towards the proper formulation of the surfactant in different systems and applications, such as in oil solubilization and displacement processes.38 OMS could be used to give significant potential in the field of enhanced oil recovery (EOR).
3.6. Interfacial tension, IFT
The interfacial tension is a crucial term to evaluate the effectiveness of the surfactant molecules to beneficial in the application to enhance oil recovery (EOR).39–42 The lower IFT values of IFT mean there is more remarkable ability to solubilize the oil, furthermore enhancing the microemulsion phase.43 The microemulsion is effectively displacing the oil trapped in the pore throats of the reservoir. The IFT was measured for the OMS in the formation of water at CMC and (20 to 70 °C) against heavy crude oil. The results of the IFT are listed in Table 3. The data showed that the IFT values decreased with the increase in temperature, and they are situated between 10−1 and 10−2 mN m−1. These results are considered suitable for using these surfactants in the EOR applications. The OMS–Ni and OMS–Cu pronounced the minimum value of IFT to 10−2 mN m−1 at 50 and 70 °C. OMS–Co, OMS–Fe, and OMS–Mn exhibited IFT in the order 10−1 mN m−1 and so on at 70 °C.| Surfactant | IFT, mN m−1 at different temp., °C | |||
|---|---|---|---|---|
| 20 | 35 | 50 | 70 | |
| Blank sample | 28 | 26 | 25 | 23 |
| OMS–Ni | 4 × 10⁻¹ | 2 × 10⁻¹ | 7 × 10⁻² | 2 × 10⁻² |
| OMS–Co | 8 × 10⁻¹ | 5 × 10⁻¹ | 4 × 10⁻¹ | 2 × 10⁻¹ |
| OMS–Cu | 4 × 10⁻¹ | 1 × 10⁻¹ | 6 × 10⁻² | 1 × 10⁻² |
| OMS–Fe | 9 × 10⁻¹ | 7 × 10⁻¹ | 5 × 10⁻¹ | 3 × 10⁻¹ |
| OMS–Mn | 8 × 10⁻¹ | 6 × 10⁻¹ | 4 × 10⁻¹ | 2 × 10⁻¹ |
As shown in Fig. 8 and Table 3, the IFT decreased slightly by increasing the temperature.
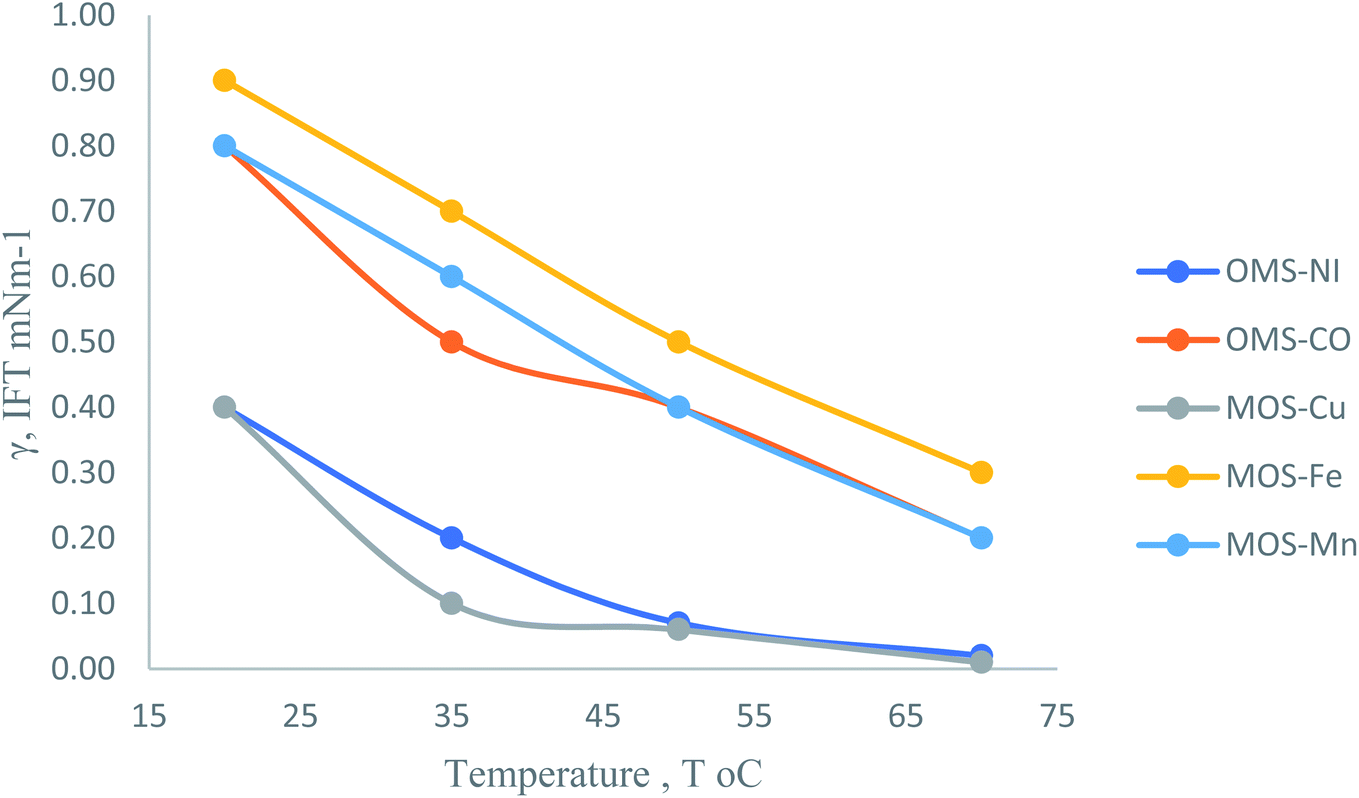 | ||
| Fig. 8 γ IFT, mN m−1 at different temperatures, T °C. | ||
These results were obtained due to the temperature increase, which increases the free energy of surfactant molecules in the solvent and helps to push them to adsorb on the interface.44 The increase in the surfactant molecule on the interface increases the ability of the surfactant to solubilize the oil phase to form microemulsion; further, the production of oil should be increased.
3.7. Particle size characteristics [dynamic light scattering (DLS)]
DLS is a light scattering technique where a laser is shown through the aggregation of micelles, which causes the laser light to scatter (Rayleigh scattering). Because the micelles moving under Brownian motion, fluctuations in the scattering were measured at specific time intervals, which are then connected to an autocorrelation function. A diffusion coefficient is then determined using the Mie theory (based on this autocorrelation function and the refractive index of the sample), followed by the micelle size using the Stokes–Einstein equation. Immediately, at CMC, the micelles were sized using the dynamic light scattering (DLS) technique. DLS is a well-established and widely used method for determining the size and polydispersity of micelles aggregation within a sample. From the data of DLS, the micelle size and zeta-potential of MOS aggregation are listed as: MOS–Ni2+ (88.79 nm and 7.36 mV), MOS–Co2+ (81.43 nm and 7.93 mV), MOS–Cu2+ (35.33 nm and 18.2 mV), MOS–Fe3+ (70.56 nm and 11.1 mV), MOS–Mn2+ (15.54 nm and 8.22 mV). It was found that the size of the micelle of these families of surfactants is between 15.54 and 88.79 nm, whereas the results of zeta-potential (7.36 and 18.2 mV) are for all MOS–M complexes.4. Conclusion
The conclusion of this work can be drawn in the following points:(1) A new family of surfactants based on Salen–M complexes named MOS–Ni2+, MOS–Co2+, MOS–Cu2+, MOS–Fe3+, and MOS–Mn2+ were prepared. 1H NMR, FTIR, and SEM confirmed the chemical structure of these surfactants.
(2) The surface–active properties of this new family of surfactants were investigated, and they exhibited significant characteristics from the achieved data.
(3) The DLS study cleared that the MOS surfactants give a spherical micelle at the CMC in the range from 7.36 to 18.2 nm.
(4) The IFT of the OMS surfactants at the CMC concentration against heavy crude oil exhibited IFT situated between 10−2 and 10−1, which gives a good indication to use in the EOR application.
Conflicts of interest
There are no conflicts to declare.Acknowledgements
The authors would like to thank EPRI-EOR unit, which was established according to The Joint-Granted Project and collaboration contract no. 56/2015 between the Academy of Scientific Research and Technology (ASRT) and the Egyptian Petroleum Research Institute (EPRI).References
- R. Santos, W. Loh, A. Bannwart and O. Trevisan, Braz. J. Chem. Eng., 2014, 31, 571 CrossRef.
- A. O. Gbadamosi, R. Junin, M. A. Manan, A. Agi and A. S. Yusuff, Int. Nano Lett., 2019, 9, 171 CrossRef CAS.
- B. N. Tackie-Otoo, M. A. A. Mohammed, N. Yekeen and B. M. Negash, J. Pet. Sci. Eng., 2019, 106828 Search PubMed.
- O. G. Apaydin and A. R. Kovscek, Transp. Porous Media, 2001, 43, 511 CrossRef CAS.
- C. Negin, S. Ali and Q. Xie, Petroleum, 2017, 3, 197 CrossRef.
- A. M. Al-Sabagh, T. T. Khidr, H. M. Moustafa, M. R. Mishrif and M. H. Al-Damasy, Pet. Sci. Technol., 2017, 35, 1381 CrossRef CAS.
- O. Wagner and R. O. Leach, Soc. Pet. Eng. J., 1966, 6, 335 CrossRef CAS.
- M. N. Agista, K. Guo and Z. Yu, Appl. Sci., 2018, 8, 871 CrossRef.
- L. Xiang, Chem. Reagents, 2001, 4 Search PubMed.
- M. Migahed, A. Alsabagh, M. Abdou, A.-H. Adel and A. A. Aboulrous, J. Mol. Liq., 2019, 281, 528 CrossRef CAS.
- A. Al-Sabagh, M. Betiha, D. Osman and T. Mahmoud, J. Appl. Polym. Sci., 2019, 136, 47333 CrossRef.
- A. Alsabagh, M. Hassan, S. Dosouky, N. Nasser, E. Elsharaky and M. Abdelhamid, Egypt. J. Pet., 2016, 25, 355 CrossRef.
- A. Alsabagh, M. Hassan, S. Desouky, N. Nasser, E. Elsharaky and M. Abdelhamid, Egypt. J. Pet., 2016, 25, 585 CrossRef.
- A. Al-Sabagh, M. Zakaa and M. Noor El-Din, J. Dispersion Sci. Technol., 2009, 30, 1237 CrossRef CAS.
- K. Kosswig, Ullmann's encyclopedia of industrial chemistry, 2000 Search PubMed.
- A. Al-Sabagh, Polym. Adv. Technol., 2000, 11, 48 CrossRef CAS.
- A. Al-Sabagh, T. Mahmoud, M. H. Helal, A. E. Abd Elrahman and M. El-Rayes, Egypt. J. Chem., 2019, 62, 5 CrossRef.
- K. Gupta and A. K. Sutar, Coord. Chem. Rev., 2008, 252, 1420 CrossRef CAS.
- Z. Wang, M. Lin, S. Jin, Z. Yang, Z. Dong and J. Zhang, Combined flooding systems with polymer microspheres and nonionic surfactant for enhanced water sweep and oil displacement efficiency in heterogeneous reservoirs, J. Dispersion Sci. Technol., 2019, 1–10 CrossRef.
- J. S. Archer and C. G. Wall, Petroleum engineering: principles and practice, Springer Science & Business Media, 2012 Search PubMed.
- B. F. Towler, Fundamental principles of reservoir engineering, 2002 Search PubMed.
- A. O. Gbadamosi, R. Junin, M. A. Manan, A. Agi and A. S. Yusuff, An overview of chemical enhanced oil recovery: recent advances and prospects, Int. Nano Lett., 2019, 9, 171–202 CrossRef CAS.
- A. K. Manshad, M. Rezaei, S. Moradi, I. Nowrouzi and A. H. Mohammadi, Wettability alteration and interfacial tension (IFT) reduction in enhanced oil recovery (EOR) process by ionic liquid flooding, J. Mol. Liq., 2017, 248, 153–162 CrossRef CAS.
- D. O. Shah, Improved oil recovery by surfactant and polymer flooding, Elsevier, 2012 Search PubMed.
- A. A. Olajire, Review of ASP EOR (alkaline surfactant polymer enhanced oil recovery) technology in the petroleum industry: Prospects and challenges, Energy, 2014, 77, 963–982 CrossRef CAS.
- C. Negin, S. Ali and Q. Xie, Most common surfactants employed in chemical enhanced oil recovery, Petroleum, 2017, 3, 197–211 CrossRef.
- B. Das, S. Gogoi and D. Mech, Micellar-polymer for enhanced oil recovery for Upper Assam Basin, Resour.-Effic. Technol., 2017, 3, 82–87 Search PubMed.
- M. S. Kamal, I. A. Hussein and A. S. Sultan, Review on surfactant flooding: phase behavior, retention, IFT, and field applications, Energy Fuels, 2017, 31, 7701–7720 CrossRef CAS.
- K. A. Elraies, I. Tan, M. Fathaddin and A. Abo-Jabal, Development of a new polymeric surfactant for chemical enhanced oil recovery, Pet. Sci. Technol., 2011, 29, 1521–1528 CrossRef CAS.
- G. J. Hirasaki, C. A. Miller and M. Puerto, Recent advances in surfactant EOR, in SPE Annual Technical Conference and Exhibition, Society of Petroleum Engineers, 2008 Search PubMed.
- K. C. Taylor and H. A. Nasr-El-Din, The effect of synthetic surfactants on the interfacial behaviour of crude oil/alkali/polymer systems, Colloids Surf., A, 1996, 108, 49–72 CrossRef CAS.
- P. Raffa, A. A. Broekhuis and F. Picchioni, Polymeric surfactants for enhanced oil recovery: A review, J. Pet. Sci. Eng., 2016, 145, 723–733 CrossRef CAS.
- J. A. Ali, K. Kolo, A. K. Manshad and A. H. Mohammadi, Recent advances in application of nanotechnology in chemical enhanced oil recovery: Effects of nanoparticles on wettability alteration, interfacial tension reduction, and flooding, Egypt. J. Pet., 2018, 27, 1371–1383 CrossRef.
- W. Y. Fei and Z. F. Lin, The salt tolerance of nonionic anionic surfactants, Oilfield Chem., 1999, 4 Search PubMed.
- M. Pordel Shahri, S. Shadizadeh and M. Jamialahmadi, A new type of surfactant for enhanced oil recovery, Pet. Sci. Technol., 2012, 30, 585–593 CrossRef CAS.
- N. A. Abalkhail, P. J. Liyanage, K. A. Upamali, G. A. Pope and K. K. Mohanty, ASP Flood Application for a High-Temperature, High-Salinity Carbonate Reservoir, in SPE Middle East Oil and Gas Show and Conference, Society of Petroleum Engineers, 2019 Search PubMed.
- L. Shi, H.-M. Ge, S.-H. Tan, H.-Q. Li, Y.-C. Song and H.-L. Zhu, et al., Synthesis and antimicrobial activities of Schiff bases derived from 5-chloro-salicylaldehyde, Eur. J. Med. Chem., 2007, 42, 558–564 CrossRef CAS.
- A. Pui and J.-P. Mahy, Synthesis, characterization and catalytic activity of halo-methyl-bis(salicylaldehyde)ethylenediamine cobalt(II) complexes, Polyhedron, 2007, 26, 3143–3152 CrossRef CAS.
- A. A. Aboulrous, T. Mahmoud, A. M. Alsabagh and M. I. Abdou, Application of Natural Polymers in Engineering, in Natural Polymers, ed. O. Olatunji, Springer, Cham, 2016 Search PubMed.
- N. A. Samak, T. Mahmoud, A. A. Aboulrous, M. M. Abdelhamid and J. Xing, Enhanced Biosurfactant Production Using Developed Fed-Batch Fermentation for Effective Heavy Crude Oil Recovery, Energy Fuels, 2020, 34(11), 14560–14572 CrossRef CAS.
- J. J. Sheng, Modern chemical enhanced oil recovery: theory and practice, Gulf Professional Publishing, 2010 Search PubMed.
- H. Vatanparast, A. Alizadeh, A. Bahramian and H. Bazdar, Wettability alteration of low - permeable carbonate reservoir rocks in presence of mixed ionic surfactants, Pet. Sci. Technol., 2011, 29, 1873–1884 CrossRef CAS.
- G. Sharma and K. Mohanty, Wettability alteration in high -temperature and high -salinity carbonate reservoirs, SPE J., 2013, 18, 646–655 CrossRef.
- L. Wang, Y. Zhang, L. Ding, J. Liu, B. Zhao, Q. Deng and T. Yan, Synthesis and physiochemical properties of novel gemini surfactants with phenyl-1,4-bis(carbamoylmethyl) spacer, RSC Adv., 2015, 5, 74764–74773 RSC.
Footnote |
| † Electronic supplementary information (ESI) available. See DOI: 10.1039/d0ra09502h |
| This journal is © The Royal Society of Chemistry 2021 |