
 Open Access Article
 This Open Access Article is licensed under a Creative Commons Attribution-Non Commercial 3.0 Unported Licence
Prediction of emulsification behaviour of pea and faba bean protein concentrates and isolates from structure–functionality analysis†
Fatemeh Keivaninahra,
Pravin Gadkaria,
Khaled Zoroufchi Benisb,
Mehmet Tulbekc and
Supratim Ghosh *a
*a
aDepartment of Food and Bioproduct Sciences, College of Agriculture and Bioresources, University of Saskatchewan, 51 Campus Drive, Saskatoon, S7N 5A8, SK, Canada. E-mail: supratim.ghosh@usask.ca
bDepartment of Chemical and Biological Engineering, University of Saskatchewan, Saskatoon, SK, Canada
cAGT Foods, Saskatoon, Saskatchewan, Canada
First published on 25th March 2021
Abstract
The effects of different extraction methods on the structure–functionality and emulsification behaviour of pea and faba bean protein isolates, and concentrates were studied at pH 7 and 2, and a regression model was developed to predict emulsion characteristics based on protein properties. The concentrates produced by air classification had lower protein content but higher solubility in water compared to the isolates produced by isoelectric precipitation. The protein secondary structure did not show a consistent difference; however, much higher intrinsic fluorescence was observed for the soluble compared to the insoluble fractions. Interfacial tension of all faba proteins was lower than pea, while there was no significant difference between the concentrates and isolates. The higher protein content of the isolates was found to improve their water holding capacity. Canola oil (40 wt%)-in-water coarse emulsions, prepared with 2 wt% proteins and 0.25 wt% xanthan gum showed smaller particle size at pH 7 than pH 2, while the zeta potential, viscosity and gel strength were higher at pH 7. Emulsions stabilized with concentrates were better or comparable to the isolates in terms of particle size, zeta potential, and microstructure. The regression model predicted that an increase in solubility, intrinsic fluorescence, water and oil holding capacities are more favourable to decrease emulsion particle size, while an increase in solubility, intrinsic fluorescence would lead to higher emulsion destabilization. A decrease in interfacial tension was more favourable to lower destabilization. Emulsion viscosity was more dependent on water holding capacity compared to any other factor. Such models could be extremely beneficial for the food industry to modulate processing for the development of desired pulse protein ingredients.
1. Introduction
Plant proteins are gaining more interest, across the globe, due to their wide range of applications in plant-based food systems.1,2 In the food industry, plant proteins are used to replace animal proteins to meet consumer demand, improve nutritional quality, and maintain similar functionality and sensory characteristics (i.e. texture, flavour, and colour).3 Protein concentrates and isolates from soybean and wheat are widely used in the food industry. However, dry legumes or pulses, as a critical and inexpensive product, are fast emerging as a popular source of plant proteins in food.4 Pulses are rich in proteins, starch, fibre, vitamins and minerals. In recent years, they are being considered as alternative protein sources to replace animal and soybean proteins due to their higher protein content, lower cost, lower allergenicity and wider acceptability.5Numerous methods for the extraction of proteins from pulse flours are being studied to optimize the quantity while maximizing the quality.6–8 In general, protein extraction processes can be classified into dry and wet methods.1 In the dry processing, the flour is finely milled, and then the large starch granules are separated from the smaller protein-rich particles by air classification based on size, shape and density.9 For complete separation of protein that still adheres to the starch granules, a second milling step is also used, which may increase the presence of damaged starch. The major advantages of dry processing are maintaining the functionality of native protein, lower energy and water use. However, the products of dry processing, the protein concentrates, are usually lower in protein content (up to 50–60% protein).10 In wet processing, two of the most commonly used methods are acid/alkali extraction–isoelectric precipitation and salt extraction (SE).8 The process of acid/alkali extraction–isoelectric precipitation starts by solubilizing pulse flour under alkaline or acidic conditions followed by centrifugation to separate the soluble protein fraction.11 Then, the protein is precipitated by adjusting the pH to its isoelectric point (pI) and separated from the rest of the solution.12 Finally, the precipitated protein is re-solubilized by adjusting to pH 7 and dried.13 The final protein isolates are rich in purity (usually 80–90% protein), but the major drawback is the loss of the native functionality of the proteins.10 In the SE, proteins are extracted by the salting-out process, which leads to protein separation followed by de-salting using micellization or dialysis and recovery of the protein isolate via precipitation and drying.1,14 The behaviour of proteins in food is affected by their structure, conformation, physicochemical properties and interaction with other food components and the nature of the environment.15,16 These properties, in turn, depends on the processing methods used during protein extraction; hence, the behaviour of a pulse protein in food would largely depend on the choice of ingredients, concentrates or isolates. For example, a lower protein content, higher protein solubility, foaming capacity and gelling ability of the dry-fractionated faba bean protein (FBP) compared to the isolate produced by acid/alkali extraction–isoelectric precipitation was observed.17 Karaca et al.6 found that the isoelectric-precipitated chickpea and lentil protein isolates had higher surface charges and formed emulsions with smaller droplet size than the SE isolates. Emulsification is one of the most critical functionalities of food proteins. During emulsification, proteins stabilize dispersed oil droplets by lowering the interfacial tension (IT), covering the droplets with a protein layer and preventing coalescence by forming a strong viscoelastic membrane.18 The carbohydrates present in the protein concentrate, or isolates, remain dispersed in the continuous phase and act as a viscosity enhancer and bulky barriers between the oil droplets, preventing emulsion destabilization.19 Moreover, the excess unabsorbed biopolymers may also act as depletant and induce depletion flocculation in beverage emulsions.20
These functionalities of proteins might also be affected by the exposure to severe environmental conditions during food processing (such as thermal treatment, the addition of salt, extreme pH conditions, organic solvents and surfactants) that can change their structure, leading to protein denaturation.21 The thermal treatment has been used to improve functionality by resolving the “beany flavour” problem of faba bean by inactivating the peroxidase and lipoxygenase.22 However, a progressive decrease in oil emulsification was observed by heating pea protein concentrate (PPC).23 Pressure or thermally induced unfolding of the 11S globulin Vicia faba protein led to the formation of emulsions with larger droplets than those made with the native protein.24 Protein aggregation of pea proteins (PP) was shown to increase by thermal treatment; however, emulsions were formed with higher protein adsorption and creaming stability than those formed with unheated proteins.25
In spite of such a wide range of research on plant proteins, there is a lack of studies that directly compared concentrates and isolates. Therefore, it is difficult for the food industry to clearly understand the advantages or disadvantages of the available protein ingredients. To address this challenge, we hypothesized that the various technologies involved in the preparation of protein rich ingredients could be directly responsible for the variation in their functional properties, such as interfacial and emulsification behaviour, which could be explained by their physicochemical properties. The overall aim of this study was to investigate the effects of different extraction methods on the structure–functionality relationship of PP and FBP isolates (PPI, FBPI) and concentrates (PPC, FBPC and de-flavoured concentrates) along with appropriate controls from whey protein isolate (WPI) and egg white protein (EWP). Another objective was to develop an empirical model to predict emulsion properties based on protein characteristics. Although there are a great number of functionality studies involving pulse proteins in the literature, rarely do they directly compare the effect of extraction method on protein properties as well as functionality as an emulsifier in stabilizing oil-in-water (O/W) emulsions. The empirical model developed in this study may also be useful in identifying the relationship between protein ingredients, their characteristics and behaviour in emulsion systems.
2. Material and methods
2.1. Materials
The faba bean protein concentrate (product code: FBP60), de-flavoured faba bean protein concentrate (DefFBP60), faba bean protein isolate (FBPI), pea protein concentrate (PP55), de-flavoured pea protein concentrate (DefPP55), pea protein isolate (PPI), whey protein isolate (WPI), and pasteurized egg white protein (EWP) were donated by AGT Food Ingredients, Saskatoon, SK, Canada. The protein concentrates were produced by dry milling and air classification technology. Then, the obtained concentrates were hydrothermally treated to produce de-flavoured concentrates according to proprietary processing technology. The protein isolates were produced by isoelectric precipitation technology. The WPI and EWP are standard conventional food emulsifiers widely used in the industry. Canola oil was purchased from a local supermarket at Saskatoon, SK, Canada. Milli-Q™ water (Millipore Corporation, Burlington, MA, USA) was used for the preparation of reagents for the protein assays and all other experiments. All acids and bases were obtained from Thermo Fisher (Edmonton, AB, Canada). All the other chemicals were purchased from Sigma Aldrich (Mississauga, ON, Canada).2.2. Proximate analysis of protein powders
The proximate analysis of protein powders was done using AOAC and AOCS methods as follows: moisture: AOAC 925.09, protein: AOAC 992.15, ash: AOAC 923.03, starch: AOAC 996.11 and crude fibre: AOCS Ba 6a-06. Fat content was determined by the EPA 9071B-hexane extraction method, and carbohydrate content was determined by calculation.2.3. Determination of protein solubility
For solubility, protein dispersions were prepared by dispersing 2 wt% of protein powders in deionized water and kept for stirring at 400 rpm overnight on a magnetic stirrer without pH adjustment and centrifuged at 6000 rpm for 30 min. The supernatant was separated and used for measuring the protein content according to the method used by.26 Freshly prepared biuret reagent was diluted eight times with 2.3% sodium bicarbonate, 4 ml of which was added to 1 ml of protein solution and held for 10 min at 25 °C. Next, 0.125 ml of 2 N Folin–Ciocalteu reagent was mixed, and the absorbance of the mixture was recorded immediately at 660 nm. Bovine serum albumin (BSA) was used as an internal standard for the protein content determination from the absorbance.27 The protein solubility (% S) was calculated by eqn (1).
 | (1) |
2.4. Preparation and characterization of both soluble and insoluble fractions
2.5. Determination of protein powder functionality
σ = F/(L × cos![[thin space (1/6-em)]](https://www.rsc.org/images/entities/char_2009.gif) θ) θ)
| (2) |
2.6. Preparation of coarse emulsions using the protein powders and their characterization
 | (3) |
2.7. Modeling
 | (4) |
 | (5) |
Sensitivity analysis. The traditional and widely used one-factor-at-a-time (OFAT) approach38 was used to investigate the strength of the relationship between the input and output parameters. In the OFAT approach, the effect of one independent factor on the dependent factor is monitored at a time, while other independent factors are fixed. The developed models using EPR were used to conduct OFAT analysis. The analysis was conducted by step by step, increasing one variable from its minimum to maximum value, while the other variables were kept fixed at their baseline values. Then, the selected variable was returned to its baseline value, and this procedure was repeated for the other inputs variables. For example, the effect of IT on the emulsion oil droplet size was analyzed by increasing the value of IT from its minimum to maximum while other factors (WHC, OHC, IF, S) were held constant at their mean values. This procedure was repeated for WHC, OHC, IF, S to investigate their effects on emulsion oil droplet size.
2.8. Statistical analysis
All measurements were done with three replications, and the results are reported as the mean ± one standard deviation. The experimental data were subjected to a general linear model or one-way analysis of variance (ANOVA). Data analysis was done using Minitab 19. Tukey's test was used to compare the mean values at p < 0.05 significance level.3. Results and discussion
3.1. Effect of extraction method on structure–functional properties of faba bean and pea proteins
| Analysis (% w/w) | FBP60 | DefFBP60 | FBPI | PP55 | DefPP55 | PPI | WPI | EWP |
|---|---|---|---|---|---|---|---|---|
| a FBP60: faba bean protein concentrate, DefFBP60: de-flavoured faba bean protein concentrate, FBPI: faba bean protein isolate, PP55: pea protein concentrate, DefPP55: de-flavoured pea bean protein concentrate, PPI: pea protein isolate, WPI: whey protein isolate, and EWP: egg white proteins. | ||||||||
| Moisture | 6.2 | 4.8 | 3.9 | 6.8 | 4.6 | 5.4 | 6.7 | 6.4 |
| Protein | 57.6 | 60.5 | 87.0 | 51.4 | 50.5 | 80.6 | 86.8 | 83.5 |
| Lipid | 1.6 | 2.1 | 0.04 | 2.1 | 2.5 | 0.8 | 0.03 | 0.4 |
| Ash | 5.4 | 5.4 | 9.0 | 5.4 | 5.3 | 5.2 | 0.6 | 5.7 |
| Carbohydrates | 29.2 | 27.2 | n.d. | 34.3 | 37.1 | 8.0 | 5.8 | 4.0 |
| Total | 100 | 100 | 100 | 100 | 100 | 100 | 100 | 100 |
All pulse protein samples, except FBPI, had 5.2–5.4% ash. This was in agreement with Shand et al.,41 who reported 5–5.9% ash in native and commercial PPI. FBPI had 9.0% ash, which can be due to its extraction by isoelectric precipitation, where the addition of alkali or acids could lead to the formation of salts and an increase in ash content. The lower ash content of PPI compared to FBPI might be due to the origin of proteins. The ash content of WPI was 0.6%, which was the lowest among all samples, and EWP had a slightly higher amount of ash (5.7%) than most of the pulse proteins. Among the pulse proteins, FBPI did not show the detectable amount of carbohydrates, and PPI had only 8%; however, the concentrates, PP55 and FBP60, had 34.3 and 29.2% of carbohydrates, respectively. The higher carbohydrate content of protein concentrates is well known, and it was due to the poor separation between the proteins and the carbohydrates by the dry fractionation process.
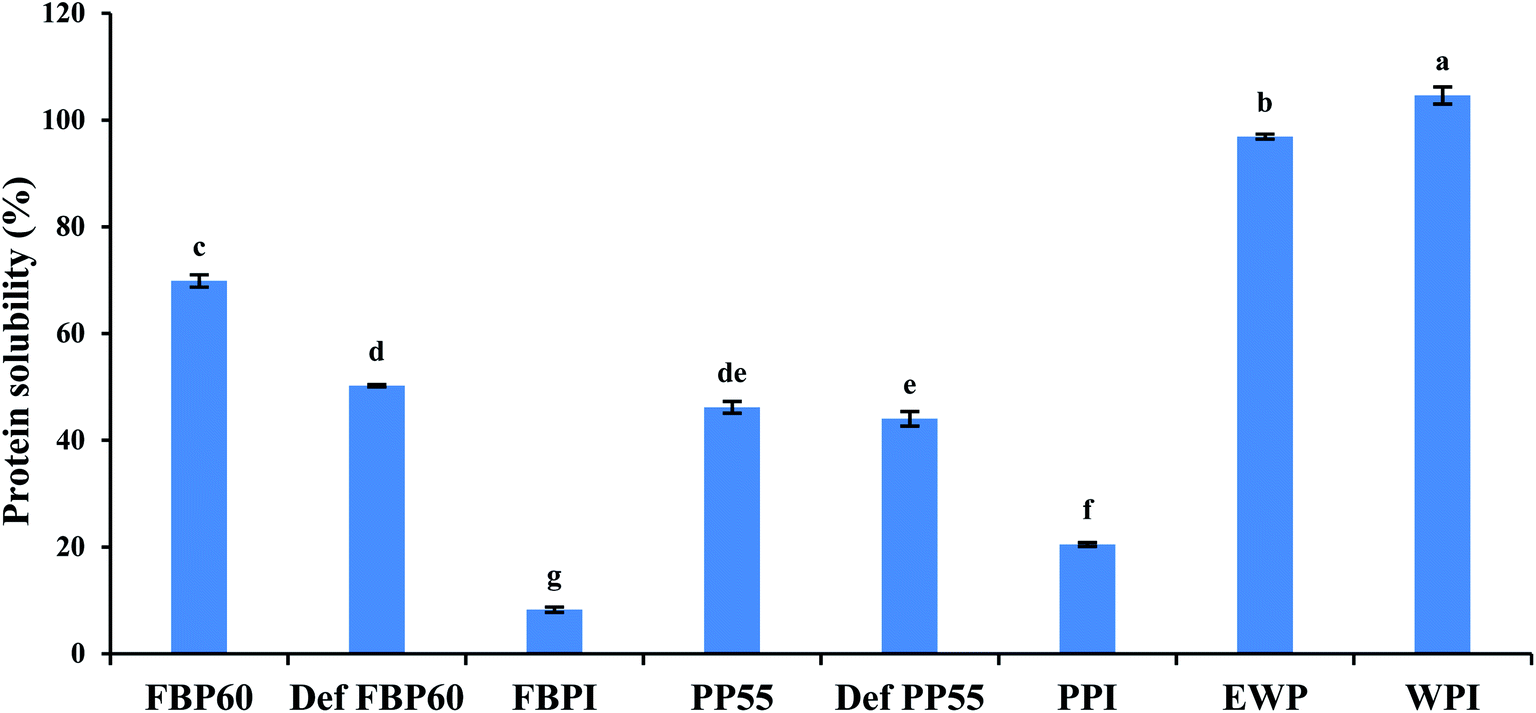 | ||
| Fig. 1 Percent solubility of 2 wt% dispersions of different commercial pulse proteins samples in comparison with WPI and EWP. Means that do not share a letter are significantly different by Tukey's test at p < 0.05 significance level. See Table 1 for sample identification. | ||
3.2. Characterization of soluble and insoluble fractions
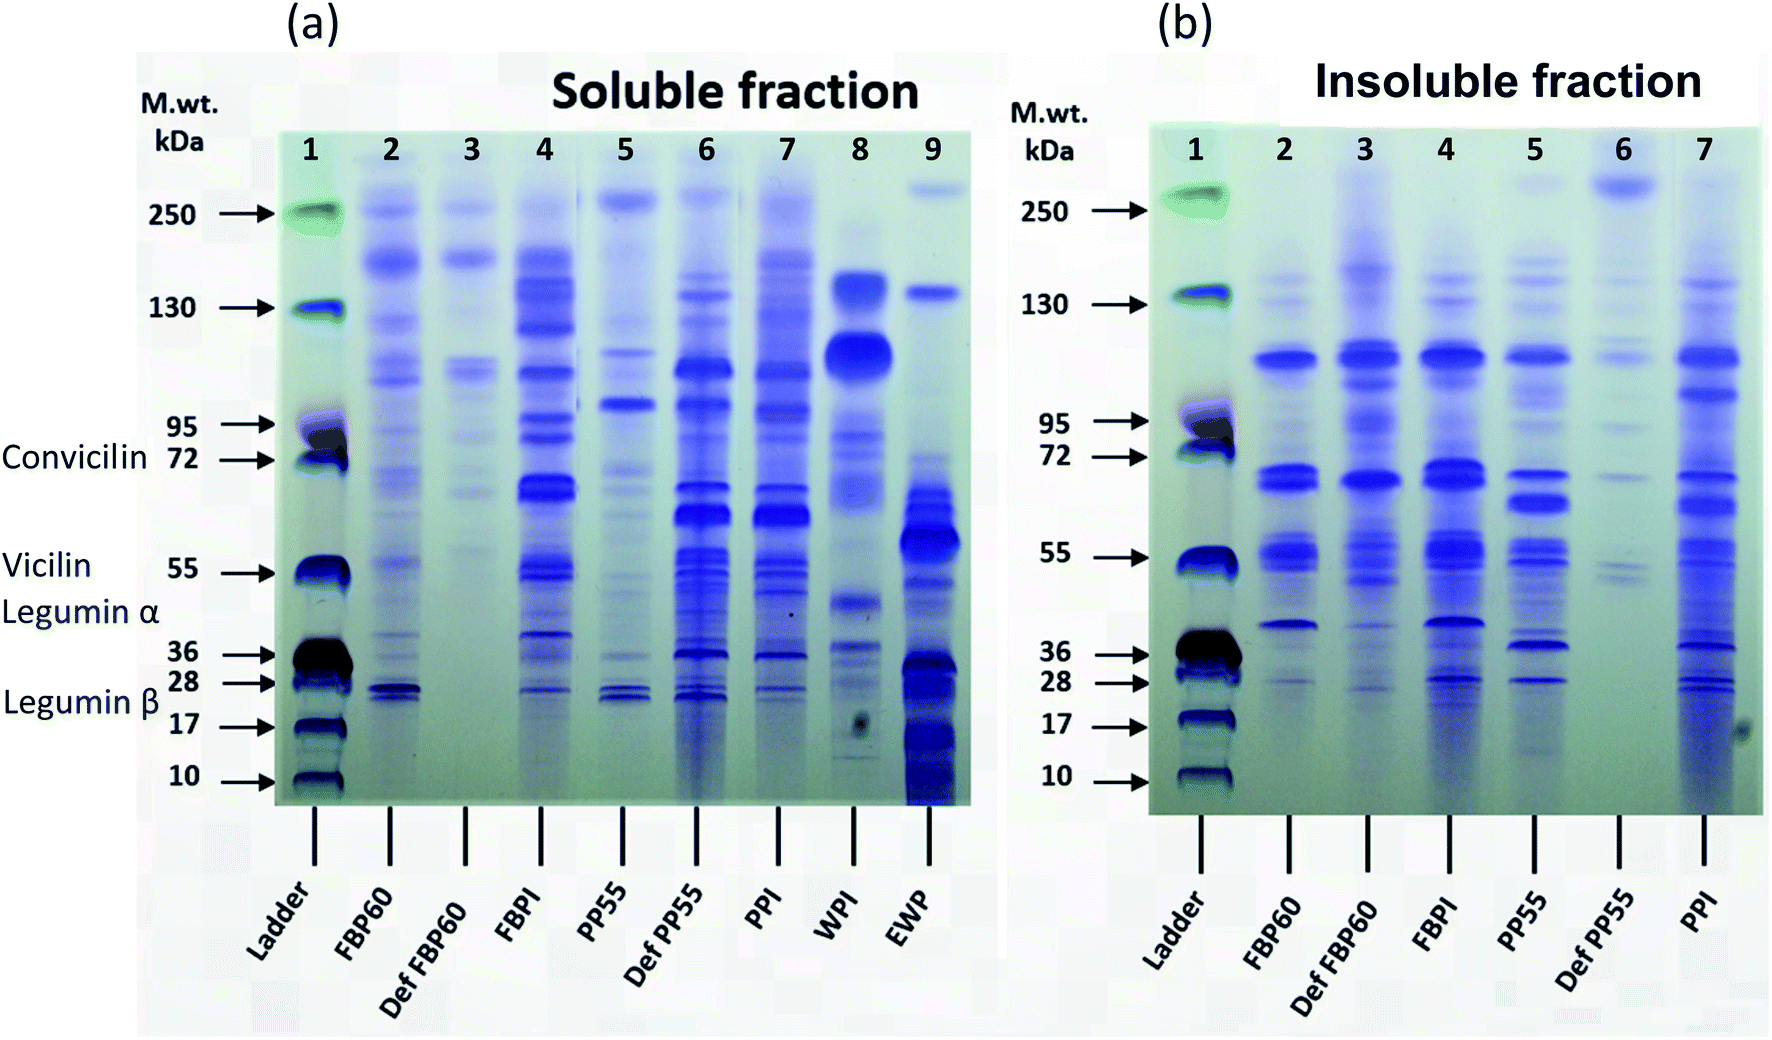 | ||
| Fig. 2 (a) Soluble and (b) insoluble protein composition of different commercial protein samples by SDS-PAGE. The bands in lane 1 show the molecular weight of (MW) marker, ranging from 10 to 250 kDa. Lanes 2–4 in both (a) and (b) show results for different faba bean protein samples and lanes 5–7 for the pea protein samples. WPI and EWP (lanes 8 and 9, respectively) are only present in soluble fractions as they were completely soluble. | ||
Both pea and faba bean showed high molecular weight proteins in the soluble fraction, probably due to the presence of polypeptide aggregates. For both the faba (FBP60) and pea concentrates (PP55), the soluble fraction had more faint bands at around 28 kDa, over 95 kDa and 250 kDa than the insoluble fraction; however, the intensity of the bands at ∼40, 55, ∼70, and 100 kDa was much higher in the insoluble fraction. For the de-flavoured samples, a large difference can be seen between FBP and PP. The soluble fraction of DefFBP60 showed only a few faint bands higher than 95 kDa, but the insoluble fraction had higher intensity bands with a pattern similar to the insoluble fraction of FBP60, which indicates that the hydrothermal processing used for de-flavouring made the sample richer in insoluble fractions. In the case of DefPP55, however, several bands were observed (17–130 kDa) for the soluble fraction, while the insoluble fraction showed only a few weak bands. FBPI showed similar bands for MW of <72 for soluble and insoluble fractions but for higher MW bands (>95 kDa), the soluble fraction had a range of polypeptides up until 250 kDa, while the insoluble fraction showed a strong band at around 110 kDa and a few minor ones beyond 130 kDa. PPI, on the other hand, had almost the same pattern for both fractions.
DefFBP60 did not have any low molecular weight proteins in the soluble fraction, which can be caused by heating, while the opposite was true for DefPP55. Sorghum proteins were shown to have less intense bands in the cooked samples than the uncooked ones.46 The authors suggested that his effect can be related to the decrease of extractability or formation of high molecular weight aggregates. In another study on the effect of high-temperature extrusion on the SDS-PAGE pattern of navy and pinto bean proteins, unlike albumin fractions (>40 kDa), extrusion temperature of 110 °C did not change the SDS-PAGE patterns of globulins. However, higher temperatures (135 and 150 °C) led to decreased intensity and disappearance of bands in the high MW region for both fractions, which was explained by their depolymerization during extrusion.47
Among the FBPs, the intensity of bands in both fractions was higher in FBPI than FBP60 and DefFBP60, which can be due to the higher protein content of the former. For PPs, among the soluble fractions, DefPP55 and PPI had similar patterns, but PP55 showed less intense bands. Among the insoluble fraction, PP55 and PPI had a similar pattern; however, DefPP55 showed bands with much lower intensity. PPI in both fractions had more intense bands than the two other PP types, which could be due to its higher protein content.
In almost all of the samples, inter-molecular aggregates (A1) were the most dominant secondary structure, followed by a β-sheet and random coil (Fig. 3). Intramolecular hydrogen bonds are the weakest, which could be the reason behind the lower α-helix compared to the β-sheet. The alkaline condition used for PPI and FBPI production decreased β-sheet and RC except for the insoluble fraction of PPI. Similarly, Law et al.48 observed a decrease in the α-helix and β-sheet content of Dolichos lablab vicilins in extreme alkaline conditions.48 Both the soluble and insoluble fractions of hydrothermally treated DefFBP60 showed significantly higher random coil and β-sheet structure and significantly lower inter-molecular aggregates compared to the other two FBP samples. Reorganization of the protein secondary structure was also observed after the heating of protein isolate of kidney bean.49 Between the soluble and insoluble fractions of FBP, the only difference in secondary structure could be seen in β-sheet and inter-molecular aggregates, which was lower in the soluble fractions compared to the insoluble fractions. Among the three different pea samples, almost no difference in secondary structure could be seen in the insoluble fractions. In the soluble PP, the de-flavoured sample had more β-turn and less α-helix compared to the other two, and the isolate had significantly higher inter-molecular aggregates. Between the soluble and insoluble fractions of PP, soluble fractions had more inter-molecular aggregates and random coils in both the concentrates and lower α-helix in the de-flavoured concentrate. For isolates, there was no significant difference between the soluble and insoluble fractions.
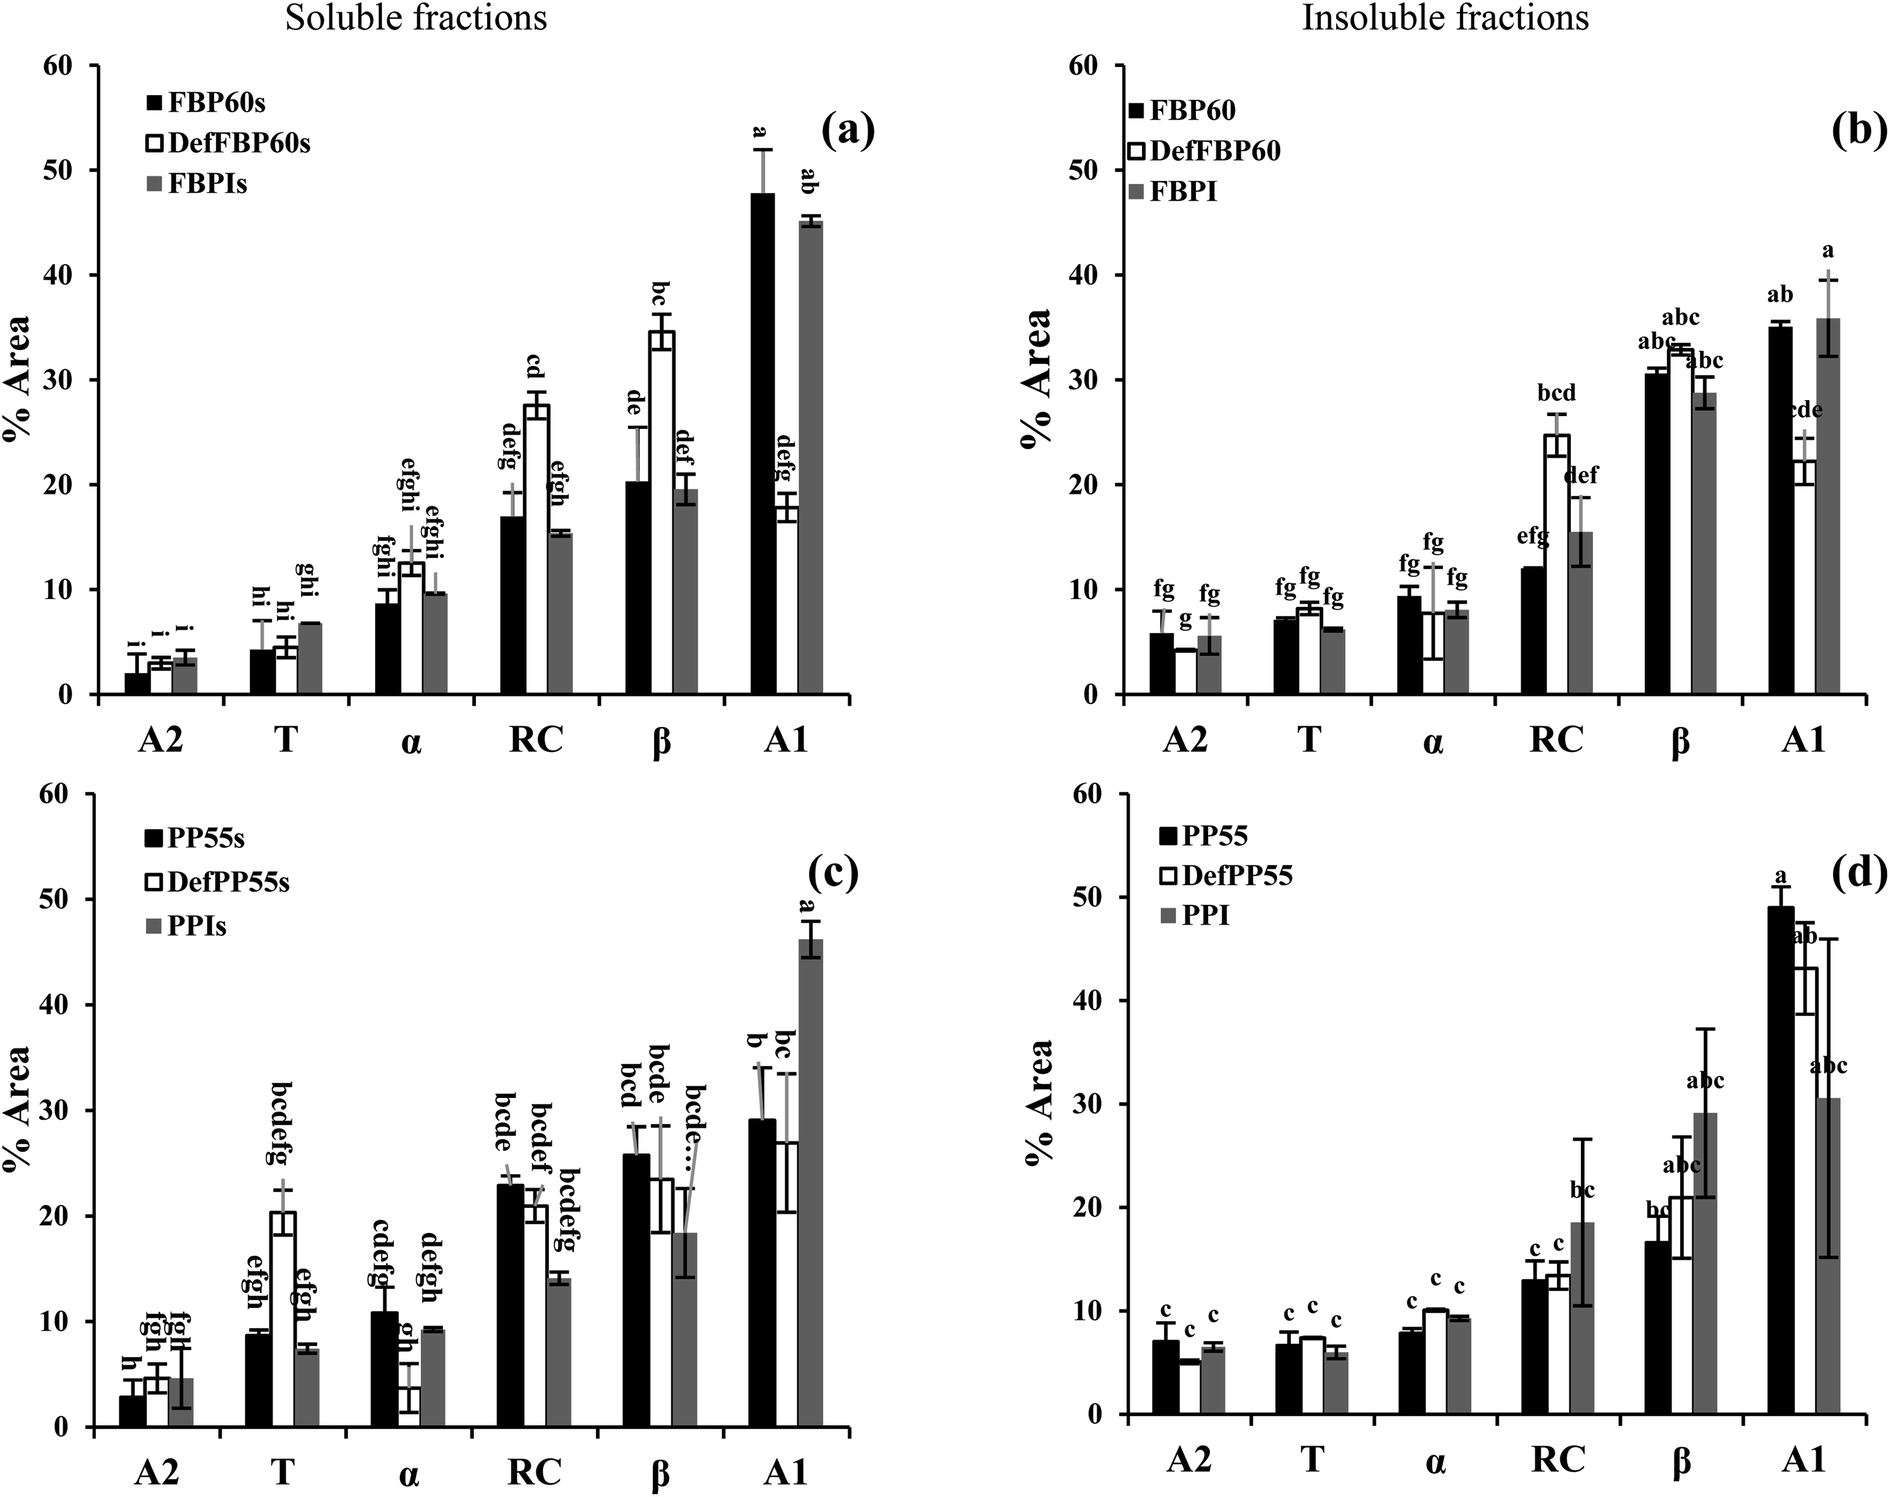 | ||
| Fig. 3 Contribution from different secondary structure components of different commercial pulse proteins samples using FTIR. Faba bean proteins ((a) soluble and (b) insoluble fraction), pea proteins ((c) soluble and (d) insoluble fraction). A2: intra-molecular aggregate, T: beta-turn, α: alfa-helix, RC: random coil, β: beta-sheet, and A1: inter-molecular aggregate. Means that do not share a letter are significantly different by Tukey's test at p < 0.05 significance level. See Table 1 for sample identification. | ||
We initially hypothesized that the soluble fractions could have fewer aggregates and β-sheet due to the predominant hydrophobic nature of these two structures and more random coils due to the possibility of better dispersion in the aqueous phase. Also, there could be differences in the secondary structure based on the different processing methods for the concentrates, de-flavoured concentrates and isolates. However, except for a few samples mentioned above, not much consistent difference in secondary structure can be seen among the various samples and their soluble and insoluble fractions. Therefore, the secondary structure of protein identified using FTIR cannot be used as a good indicator of their solubility and functionality. Perhaps, the tertiary structure of protein could be a better indicator.50
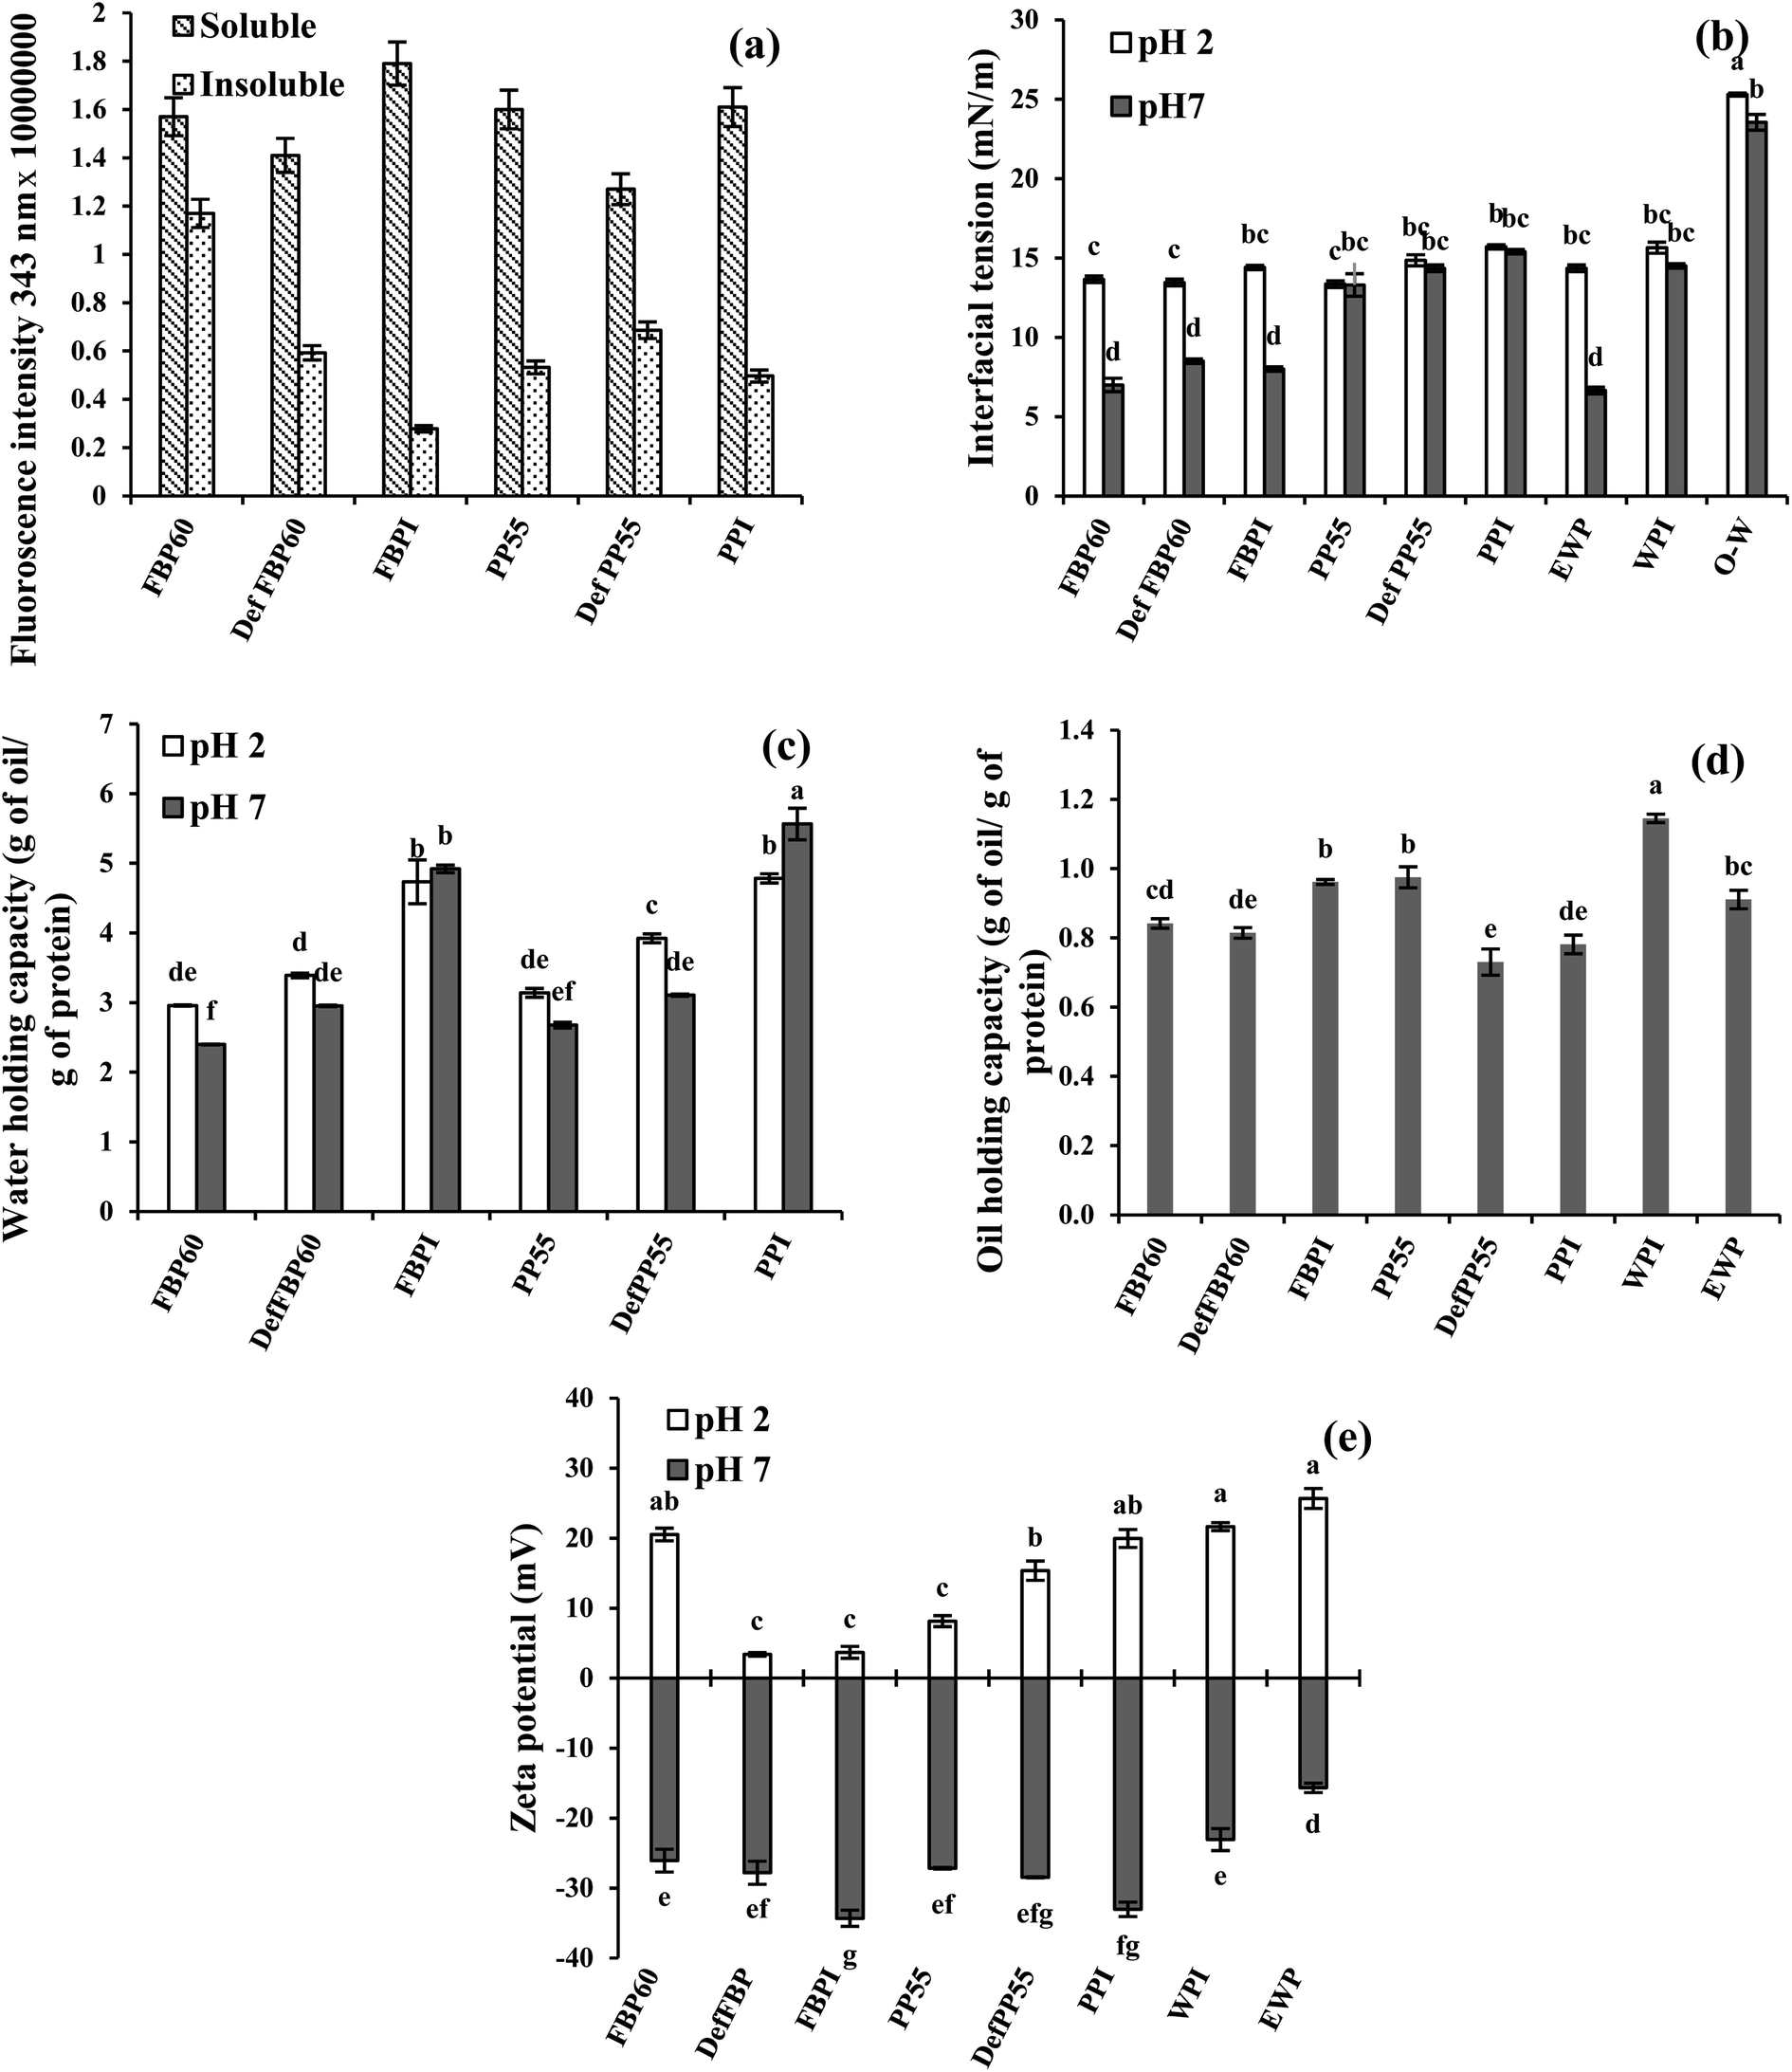 | ||
| Fig. 4 (a) Effect of processing conditions on intrinsic fluorescence of soluble and insoluble proteins fraction; (b) canola oil–water interfacial tension; (c) water holding capacities; (d) oil binding capacities; and (e) zeta potential of 2 wt% dispersions of various commercial pulse proteins samples at pH 2 and pH 7. Means that do not share a letter are significantly different by Tukey's test at p < 0.05 significance level. See Table 1 for sample identification. | ||
3.3. Determination of protein powder functionality
WHC can also be affected by protein conformational and environmental factors,55 and the processing used for protein extraction. Stone et al.8 reported that at pH 7, micellar precipitated (MP) PPI had higher WHC (3.2–3.6 g g−1) than alkali extraction-isoelectric precipitated (AE-IP), and SE-dialyzed PPI (2.4–2.6 and 0.34–2.6 g g−1, respectively). The higher WHC in MP PPI was ascribed to the higher exposure of polar groups and side-chain amino acids of proteins to water and the formation of more hydrogen bonds, while in AE-IP PPI, the protein structure was disturbed, leading to their lower ability to interact with water. In the present case, the WHC of the isolates (AE-IP) was highest among the various samples, and the values were higher than that reported by Stone et al.,8 which could be due to the difference in origin of the proteins samples and processing used for the extraction.
Among the various proteins, oil holding capacity (OHC) was highest for WPI (1.15 g oil per g of protein), followed by PP55, FBPI and EWP (0.97, 0.96 and 0.91 g g−1, respectively) (Fig. 4d). There was no particular trend in OHC of the pea and FBPs samples. For example, in FBPs, the isolate showed the highest OHC followed by similar values for concentrate and de-flavoured samples, while in PPs, concentrate showed the highest OHC, followed by similar values for de-flavoured and isolate samples. OHC of unheated PPC was reported to be 1.28 g g−1 (23). Stone et al.8 reported an OHC of 5.2–5.4 g g−1 for SE PPI, while AE-IP and MP showed lower values (3.5–3.8 g g−1 and 3.6–3.7 g g−1, respectively), which might be a result of different surface properties of the proteins. The researchers also obtained higher OHC for egg (2 g g−1) and whey proteins (1.4 g g−1) compared to the present study. OHC is a result of physical entrapment of oil in the protein structure; thus, it can be affected by protein type, concentration, charge, hydrophobicity, surface area and size of the protein.
At pH 2, PP showed a similar trend as pH 7 with the highest zeta potential for the isolate (+19.9 mV) followed by the de-flavoured sample and the concentrate. However, for FBPs at pH 2, the zeta potential was highest for the concentrate (+20.5 mV), while it was significantly lower for the isolate (+3.7 mV) and the de-flavoured samples (+3.4 mV). Such a low zeta potential for the FBPI at pH 2 is surprising, considering its higher protein content and highest zeta potential at pH 7. FBPI had the highest mineral content (ash 9.0%), which could lead to more charge screening due to increased solubility of the minerals at acidic pH and corresponding lowering of zeta potential. The zeta potential of the pulse proteins was similar or lower than EWP and WPI at pH 2, while at pH 7, for all pulse proteins, it was higher than EWP, while they are similar to WPI (Fig. 4e).
3.4. Preparation of coarse emulsions using the protein powders and their characterization
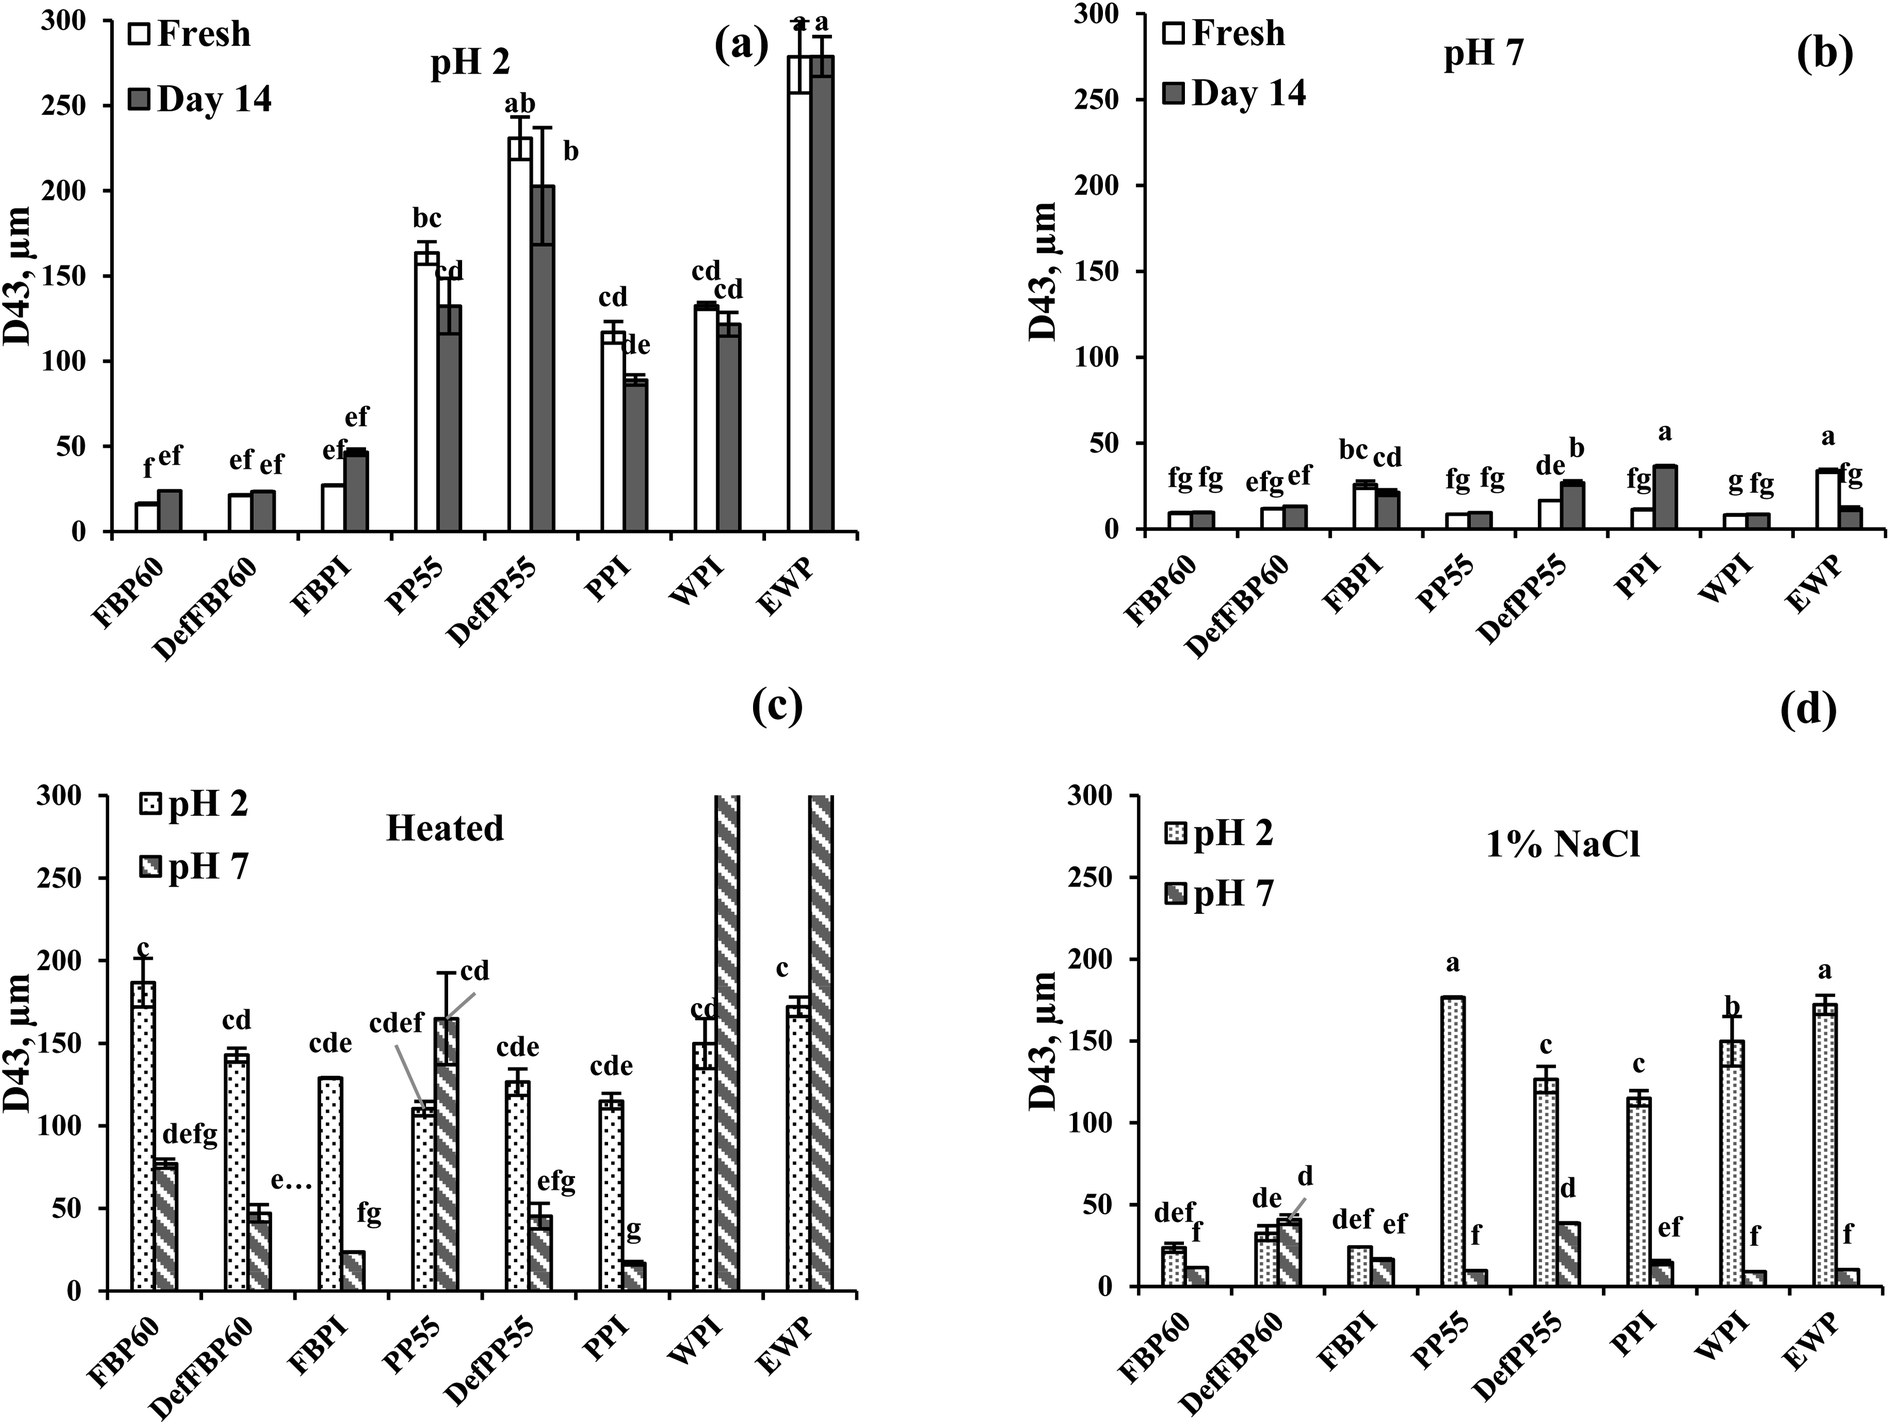 | ||
| Fig. 5 Volume average droplet size (D4,3) of emulsions prepared using different commercial pulse proteins samples. Droplet size of freshly prepared emulsions and as a function of storage time (day 7 and 14) is shown at (a) pH 2 and (b) pH 7. The effect of (c) heat treatment (90 °C for 30 min) and (d) the addition of 1 wt% salt on the average droplet size at pH 2 and pH 7 are also shown. Means that do not share a letter are significantly different by Tukey's test at p < 0.05 significance level. See Table 1 for sample identification. | ||
At pH 7, of all freshly prepared emulsions, WPI had the smallest (8.19 μm), while EWP had the highest (33.9 μm) average particle size. Among the pulse protein emulsions at pH 7, PP55 showed the smallest (8.6 μm), and FBPI showed the largest particle size (25.8 μm). For both FBP and PP, isolate-stabilized emulsions were formed with larger particle sizes compared to the concentrates or de-flavoured samples, although isolates had much protein content than the concentrates. This could be due to the denaturation of pulse proteins during isolate preparation leading to lower solubility (as shown in Fig. 1), which hindered the formation of smaller emulsion droplets and led to protein and oil droplet aggregation.
Effect of storage time. For all FBP samples, some increase in average particle size was observed after 14 days at pH 2, while at pH 7, no such change was observed upon storage (Fig. 5a and b). For PP at pH 2, no increase was observed; rather, some drop in average particle size was observed for PP55 and PPI, which could be attributed to the loss of large oil droplets due to emulsion destabilization. At pH 7, DefPP55 and PPI showed a noticeable increase in droplet size after 14 days, which can be due to droplet flocculation and protein aggregation, as also observed by Yerramilli et al.28 At pH 2, WPI and EWP emulsions showed no change upon storage, while at pH 7, only EWP showed a significant decrease in size after 14 days.
Effect of heat treatment. At pH 2, all samples except DefFBP60 and FBPI emulsions showed phase separation after heat treatment, leaving a clear aqueous phase at the bottom of the glass vials (Fig. 6a). In contrast, at pH 7, none of the samples showed phase separation after heating (Fig. 6a), indicating improved visual stability. Heat treatment led to a particle size increase in all the pulse protein-stabilized emulsions at pH 7, while at pH 2, except PP, similar behaviour was observed for all FBP samples (Fig. 5a vs. Fig. 5c). At pH 2, PPC55 and DefPP55 had smaller droplet size after heating, which could be due to the loss of very large oil droplets in the emulsions before heating. For PPI emulsion at pH 2, no change was observed upon heating. Partial destabilization of heated emulsions could be attributed to heat-induced protein denaturation leading to further aggregation in oil droplets and protein aggregates. Among the different samples from the same proteins, heat treatment led to a decreased particle size (probably due to loss of large oil droplets) from concentrate to isolate, except PP emulsions at pH 2. WPI and EWP emulsions showed no increase when heated at pH 2; however, a considerable size increase was observed from about 8.2 to 380 μm for WPI and from about 10 to 827 μm for EWP after heating at pH 7. This could be due to the heat-induced protein denaturation and related aggregation, which were more pronounced for WPI and EWP compared to pulse proteins. An increase in droplet size of 10 wt% algae O/W emulsions (pH 7) stabilized by FBP and PP was observed as the temperature was increased from 20 to 90 °C.60
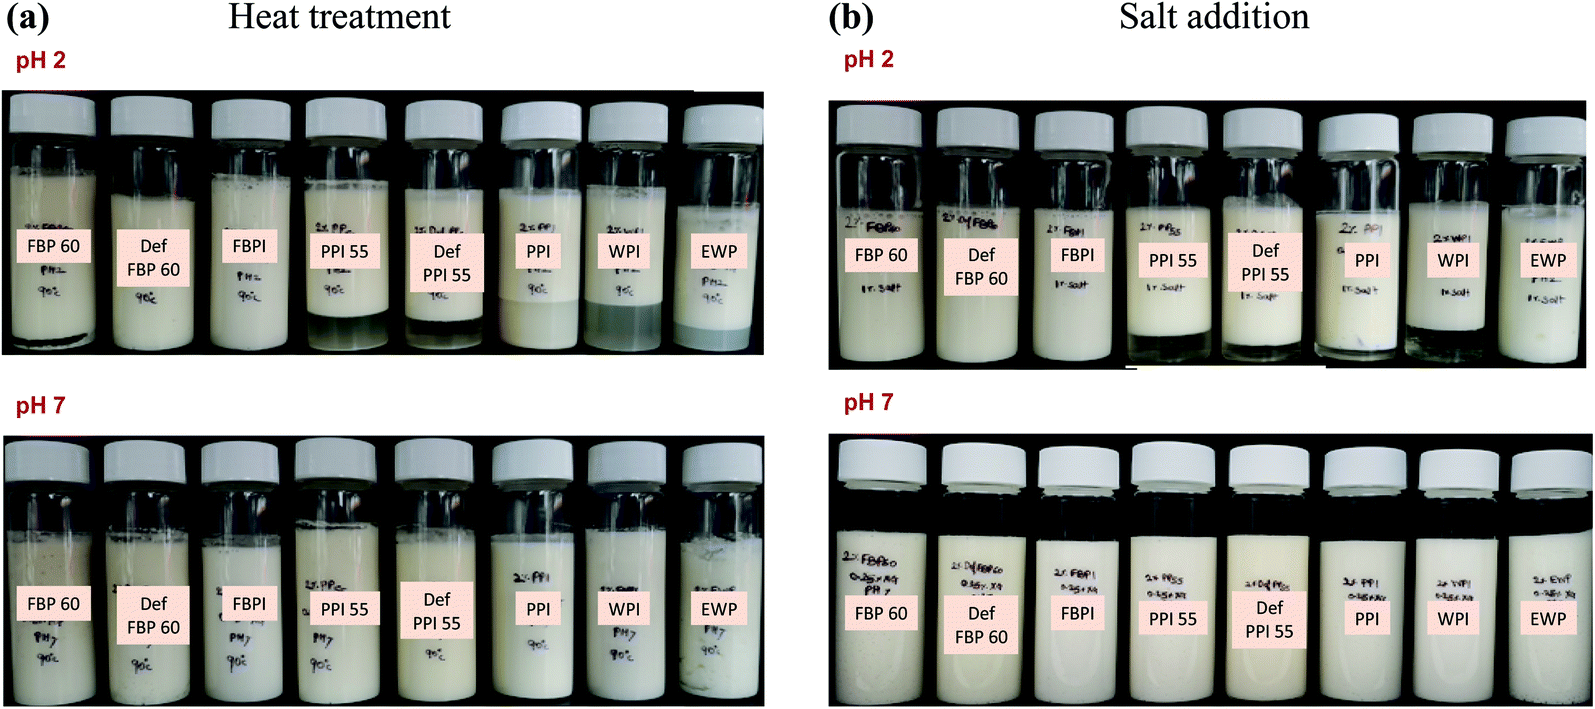 | ||
| Fig. 6 Effect of (a) heat treatment (90 °C for 30 min), and (b) 1 wt% salt addition on the visual appearance of various commercial protein-stabilized emulsions at pH 2 and pH 7. See Table 1 for sample identification. | ||
Effect of salt. At pH 2, the addition of 1% NaCl led to visual phase separation in emulsions stabilized by all PP and WPI emulsions (Fig. 6b), which is in accordance with their larger particle size (Fig. 5d). For FBP emulsions, no separation was observed upon salt addition at pH 2, and the emulsion particle size also did not show any significant increase compared to the fresh ones (Fig. 5a vs. Fig. 5d). Salt addition also caused a significant particle size decrease in EWP emulsion at pH 2 (Fig. 5d), but no phase separation was observed (Fig. 6a). At pH 7, no phase separation was observed in any emulsions (Fig. 6b); however, an increase in particle size was observed for DefFBP60, DefPP55 and PPI-stabilized emulsions after salt addition. The particle size of all other emulsions at pH 7 remained stable even after salt addition (Fig. 5d). The addition of salt induces electrostatic charge screening, leading to droplet aggregation. However, a strong protein layer around the droplets may provide steric stabilization, which could prevent salt-induced droplet aggregation.61 Moreover, excessing droplet aggregation due to the presence of salt may also lead to apparent stabilization of emulsion by creating a network of droplet aggregates that could prevent phase separation. For FBPs, emulsion stability was not affected by 1 wt% salt irrespective of pH, which could be important for its application in food. A similar increase in mean particle size was observed for soy protein isolate-stabilized emulsions at an intermediate ionic strength (100 mM NaCl).62 However, the authors noted increased emulsion stability at a higher salt concentration (400 mM NaCl), which was ascribed to the salting-in effect of proteins. Our salt concentration was around 160 mM, which probably would not provide a salting-in effect, but depending on the aggregate size, phase separation could be prevented. The influence of pH and NaCl on the structure of globulin protein was studied by Castellani et al.63 Their results showed that the protein was stable at pH 5 to 9 but by decreasing pH below 5 was rapidly unfolded, which could lead to aggregation of protein coated droplets. The author also proposed that increase in NaCl concentration above 100 mM increased the protein denaturation temperature and enthalpy, thereby making the protein more stable. In the present case, such increase in protein stability in the presence of salt could also be responsible for emulsion stability.
Effect of pH. Similar to the proteins in Fig. 4, most emulsions carried a positive zeta potential at pH 2, which is lower than the isoelectric point (pI) of the proteins (Fig. 7a). This is also in accordance with other studies on legume proteins.60 The only exception to this was the emulsion stabilized by FBPI, which had a slight negative zeta potential (−4.9 ± 0.6 mV). For all other emulsions, droplet charge varied from −28.9 ± 1.8 (for WPI) to −36.1 ± 3.1 mV (for PP55). The different behaviour of FBPI can be related to its ash content, which was almost two times more than other samples (Table 1). The presence of a high concentration of mineral salts can lead to salt-induced charge screening and a drop in zeta potential, which could even lead to charge reversal due to the salting-in effect.62 At pH 7 (higher than pI) all emulsions carried a high negative zeta potential ranged from −48.1 ± 0.5 (EWP) to −68.7 ± 2.0 mV (FBPI) (Fig. 7b). Higher zeta potential provides more electrostatic repulsive force and, consequently, more emulsion stability. This agrees with the results of droplet size measurement where at pH 7, with greater zeta potential, smaller particles were obtained compared to pH 2 (Fig. 5a). Interestingly, the zeta potential of emulsions was much higher compared to the corresponding protein dispersions, as reported in Fig. 4e. For example, the zeta potential of all pulse proteins stabilized emulsions at pH 7 increased from around −30 mv for protein dispersion to more than −60 mV for emulsions. Also, at pH 2, the zeta potential of protein dispersions was <26 mV, but emulsions showed >28 mV. Such an increase in zeta potential upon proteins' adsorption at the oil droplet surface has been reported by others and was attributed to surface denaturation of proteins leading to more exposure of the ionic groups towards the aqueous phase.64 After 14 days of storage, the zeta potential of all emulsions at pH 2 and 7 stayed unchanged (Fig. 7a and b).
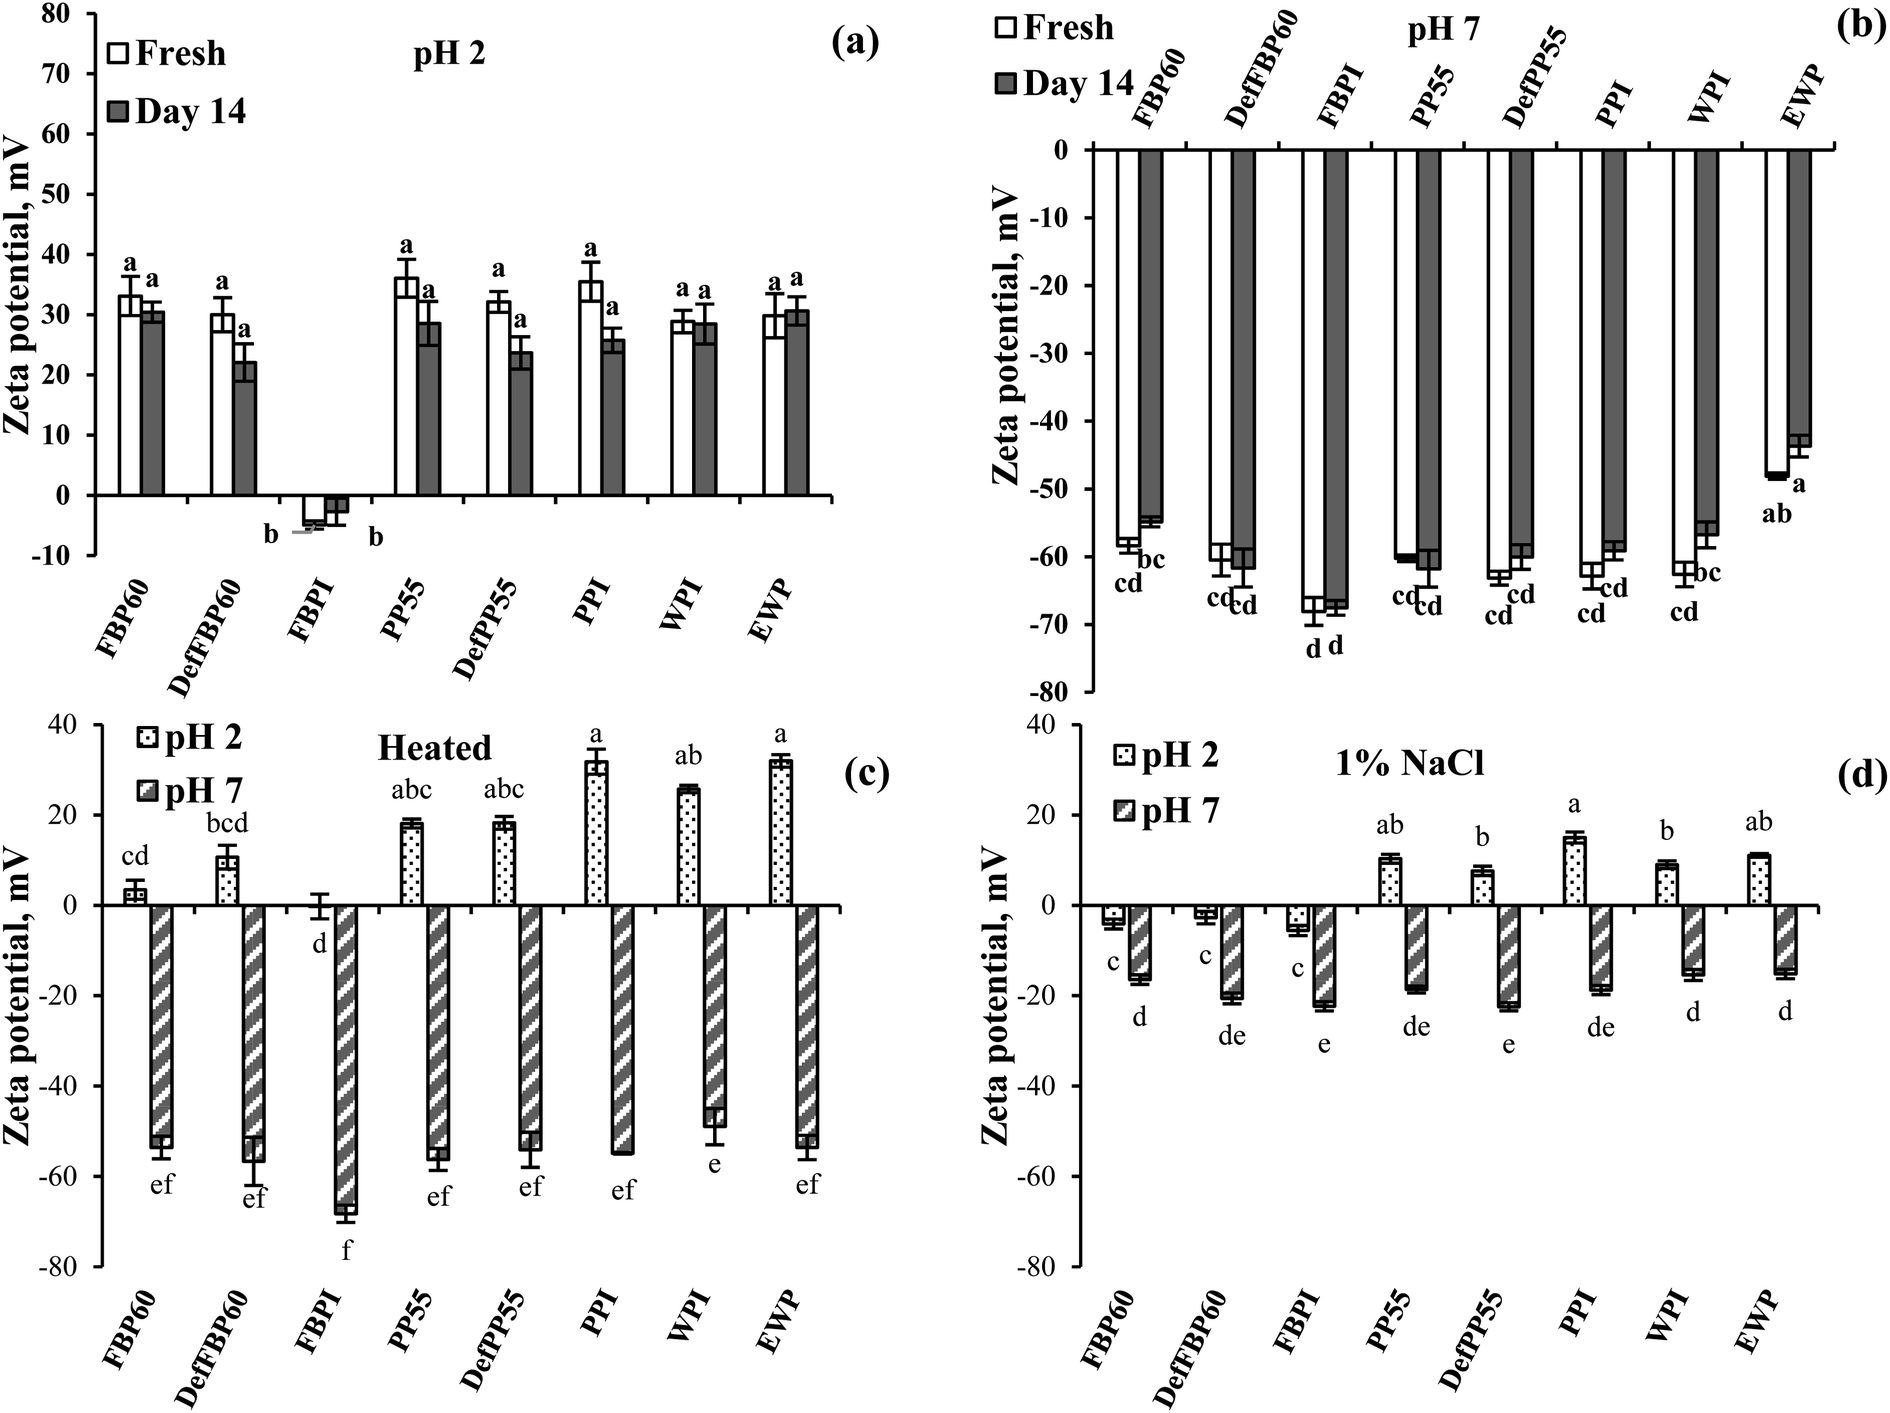 | ||
| Fig. 7 Effect of storage time on zeta potential of emulsions prepared using various commercial protein samples (a) at pH 2 and (b) at pH 7, (c) effect of heat treatment (90 °C for 30 min) and (d) effect of 1 wt% salt addition as a function of pH. Means that do not share a letter are significantly different by Tukey's test at p < 0.05 significance level. See Table 1 for sample identification. | ||
Effect of heat treatment. For most of the pulse protein-stabilized emulsions, heat treatment showed a decrease in zeta potential, which could be attributed to heat-induced protein denaturation leading to protein and oil droplet aggregation (Fig. 7c). A more substantial drop in emulsion zeta potential was observed at pH 2 compared to pH 7, which shows that the proteins were more susceptible to denaturation under acidic conditions. The most significant drop in zeta potential was observed for FBP60 and DefFBP60 at pH 2, followed by PP55 and DefPP55. For FBPI emulsion at pH 2, zeta potential reached zero from −4.9 mV after the heat treatment. PPI, on the other hand, showed a minimum decrease in emulsion zeta potential compared to the untreated samples at pH 2. WPI showed a slight decrease, while EWP showed an insignificant increase in emulsion zeta potential upon heating. At pH 7, FBP-stabilized emulsions did not show a significant change in zeta potential before and after heat treatment. PP and WPI-stabilized emulsions, however, showed a slight decrease in zeta potential, while EWP showed an increase in zeta potential upon heat treatment. In accordance to our results, Gumus et al.60 also reported a decrease in the magnitude of the zeta potential of PP and FBP-stabilized emulsions by heating above the thermal denaturation temperature of proteins and proposed that conformational changes in proteins upon heating changed the exposure of charged groups or the number of bound counter-ions.
Effect of salt. As expected, in all emulsions, salt addition caused a dramatic decrease in zeta potential due to the charge screening effect (Fig. 7d). Similar to heat treatment, a more significant drop in zeta potential was observed at pH 2 compared to pH 7. For example, at pH 2, salt addition decreased the zeta potential for PP, WPI and EWP emulsions from nearly 30 mV to 7–15 mV. For FBP60 and DefFBP60-stabilized emulsions at pH 2, salt addition even changed zeta potential from high positive to very low negative values (−2.7 to −5.6 mV). However, these low values of zeta potential at pH 2 did not show a significant increase in emulsion aggregate size, which could be attributed to the steric stabilization effect, as discussed above. At pH 7, the zeta potential of emulsions dropped to around −20 mV from −60 to −70 mV before salt addition; however, −20 mV was enough to keep the droplets from aggregation, such that the emulsions remained stable without any significant increase in particle size or change in visual observation. Similar to our data, the addition of NaCl (500 mM) to PP and FBP-stabilized emulsions at pH 7 was also reported to decrease the magnitude of zeta potential from −18 and −17 mV to −8 mV, respectively.60
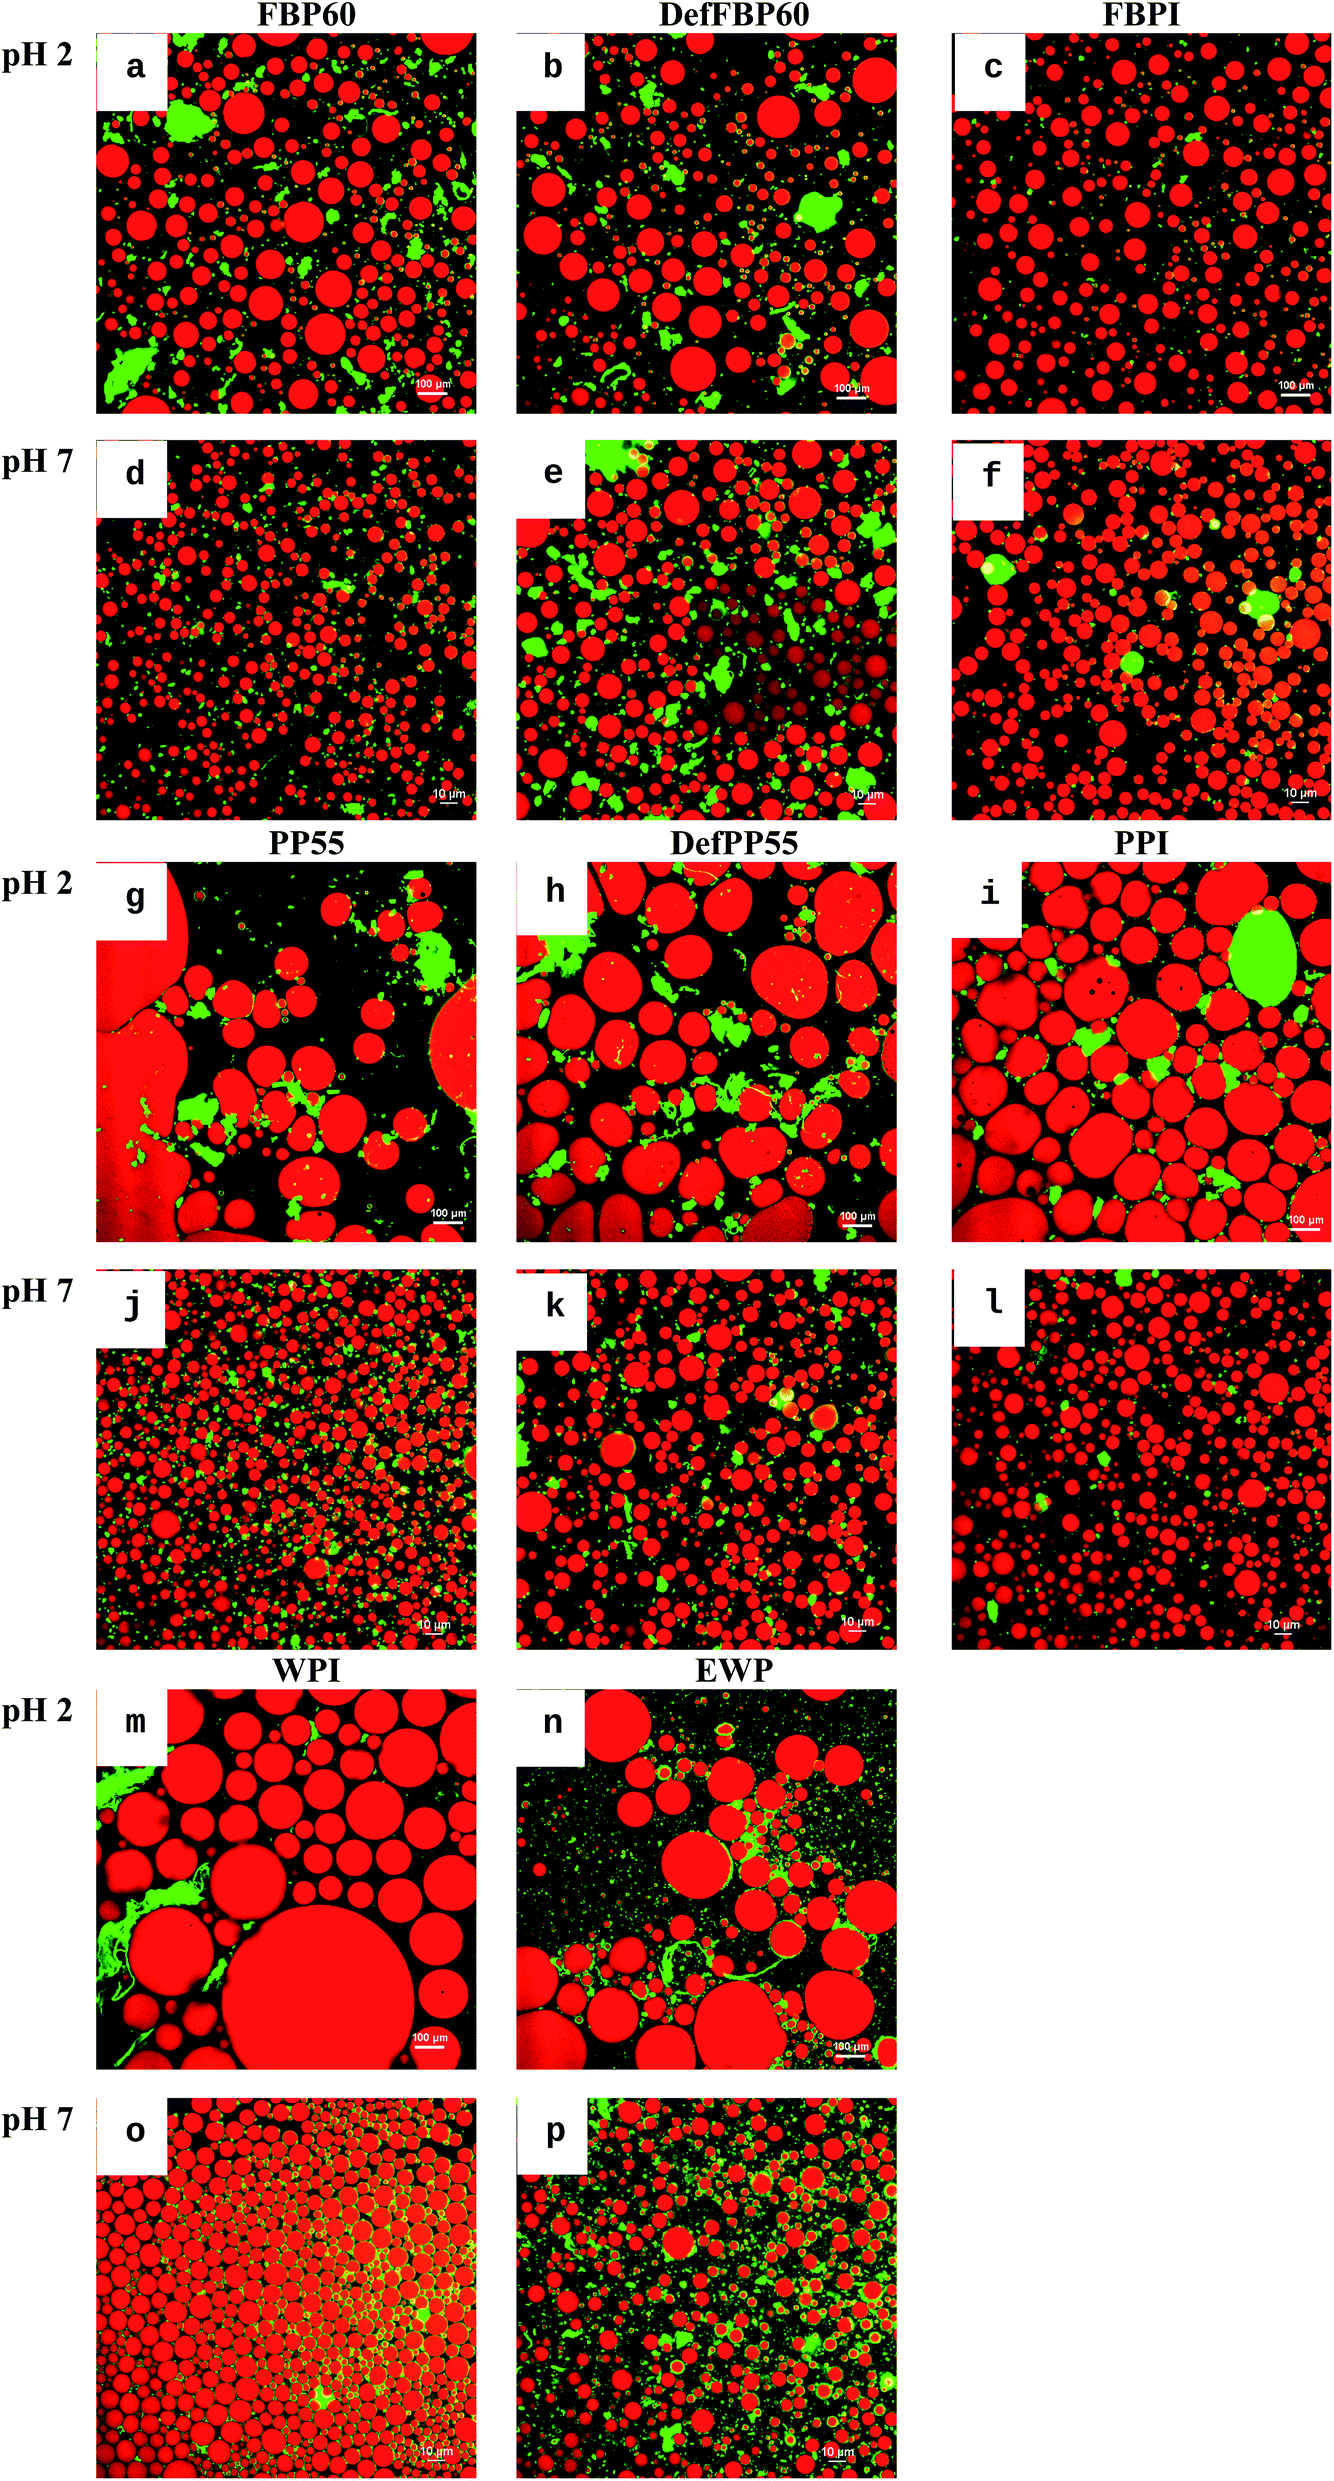 | ||
| Fig. 8 Confocal laser scanning micrographs of oil-in-water emulsions prepared using various commercial protein sample. (a–f) Faba bean proteins, (g–l) pea proteins, (m and n) WPI and (o and p) EWP at pH 2 and pH 7. Scale bar represents 10 μm. See Table 1 for sample identification. | ||
Apparent viscosity. All the emulsions prepared showed shear-thinning behaviour where viscosity decreased as a function of shear rate (data not shown). To better compare the viscosity of different emulsions, the apparent viscosities at 1 s−1 shear rate was plotted as a function of storage time at pH 2 and pH 7 (Fig. 9). At pH 2, FBP-stabilized emulsions showed the highest apparent viscosities (∼6 Pa s) followed by EWP (∼2.5 Pa s), while the viscosities of PP and WPI-stabilized emulsions were very low (Fig. 9a). The apparent viscosities of all emulsions stabilized with PP were significantly lower than FBP, which could be attributed to the larger oil droplets and higher emulsion destabilization in the former. At pH 7, apparent viscosities of most emulsions significantly increased compared to pH 2, except for FBP60 and DefFBP60, where viscosity remained unchanged. The effect of pH on viscosity was more noticeable for PP-stabilized emulsions. The smaller droplet size of PP-stabilized emulsions at pH 7 was probably responsible for their higher viscosities as emulsions with smaller droplets have more hydrodynamic interactions between the droplets.65 At pH 7, among the different varieties, both the protein isolates showed higher viscosities than other protein types. FBPI-stabilized emulsion showed the highest apparent viscosity (11.9 ± 0.2 Pa s), followed by PPI (10.2 ± 1.2 Pa s) (Fig. 9b). This can be due to the higher protein content in the isolates than other pulse proteins. The viscosity of most emulsions stayed unchanged after 14 days at pH 2; however, the viscosity of PPI, WPI and EWP decreased (Fig. 9a). At pH 7, no change in apparent viscosity was observed for most emulsions after 14 days of storage, indicating unchanged emulsion structure with time, except the FBPI, PP55 and EWP-stabilized emulsions (Fig. 9b).
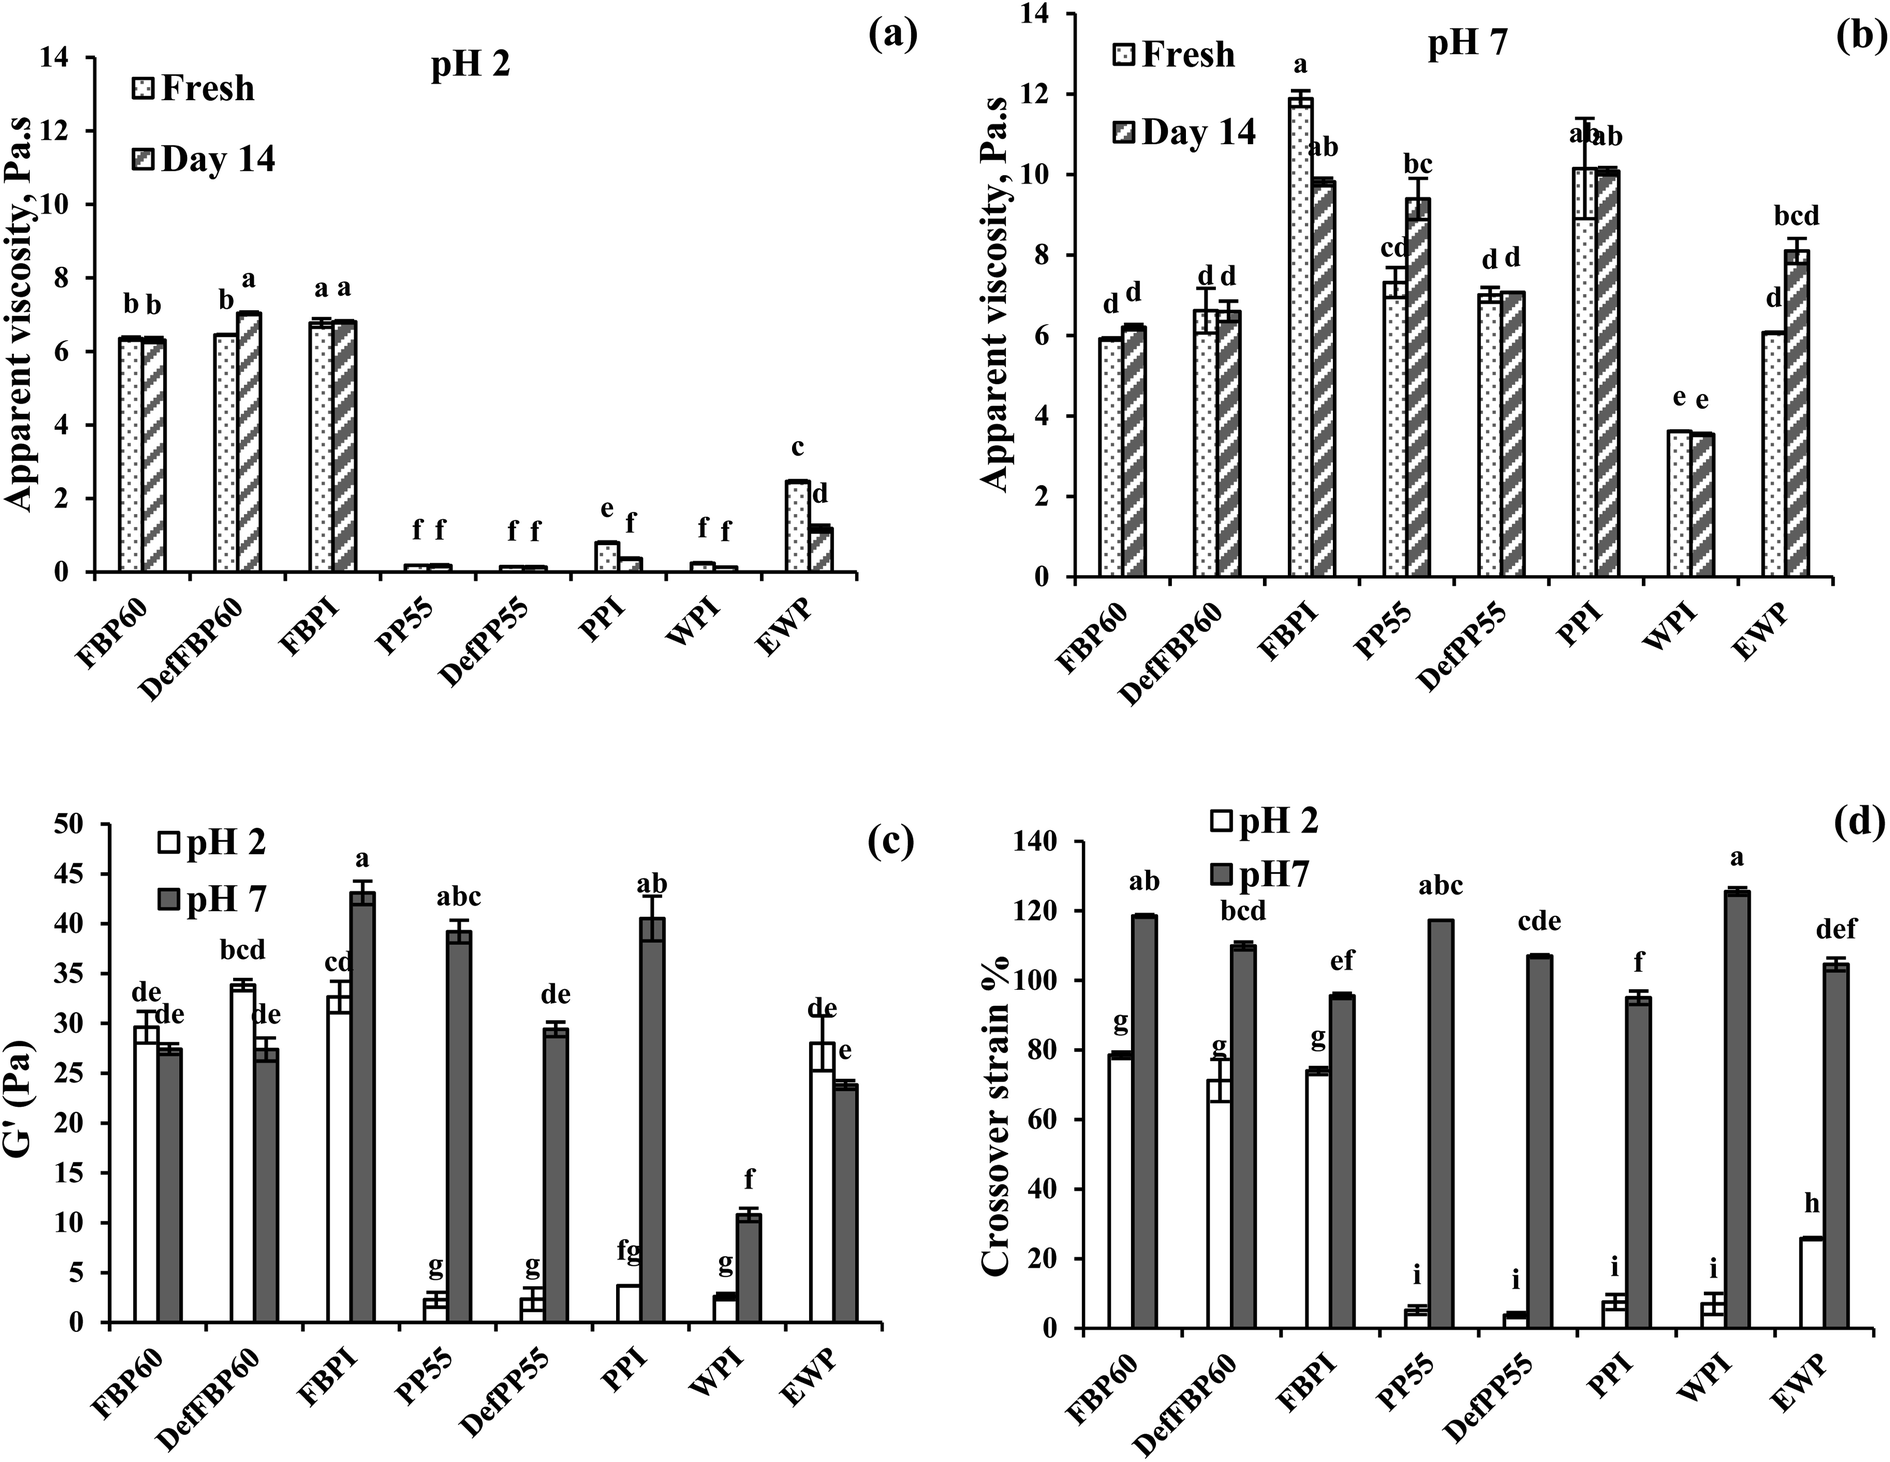 | ||
| Fig. 9 Effect of storage time on the apparent viscosities (at 1 s−1 shear rate) of emulsions stabilized by various commercial protein samples at (a) pH 2 and (b) pH 7. Viscoelasticity of emulsions stabilized by various commercial protein samples expressed as (c) plateau storage modulus (G′) at 0.1% strain and (d) crossover strain% pH2 and pH 7. Means that do not share a letter are significantly different by Tukey's test at p < 0.05 significance level. See Table 1 for sample identification. | ||
Emulsion viscoelasticity. All emulsions at pH 7 and only the FBP emulsions at pH 2 with G′ > 10 Pa showed a linear viscoelastic region (LVR) where the storage (G′) and loss modulus (G′′) remained constant as a function of strain (Fig. S1, ESI†). The PP and WPI emulsions at pH 2 did not show any LVR, and the G′ values were less than 5 Pa and only briefly higher than G′′, indicating weak gels (Fig. S1†). At a higher strain beyond LVR, G′ and G′′ crossed over, indicating gel breakdown. The strain at the crossover is a measure of the force required for gel breakdown. To directly compare the gel strength of all emulsions, their G′ within the LVR at 0.1% strain and the crossover strain were plotted in Fig. 9c and d, respectively. At pH 2, FBP and EWP-stabilized emulsions showed a much higher G′ than PP and WPI-stabilized emulsions. Among the different FBP emulsions, no significant difference in G′ was observed (Fig. 9c). At pH 2, FBP emulsions also showed much higher crossover strain than PP, WPI and EWP emulsions, indicating these emulsions can withstand higher stress before breaking down (Fig. 9d). At pH 7, the storage moduli of all PP, FBPI and WPI-stabilized emulsions was noticeably increased compared to pH 2, which shows the formation of a stronger structure (Fig. 9c). The crossover strain of all emulsions was also higher at pH 7 than pH 2. It has previously been reported that a decrease in droplet size would lead to an increase in modulus and fracture strain in emulsions.66 In the present case, FBPI and PPI had higher protein content compared to concentrates, and de-flavoured samples and also droplet size of FBP emulsions were much smaller at pH 2 compared to PP emulsions leading to a higher gel strength. At pH 7, all pulse protein emulsion showed strong-gel behaviour and their gel strength was higher than WPI and EWP emulsions. Gelation in pulse protein-stabilized coarse emulsions could be important for many food applications (e.g., salad dressing, spreadable dipping sauce, mayonnaise, etc.) that requires structure formation. From the results obtained above, depending on pH and protein type, pulse proteins can be successfully used for this purpose.
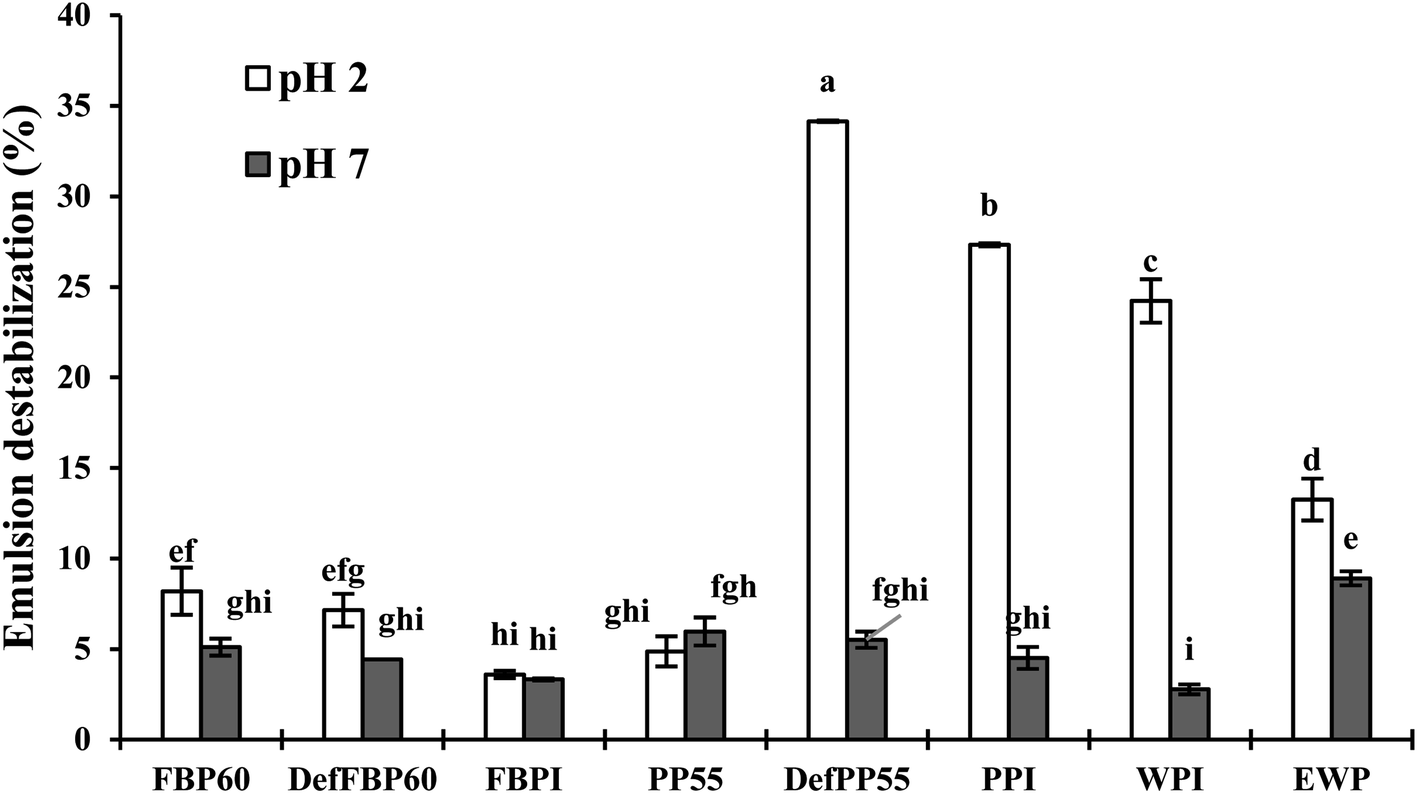 | ||
| Fig. 10 Percent emulsion destabilization in terms of free oil separation under centrifugal force. Emulsions were prepared with various commercial protein samples at pH 2 and pH 7. Means that do not share a letter are significantly different by Tukey's test at p < 0.05 significance level. See Table 1 for sample identification. | ||
3.5. Development of an empirical model to predict emulsion characteristics from protein properties
The regression models were obtained by fitting eqn (5) to the experimental data of proteins (input variables: S, OHC, WHC, IT, and IF (soluble + insoluble)) and emulsion (output response: droplet size, percent destabilization, and viscosity) properties (eqn (6)–(8)) at pH 7. Other input variables determined in this research (secondary structure, zeta potential) did not have any significant effect on the emulsion properties, hence was not included in the model development. The high correlation coefficient (R2 = 0.9996, 0.9993 and 0.9994 for size, destabilization and viscosity, respectively) between the values predicted by the regression models (eqn (6)–(8)) and the experimental data implies that the EPR technique has promising potential to predict the performance of such systems (Fig. S2, ESI†).| Size = −0.00319 × OHC2 + 0.00017 × IT0.5 × WHC × IF − 0.01281 × S0.5 × WHC × IF0.5 + 40.95 | (6) |
| Destabilization = 0.58509 × IF2 + 0.01929 × IT0.5 × IF0.5 + 0.00011 × S2 × IT0.5 − 2.2385 | (7) |
| Viscosity = 0.00731 × WHC × IF0.5 + 1.73 × 10⁻⁸ × WHC2 × OHC2 × IF0.5 + 0.00289 × S × IT0.5 + 3.3194 | (8) |
To investigate the strength of the relationship between the input (S, OHC, WHC, IF, and IT) and output (emulsion droplet size, destabilization and viscosity) parameters, the traditional and widely used one-factor-at-a-time (OFAT) approach was employed. The analysis was conducted such that one variable of eqn (6)–(8) was changed step by step from a low to a high value at one time, while the other variables were kept fixed at their baseline values. Then, the selected variable was returned to its baseline value, and these steps were repeated for each of the other inputs in the same way. In order to make a tangible comparison between the input and output parameters, the range of values obtained for S (8.25–100%), IF (5.16 × 10⁶ to 2.74 × 10⁷), IT (6.65–15.40 mN m−1), WHC (1.16–5.56 g g−1) and OHC (0.73–1.15 g g−1) were normalized between 1 and 100. The mean normalized value of S (50.89), IF (61.44), IT (49.79), WHC (42.84) and OHC (40.34) were considered as the baselines in the OFAT analysis. Fig. 11a, b and c show the variations in the emulsion droplet size, destabilization and viscosity, respectively, as a function of the input variables based on eqn (6)–(8). It should be noted that only a specific range of values for each input parameter is shown where the model predictions are reasonable. As shown in Fig. 11a, WHC had the highest effect (slope of −0.64) on the emulsion particle size, such that when WHC increased from its minimum to maximum value, the emulsion particle size decreased from 28.7 to 9.6 μm. Increasing OHC, IF, and S also led to the reduction in emulsion particle size (slopes −0.1, −0.37, and −0.51, respectively). As expected, IT had the opposite effect, although an increase from the minimum to maximum value showed a minor increase in emulsion particle size from 8.2 to 9.5 μm (slope of 0.02). For emulsion destabilization (Fig. 11b), solubility had the highest effect (slope of 0.06) on the emulsion size, followed by IF (slope of 0.05) and IT (slope of 0.03). As these parameters were increased from minimum to maximum value, the emulsion destabilization increased. Emulsion viscosity was mostly affected by WHC (slope of 0.08), whose effect was higher than IF, OHC, S and IT (slope of 0.03, 0.02, 0.02 and 0.01, respectively) (Fig. 11c) increasing all these factors from minimum to maximum increased emulsion viscosity.
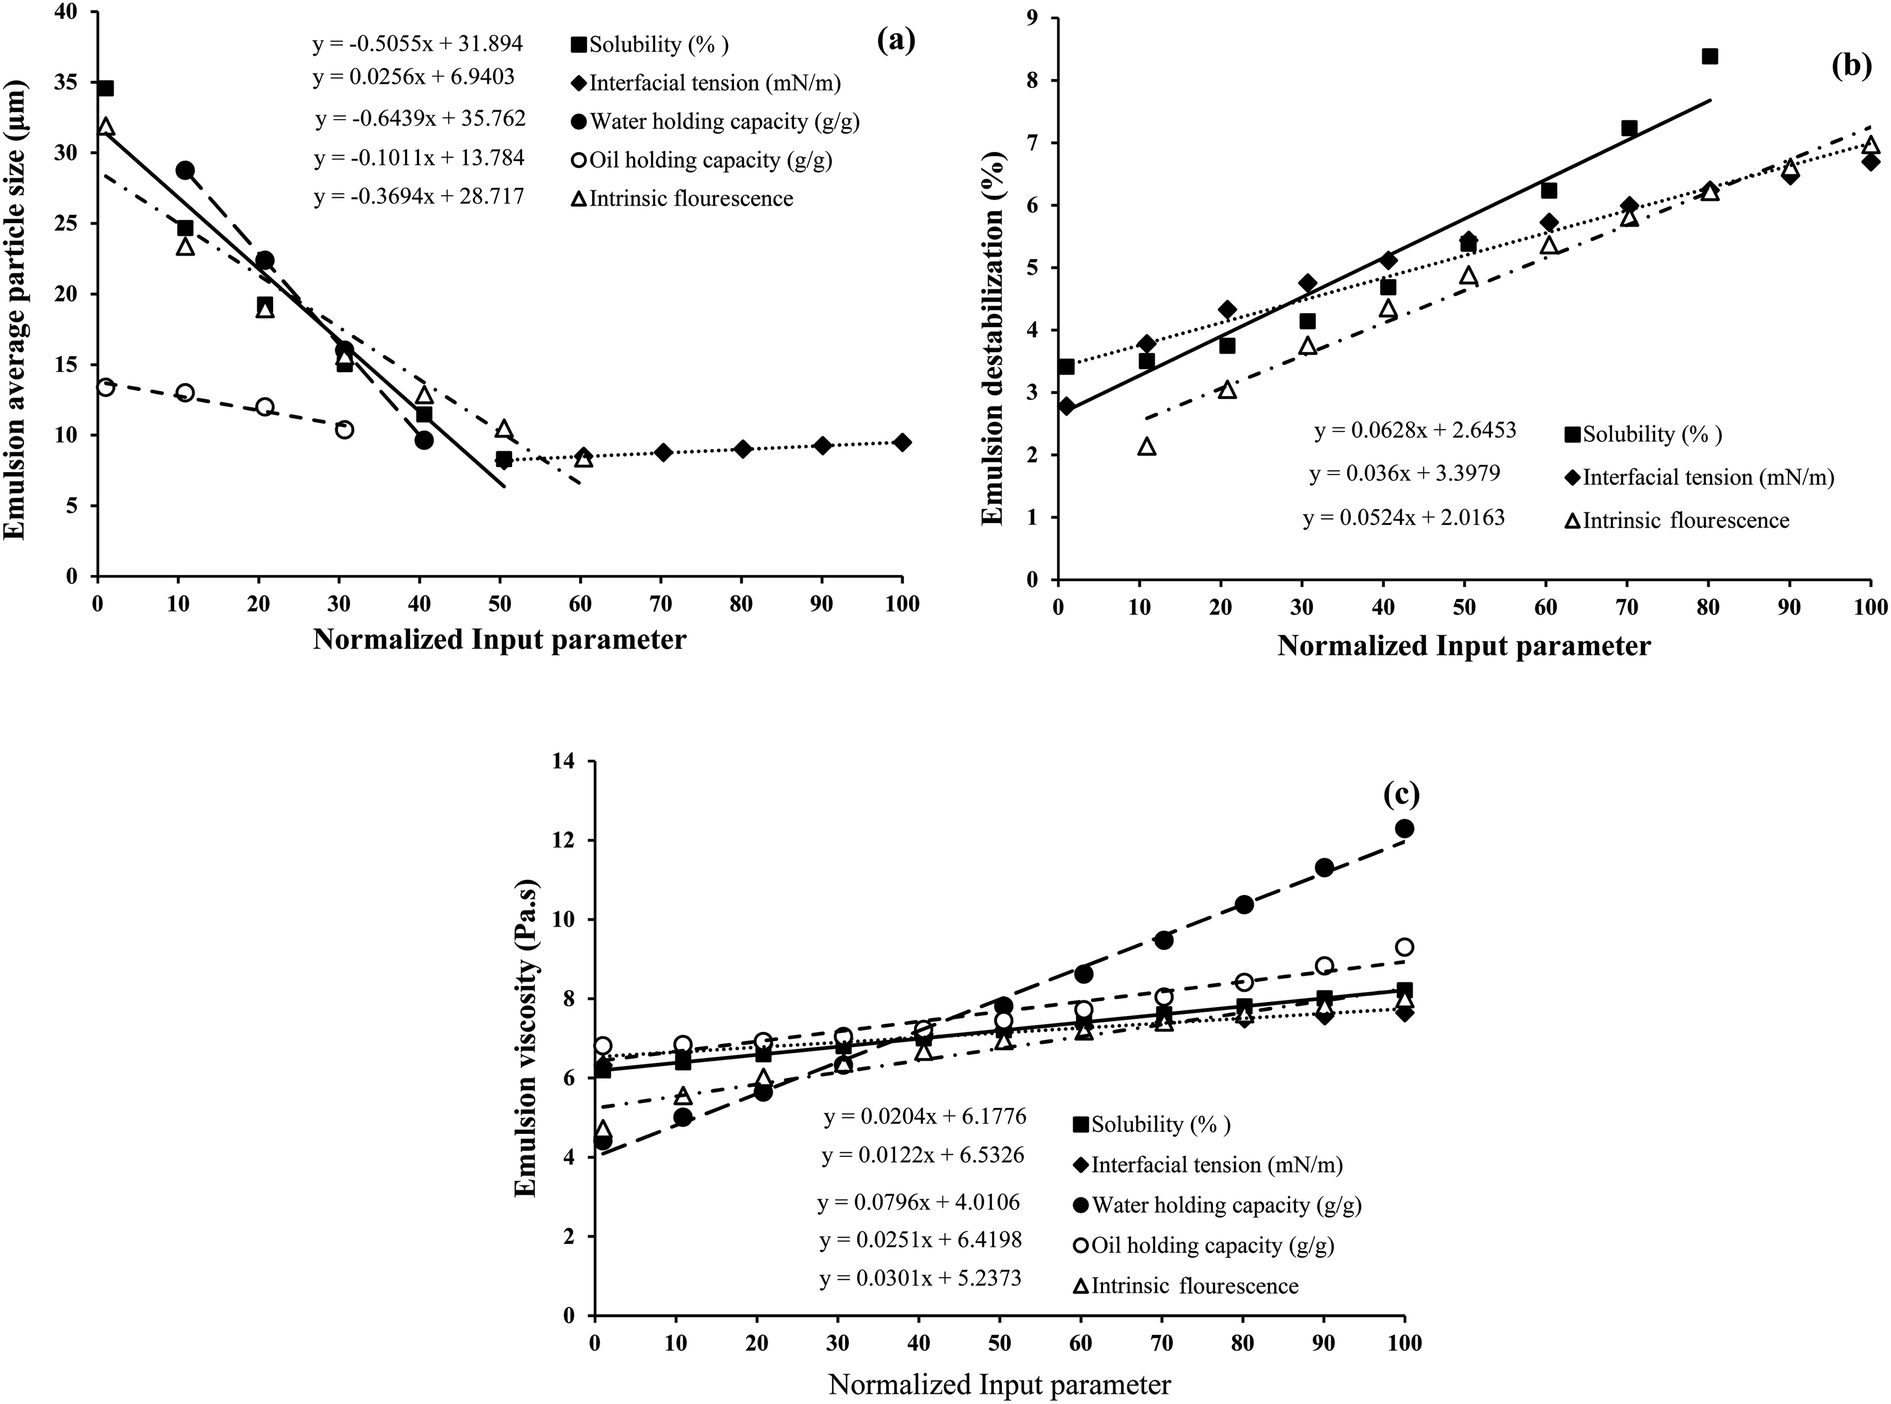 | ||
| Fig. 11 Model prediction of emulsion (a) average particle size, (b) destabilization % and (c) viscosity as a function of normalized input parameters: solubility (S), interfacial tension (IT), water (WHC) and oil holding capacity (OHC), and intrinsic fluorescence (IF). The strength of the relationship between the input and output (emulsion droplet size, destabilization and viscosity) parameters was investigated using the one-factor-at-a-time (OFAT) approach, where one input variable was changed step-by-step from a low to a high value at one time, while the other variables were kept fixed at their mean normalized baseline values. | ||
Overall, our model predicts that an increase in protein S, WHC, OHC and IF are more favourable to decrease emulsion particle size. However, it also predicts that an increase in S and IF in the given range would lead to higher emulsion destabilization under accelerated gravity. It is possible that if proteins are more soluble in the aqueous phase, they could be removed from the oil droplet surface during centrifugal separation into the aqueous phase, leading to droplet coalescence and emulsion destabilization. From Fig. 4a, we have seen that the soluble fraction of proteins had significantly higher IF; therefore, it is reasonable that the effect of S is similar to IF. IT did not show much influence on emulsion particle size, although a lower value of IT seems more favourable to lower emulsion destabilization under accelerated gravitation. Lower IT indicates that proteins are more surface-active; therefore, they tend to reside at the oil droplet surface and protect the droplets from forced destabilization. For emulsion viscosity, the model predicts a positive correlation with all the input variables, although WHC of proteins seems to be the one most influencing emulsion viscosity. This means protein's ability to bind with water seems to be more critical in controlling emulsion viscosity than their other properties. Finally, it should be mentioned that the empirical model proposed here is based on the input variables determined at pH 7, and the model is only valid for the used ranges for all the variables. However, such an approach would certainly be useful to predict emulsion formation and the stabilization of various protein ingredients for the food industry.
4. Conclusions
An extensive study was done to compare the structure, functionality and emulsification behaviour of isolates, concentrates and de-flavoured concentrates of PP and FBP in comparison with WPI and EWP at neutral (pH 7) and acidic (pH 2) conditions. Protein concentrates showed significantly higher solubility compared to the isolates. The solubility of WPI and EWP, however, was significantly higher than all the pulse protein samples. The SDS-PAGE profiles of the protein concentrates showed the presence of more high-molecular-weight bands in the soluble compared to the insoluble fractions; however, for the isolates, not much difference was observed. The protein secondary structure did not show a consistent difference between the various samples. In contrast, IF of the soluble fractions showed much higher intensity compared to the insoluble fractions, indicating the protein's ability to hide the aromatic amino acids in the hydrophobic interior, thereby lower quenching of their fluorescence in the aqueous phase. IT of all plant proteins were comparable to WPI and EWP. All samples of FBP showed a lowering of IT at pH 7 compared to pH 2, while no significant difference was observed for PP, which remained higher than FBP. The higher protein content of the isolates was found to improve their WHC. The zeta potential of all proteins was higher at pH 7 than pH 2, and the isolates had higher charges compared to the concentrates. At pH 7, all plant proteins showed higher zeta potential than WPI and EWP.All emulsions prepared at pH 7, were more stable than the ones at pH 2, which led to higher viscosities and storage moduli at pH 7 compared to pH 2. The contrasting effect of pH on emulsion stability and viscosity was more noticeable for PP compared to the FBP; therefore, the latter is more suitable for both pH values, even when compared with WPI and EWP. Emulsions stabilized with the concentrates appeared to be better or comparable to the isolates in terms of particle size, zeta potential, and microstructure. The isolate-stabilized emulsions, however, had higher viscosity compared to the concentrates at pH 7, while at pH 2, no such difference was observed. Heat treatment led to a particle size increase in all emulsions. The addition of salt had a greater destabilizing effect at pH 2 compared to pH 7. Once again, FBP appeared as more suitable for emulsion stability when both heat treatment and salt addition was compared.
Finally, the EPR technique was successfully used to develop empirical models to predict emulsion particle size, destabilization and viscosity at pH 7 based on S, OHC, WHC, IF, and IT. It was found that an increase in protein S, WHC, OHC and IF are more favourable to decrease emulsion particle size, while an increase in S and IF in the given range would lead to higher emulsion destabilization under accelerated gravity. A decrease in IT, while did not have much influence on emulsion particle size, was more favourable to lower emulsion destabilization under accelerated gravitation. Emulsion viscosity was more dependent on WHC compared to any other factors. Such an approach, although with limited ability, could be useful for ingredient manufacturers to predict the emulsification ability of their protein ingredients based on their physicochemical properties.
Conflicts of interest
There are no conflicts to declare.Acknowledgements
This research was supported by NSERC Engage Grant in collaboration with AGT Foods, Canada, and Canada Foundation for Innovation (CFI) Leaders Opportunity Fund and Saskatchewan Science foundation.References
- A. C. Y. Lam, A. Can Karaca, R. T. Tyler and M. T. Nickerson, Food Rev. Int., 2018, 34, 126–147 CrossRef CAS.
- M. Duranti and C. Gius, Field Crops Res., 1997, 53, 31–45 CrossRef.
- Y. Ladjal-Ettoumi, H. Boudries, M. Chibane and A. Romero, Food Biophys., 2016, 11, 43–51 CrossRef.
- M. Carbonaro, P. Maselli and A. Nucara, Amino Acids, 2012, 43, 911–921 CrossRef CAS PubMed.
- M. Carbonaro, P. Maselli and A. Nucara, Food Res. Int., 2015, 76, 19–30 CrossRef CAS.
- A. C. Karaca, N. Low and M. Nickerson, Food Res. Int., 2011, 44, 2742–2750 CrossRef CAS.
- P. Pelgrom, J. Wang, R. Boom and M. Schutyser, J. Food Eng., 2015, 155, 53–61 CrossRef CAS.
- A. K. Stone, A. Karalash, R. T. Tyler, T. D. Warkentin and M. T. Nickerson, Food Res. Int., 2015, 76, 31–38 CrossRef CAS.
- J. Boye, F. Zare and A. Pletch, Food Res. Int., 2010, 43, 414–431 CrossRef CAS.
- P. Pelgrom, A. Vissers, R. Boom, M. Schutyser, P. Pelgrom, A. Vissers, R. Boom and M. Schutyser, Food Res. Int., 2013, 53, 232–239 CrossRef CAS.
- R. Aluko and R. Yada, Int. J. Food Sci. Nutr., 1997, 48, 31–39 CrossRef CAS PubMed.
- X. Han and B. R. Hamaker, Starch, 2002, 54, 454–460 CrossRef CAS.
- Z. Ma, J. Boye, B. Simpson, S. Prasher, D. Monpetit and L. Malcolmson, Food Res. Int., 2011, 44, 2534–2544 CrossRef CAS.
- A. Singhal, A. C. Karaca, R. Tyler and M. Nickerson, in Grain Legumes, InTech, 2016 Search PubMed.
- J. E. Kinsella and N. Melachouris, Crit. Rev. Food Sci. Nutr., 1976, 7(3), 219–280 CrossRef CAS.
- B. Nagmani and J. Prakash, Int. J. Food Sci. Nutr., 1997, 48, 205–214 CrossRef CAS PubMed.
- M. Vogelsang-o, I. L. Petersen, M. S. Joehnke, J. C. Sørensen, J. Bez, A. Detzel, M. Busch, M. Krueger, J. A. O. Mahony, E. K. Arendt and E. Zannini, Foods, 2020, 9, 1–24 Search PubMed.
- N. Diftis and V. Kiosseoglou, Food Chem., 2003, 81, 1–6 CrossRef CAS.
- R. Aluko, O. Mofolasayo and B. Watts, J. Agric. Food Chem., 2009, 57, 9793–9800 CrossRef CAS PubMed.
- M. P. Aronson, Langmuir, 1989, 5, 494–501 CrossRef CAS.
- S. D. Arntfield and E. D. Murray, Can. Inst. Food Sci. Technol. J., 1981, 14, 289–294 CrossRef.
- Z. Q. Jiang, M. Pulkkinen, Y. J. Wang, A. M. Lampi, F. L. Stoddard, H. Salovaara, V. Piironen and T. Sontag-Strohm, LWT--Food Sci. Technol., 2016, 68, 295–305 CrossRef CAS.
- A. V. Megha and D. R. Grant, Can. Inst. Food Sci. Technol. J., 1986, 19, 174–180 CrossRef CAS.
- V. B. Galazka, E. Dickinson and D. A. Ledward, Food Hydrocolloids, 1999, 13, 425–435 CrossRef CAS.
- W. Peng, X. Kong, Y. Chen, C. Zhang, Y. Yang and Y. Hua, Food Hydrocolloids, 2016, 52, 301–310 CrossRef CAS.
- S. T. Ohnishi and J. K. Barr, Anal. Biochem., 1978, 86, 193–200 CrossRef CAS PubMed.
- C. D. Doan and S. Ghosh, Nanomaterials, 2019, 9, 2–4 CrossRef PubMed.
- M. Yerramilli, N. Longmore and S. Ghosh, Food Hydrocolloids, 2017, 64, 99–111 CrossRef CAS.
- M. Carbonaro and A. Nucara, Amino Acids, 2010, 38, 679–690 CrossRef CAS PubMed.
- Q. Yan, Bio-protocol, 2011, 1, 1–2 Search PubMed.
- S. Pahlavanzadeh, K. Zoroufchi Benis, M. Shakerkhatibi, A. Karimi Jashni, N. Taleb Beydokhti and S. Alizadeh Kordkandi, J. Environ. Chem. Eng., 2018, 6, 6154–6164 CrossRef CAS.
- O. Giustolisi and D. A. Savic, J. Hydroinf., 2006, 8, 207–222 CrossRef.
- M. Najafzadeh and M. Zeinolabedini, Environ. Sci. Pollut. Res., 2018, 25, 22931–22943 CrossRef PubMed.
- S. Alzabeebee and D. N. Chapman, Transp. Geotech., 2020, 24, 100372 CrossRef.
- M. Shakerkhatibi, N. Mohammadi, K. Zoroufchi Benis, A. B. Sarand, E. Fatehifar and A. A. Hashemi, Environ. Health Eng. Manage. J., 2015, 2, 117–122 CAS.
- Kh. Zoroufchi Benis, M. Shakouri, K. McPhedran and J. Soltan, Environ. Sci. Pollut. Res., 2021, 28, 12659–12676 CrossRef CAS PubMed.
- D. Laucelli and O. Giustolisi, Environ. Model. Softw., 2011, 26, 498–509 CrossRef.
- X. Qu and C. F. J. Wu, J. Stat. Plan. Inference, 2005, 131, 407–416 CrossRef.
- F. Sosulski and A. McCurdy, J. Food Sci., 1987, 52, 1010–1014 CrossRef.
- N. Leyva-Lopez, N. Vasco, A. Barba de la Rosa and O. Paredes-Lopez, Plant Foods Hum. Nutr., 1995, 47, 49–53 CrossRef CAS PubMed.
- P. J. Shand, H. Ya, Z. Pietrasik and P. K. J. P. D. Wanasundara, Food Chem., 2007, 102, 1119–1130 CrossRef CAS.
- N. J. Neucere, J. Agric. Food Chem., 1972, 20, 252–255 CrossRef CAS.
- D. J. McClements, F. J. Monahan and J. E. Kinsella, J. Food Sci., 1993, 58, 1036–1039 CrossRef CAS.
- R. A. Judge, E. L. Forsythe and M. L. Pusey, Biotechnol. Bioeng., 1998, 59, 776–785 CrossRef CAS PubMed.
- E. Derbyshire, D. J. Wright and D. Boulter, Phytochemistry, 1976, 15, 3–24 CrossRef CAS.
- I. Correia, A. Nunes, A. S. Barros and I. Delgadillo, J. Cereal Sci., 2010, 51, 146–151 CrossRef CAS.
- E. Gujska and K. Khan, J. Food Sci., 1991, 56, 1013–1016 CrossRef CAS.
- H. Y. Law, S. M. Choi and C. Y. Ma, Food Res. Int., 2008, 41, 720–729 CrossRef CAS.
- C. H. Tang and C. Y. Ma, Food Chem., 2009, 115, 859–866 CrossRef CAS.
- C. H. Tang and X. Sun, Food Hydrocolloids, 2011, 25, 315–324 CrossRef CAS.
- C. Chang, S. Tu, S. Ghosh and M. T. Nickerson, Food Res. Int., 2015, 77, 360–367 CrossRef CAS.
- A. Gharsallaoui, E. Cases, O. Chambin and R. Saurel, Food Biophys., 2009, 4, 273–280 CrossRef.
- S. P. Johnston, M. T. Nickerson and N. H. Low, J. Food Sci. Technol., 2015, 52, 4135–4145 CrossRef CAS PubMed.
- R. Toews and N. Wang, Food Res. Int., 2013, 52, 445–451 CrossRef CAS.
- O. Paredes-Lopez, C. Ordorica-Falomir, M. R. Olivares-Vazquez, O. Paredes-Lopez, C. Ordorica-Falomir and M. R. Olivares-Vazquez, J. Food Sci., 1991, 56, 726–729 CrossRef CAS.
- J. Boye, S. Aksay, S. Roufik, S. Ribéreau, M. Mondor, E. Farnworth and S. Rajamohamed, Food Res. Int., 2010, 43, 537–546 CrossRef CAS.
- K. Demetriades, J. N. Coupland and D. J. McClements, J. Food Sci., 1997, 62, 342–347 CrossRef CAS.
- P.-O. Hegg, Biochim. Biophys. Acta, Protein Struct., 1979, 579, 73–87 CrossRef CAS.
- K. Shevkani, N. Singh, A. Kaur and J. C. Rana, Food Hydrocolloids, 2015, 43, 679–689 CrossRef CAS.
- C. E. Gumus, E. A. Decker and D. J. Mcclements, Food Biophys., 2017, 12, 186–197 CrossRef.
- E. Dickinson, Colloids Surf., B, 2010, 81, 130–140 CrossRef CAS PubMed.
- H. N. Xu, Y. Liu and L. Zhang, Soft Matter, 2015, 11, 5926–5932 RSC.
- O. F. Castellani, E. N. Martínez and M. C. Añón, J. Agric. Food Chem., 1998, 46, 4846–4853 Search PubMed.
- M. Primozic, A. Duchek, M. Nickerson and S. Ghosh, Food Hydrocolloids, 2018, 77, 126–141 CrossRef CAS.
- R. Pal, J. Colloid Interface Sci., 2000, 225, 359–366 CrossRef CAS PubMed.
- G. Sala, T. van Vliet, M. Cohen Stuart, F. van de Velde and G. A. van Aken, Food Hydrocolloids, 2009, 23, 1853–1863 CrossRef CAS.
Footnote |
| † Electronic supplementary information (ESI) available. See DOI: 10.1039/d0ra09302e |
| This journal is © The Royal Society of Chemistry 2021 |