
 Open Access Article
 This Open Access Article is licensed under a Creative Commons Attribution-Non Commercial 3.0 Unported Licence
Novel Fe3O4–poly(methacryloxyethyltrimethyl ammonium chloride) adsorbent for the ultrafast and efficient removal of anionic dyes†
Bo Zhoua,
Yuling Tanga,
Liming Zhaoa,
Lijun Guoa and
Jianfei Zhou *ab
*ab
aNational Engineering Research Center of Clean Technology in Leather Industry, Sichuan University, Chengdu, 610065, China. E-mail: zhouamao2004@126.com
bKey Laboratory of Leather Chemistry and Engineering (Sichuan University), Ministry of Education, Chengdu, 610065, P. R. China
First published on 4th January 2021
Abstract
The removal of anionic dyes from wastewater has attracted global concern. In this work, a novel Fe3O4–poly(methacryloxyethyltrimethyl ammonium chloride) (Fe3O4–pDMC) adsorbent for the efficient removal of anionic dyes from wastewater was successfully synthesized by grafting methacryloxyethyltrimethyl ammonium chloride (DMC) on the surfaces of Fe3O4. Various characterization analyses confirmed that the obtained Fe3O4–pDMC possessed numerous functional groups on its surfaces and retained good magnetic separation properties. Fe3O4–pDMC showed ultrafast removal for acid orange 7 (AO7, 58.6%, 1 min) and direct blue 15 (DB15, 98.1%, 1 min), and the maximum adsorption capacity was high (266.8 and 336.5 mg g−1 for AO7 and DB15, respectively). In addition, the adsorption process was in accordance with pseudo-second-order kinetics and the Langmuir isotherm. The mechanism underlying the adsorption of Fe3O4–pDMC on anionic dyes was mainly dependent on electrostatic interaction. This study illustrated that Fe3O4–pDMC has great potential applications as an environmentally friendly, desirable adsorbent for the efficient removal of anionic dyes from wastewater.
1. Introduction
Anionic dyes have been widely used in many industries, such as the textile, plastics, foodstuff, and tannery industries, which generate massive amounts of dye-contaminated wastewater.1–3 The dye-containing wastewater leads to reductions in dissolved oxygen content and light transmittance.2,4 These effects increase the toxicity of water. In addition, most dyes and their degradation products can cause poisoning, allergies, skin irritation, and cancer in humans.5,6 Therefore, the efficient removal of dyes from wastewater is extremely important to environmental protection.Over the past several years, multifarious techniques, such as chemical coagulation, ion exchange, photocatalysis degradation, Fenton-like degradation, biochemical degradation, membrane separation, and adsorption, have been exploited for the removal of dyes from dye-contaminated wastewater.7–9 Among these techniques, adsorption is considered as the most suitable method to remove anionic dyes from wastewater due to its high removal efficiency, easy recovery, low cost and simple operation.7,10–12 An efficient and ingenious adsorbent is a vital factor for the efficient removal of anionic dyes.
Anionic dyes contain anionic hydrophilic groups, such as sulfonic (–SO3H), hydroxyl (–OH), and carboxyl (–COOH) groups.11,13 Therefore, an adsorbent containing a large number of cationic groups is beneficial for the removal of anionic dyes. For example, Chowdhury et al. synthesized a positively charged Ni–Co–S/CTAB adsorbent that exhibited effective adsorption for Congo red, methyl orange, and dichromate (Cr2O72−).14 Huang et al. adopted in situ synthesis to prepare PEI–Pt modified bacterial cellulose as a bio-adsorbent for the efficient adsorption of anionic dyes.15 Methacrylatoethyltrimethyl ammonium chloride (DMC) is a type of cationic monomer containing quaternary ammonium groups. The polymer of DMC possesses extremely strong polarity and affinity for anionic substances and is widely used as a cationic flocculant for wastewater treatment, papermaking, coal flotation, printing, and dyeing.16–20 Thus, DMC has potential uses in preparing efficient adsorbents for the removal of anionic dyes through polymerization.
During preparation, most polymer adsorbents form a three-dimensional net structure to guarantee their indissolubility. However, this structure causes polymer adsorbents to adsorb water during adsorption and complicates separation after adsorption and is thus not beneficial for practical application.21–23 Therefore, a nonswelling and easily separable adsorbent is urgently needed and vital. Zhang et al. prepared a cationic-modified silica gel (CM-SG) adsorbent by immobilizing the cationic polymer polyepichlorohydrin–dimethylamine on the surfaces of silica gel particles.24 CM-SG was insoluble without forming a three-dimensional network structure and showed excellent adsorption capacity for anionic dyes. An et al. also reported a self-floating adsorbent (SFA) that was successfully prepared by grafting single-layer amino groups on the surfaces of hollow glass microspheres.25 During the adsorption process of anionic dyes, the obtained SFA exhibited the high adsorption capacity and satisfactory separation performance. Therefore, grafting water-soluble materials on water-insoluble solid materials is a feasible method for preparing an efficient adsorbent for pollutant removal. This approach not only utilizes sufficient functional groups but also overcomes the water solubility defect of water-soluble materials.
Fe3O4 magnetic nanoparticles (MNPs) have attracted considerable attention due to their high surface areas, superparamagnetic properties, nontoxicity, and biocompatibility. They have been widely used in tissue repair, magnetic resonance imaging, hyperthermia, drug delivery, molecular diagnostics, and catalysis.26–28 When dispersed in aqueous water, Fe3O4 can expose numerous hydroxyl groups, which provide reaction sites for modification into adsorbents. Maleki et al. utilized Fe3O4 and geopolymers to a prepare geopolymer/Fe3O4 nanocomposite that acted as an efficient and magnetic adsorbent for the removal of various heavy metals from aqueous solutions.29 This nanocomposite showed high removal efficiency for copper, lead, nickel, cadmium, and mercury ions. Liu et al. utilized N,N-dimethyldodecylamine to modify Fe3O4 for the preparation of Fe3O4@MDHM.30 The adsorbent displayed satisfactory removal of flavonoid and superior magnetic extraction performance after adsorption. Zirak et al. synthesized CMC-coated Fe3O4@SiO2 MNPs by coating carboxymethyl cellulose on the surfaces of aminopropyl-triethoxysilane-modified Fe3O4, and the adsorbent exhibited the efficient removal of methylene blue from aqueous solutions.31 Therefore, an adsorbent that consists of MNPs and functional polymers will exhibit high adsorption capacity for the target pollutant, favorable and easy separation, and recyclability.
Inspired by the above works, we prepared DMC polymer-functionalized Fe3O4 with a core–shell structure (Fe3O4–pDMC) for use as a nonswelling and easily separable adsorbent for the removal of anionic dyes from wastewater. Scheme 1 shows the preparation of the Fe3O4–pDMC adsorbent. Fe3O4 MNPs were modified with vinyltrimethoxysilane (VTMS) to endow numerous vinyl groups on the surfaces of Fe3O4. These groups provided the reaction sites for copolymerization with DMC to prepare Fe3O4–pDMC. Fe3O4–pDMC was expected to exhibit high adsorbability for anionic dyes due to the presence of a large amount of the quaternary ammonium groups of pDMC. The obtained Fe3O4–pDMC was characterized via various characterization techniques to investigate its structure, physicochemical properties, and magnetic features. Then, an acid dye (acid orange 7 [AO7]) and a direct dye (direct blue 15 [DB15]) were chosen as the model anionic dyes to study the adsorbability of the material. Adsorption kinetics and isotherms were also studied to further investigate the adsorption capacity and mechanism of Fe3O4–pDMC in the removal of organic acidic dyes. The regeneration capability of Fe3O4–pDMC was discussed to demonstrate its application prospects.
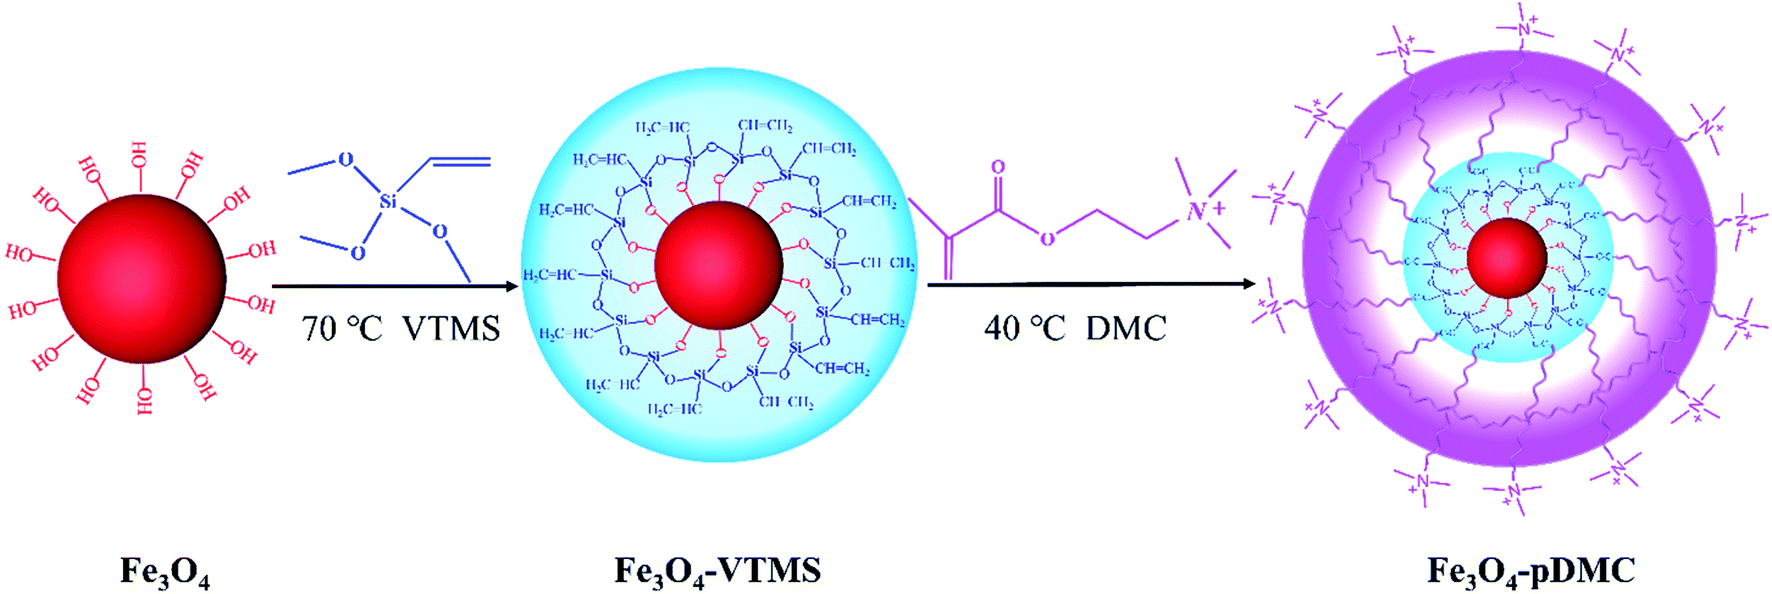 | ||
| Scheme 1 Preparation process of the Fe3O4–pDMC adsorbent via the surface functionalization of Fe3O4 with the abundant amine groups of DMC. | ||
2. Materials and methods
2.1. Chemicals and materials
Fe3O4 MNPs (99.0%), VTMS (purum >98.0%), N,N′-methylene diacrylamide, polyvinylsulfuric acid potassium salt (PVSK), poly dimethyl diallyl ammonium chloride (PDDA), toluidine blue (TB) and DMC (75.0% w/w) were obtained from Aladdin Co., Ltd. (Shanghai, China). Anhydrous ethanol (purum >99.7%), ethylenediaminetetraacetic acid tetrasodium salt and isopropyl alcohol (purum >99.7%) were purchased from Jinshan Chemical Reagent Co., Ltd. (Chengdu, China). Potassium persulfate (KPS), sodium hydrogen sulfite (NaHSO3), AO7, and DB15 were obtained from Kelong Chemical Reagent Co., Ltd. (Chengdu, China). All chemicals were of analytical reagent grade.2.2. Synthesis of Fe3O4–pDMC
The preparation protocol for the Fe3O4–pDMC adsorbent included two main steps. First, Fe3O4–VTMS was prepared by dispersing 1 g of Fe3O4 MNPs with 5 mL of VTMS in 50 mL of isopropyl alcohol. The suspension was refluxed for 6 h under mechanical stirring at 300 rpm and 70 °C. Subsequently, the solid product was separated by magnetic decantation and rinsed several times with portions of an ethanol/H2O mixture (1![[thin space (1/6-em)]](https://www.rsc.org/images/entities/char_2009.gif) :1, v/v) then dried at 60 °C. Second, Fe3O4–pDMC was prepared via free radical polymerization between Fe3O4–VTMS and DMC. A total of 0.50 g of Fe3O4–VTMS was suspended in 20 mL of ultrapure water, and 2.50 g of DMC, 0.06 g of KPS, and 0.02 g of NaHSO3 predissolved in 10 mL of ultrapure water were added dropwise successively into the mixture within 10 min. Then, the reaction was maintained at 40 °C for 8 h. Finally, the synthesized Fe3O4–pDMC was obtained via magnetic separation, rinsed several times with portions of the ethanol/H2O mixture (1:1, v/v), and dried at 40 °C.
:1, v/v) then dried at 60 °C. Second, Fe3O4–pDMC was prepared via free radical polymerization between Fe3O4–VTMS and DMC. A total of 0.50 g of Fe3O4–VTMS was suspended in 20 mL of ultrapure water, and 2.50 g of DMC, 0.06 g of KPS, and 0.02 g of NaHSO3 predissolved in 10 mL of ultrapure water were added dropwise successively into the mixture within 10 min. Then, the reaction was maintained at 40 °C for 8 h. Finally, the synthesized Fe3O4–pDMC was obtained via magnetic separation, rinsed several times with portions of the ethanol/H2O mixture (1:1, v/v), and dried at 40 °C.
As control, the poly methacryloxyethyltrimethyl ammonium chloride material (pDMC) was prepared based on radical polymerization, and the detail was described in Text S1.†
2.3. Characterization
The morphological analysis of Fe3O4, Fe3O4–VTMS, and Fe3O4–pDMC was carried out via transmission electron microscopy by using FEI Talos F200X (FEI Company, USA). XRD patterns were identified with a Bruker D8 ADVANCE diffractometer (Bruker, Germany) with graphite monochromatized Cu-Kα radiation (λ = 1.54056 Å), a step size of 0.02° 2θ, and a counting rate of 0.12° per step from 10° to 80°. FTIR spectra were recorded on a Nicolet iS10 FTIR spectrometer (Thermo Fisher Scientific, USA) with KBr disks in the wave number range of 500–4000 cm−1. X-ray photoelectron spectroscopy (XPS) spectra were obtained by using the XPS spectrometer Escalab 250Xi (Thermo Fisher Scientific, USA) with Al-Kα X-ray as the excitation source. The organic loading in Fe3O4–pDMC was measured via thermogravimetric analysis (TGA) performed with a TGA8000 analyzer (PerkinElmer, USA) at a heating rate of 10 °C min−1 from 50 °C to 600 °C under nitrogen atmosphere. The concentration of cationic groups on the surface of the sample was determined by colloidal titration. N2 adsorption–desorption isotherms were obtained at 77 K with an Autosorb-1 nitrogen adsorption apparatus (Quantachrome, USA). Specific surface areas were calculated in accordance with the Brunauer–Emmett–Teller (BET) equation from the linear part of the BET plot. Magnetic hysteresis loops were determined by utilizing a vibrating sample magnetometer (VSM) PPMS-9 (Quantum Design Inc, USA) at room temperature. Zeta potentials were measured on a NanoBrook Omni analyzer (Brookhaven, USA) after the materials were diluted in water after 5 min of sonication.2.4. Adsorption experiments
The adsorption properties of Fe3O4–pDMC were investigated through batch adsorption experiments, and AO7 and DB15 were chosen as the target contaminants. All the adsorption experiments were conducted initially in 100 mL conical flasks at 150 rpm. A total of 10 mg of Fe3O4–pDMC adsorbent was added to 50 mL of dye solution with a preset pH value. To study the effect of solution pH on anionic dyes removal, the reaction was performed varying pH from 3.0 to 10.0 with an initial dye concentration of 50 mg L−1 for 30 min. To examine the high adsorption capacity of the Fe3O4–pDMC, pure Fe3O4 and pDMC were used to conduct the control experiment. Adsorption isotherm studies were performed by varying dye concentrations from 50 mg L−1 to 400 mg L−1 at pH 3.0 for 30 min. Adsorption kinetics were studied by changing the reaction time from 0.5 min to 120 min at pH 3.0 with the dye concentration of 50 mg L−1. After adsorption, magnetic separation with a permanent magnet was performed to separate the adsorbents from the solution. The initial and residual concentrations of dyes in the solution were determined by using a UV-visible spectrophotometer at λmax = 484 nm (for AO7) and λmax = 600 nm (for DB15). The adsorption capacity of the adsorbents (qt) and removal efficiency (E) can be calculated by using eqn (1) and (2), respectively.
 | (1) |
 | (2) |
2.5. Desorption and reusability studies
10 mg of Fe3O4–pDMC was added into 50 mL of AO7 or BD15 solution with the initial concentration of 50 mg L−1 at pH 3.0 and stirred at 25 °C and 150 rpm for 30 min to inspect the desorption properties of Fe3O4–pDMC. Subsequently, the saturated Fe3O4–pDMC was magnetically separated from the solution, washed with distilled water, and dried at 40 °C. For the desorption experiment, the saturated Fe3O4–pDMC was immersed in 10 mL of ethanol solution under ultrasound for 30 min. Then, the regenerated Fe3O4–pDMC was washed with distilled water and dried in an oven before the readsorption tests. The removal efficiency in each cycle was recorded.3. Results and discussion
3.1. Characterization of the Fe3O4–pDMC adsorbent
The morphologies of Fe3O4, Fe3O4–VTMS, and Fe3O4–pDMC were detected by TEM and shown in Fig. 1. In contrast to Fe3O4, Fe3O4–pDMC retained a uniform and consistent spherical shape, illustrating that the preparation process of Fe3O4–pDMC was mild and manageable. The average diameters of Fe3O4–pDMC calculated by nano measure was 11.53 nm (Fig. S1†). Moreover, the small particle size of Fe3O4–pDMC (particle size <20 nm) indicated that Fe3O4–pDMC was a superparamagnetic material.32–34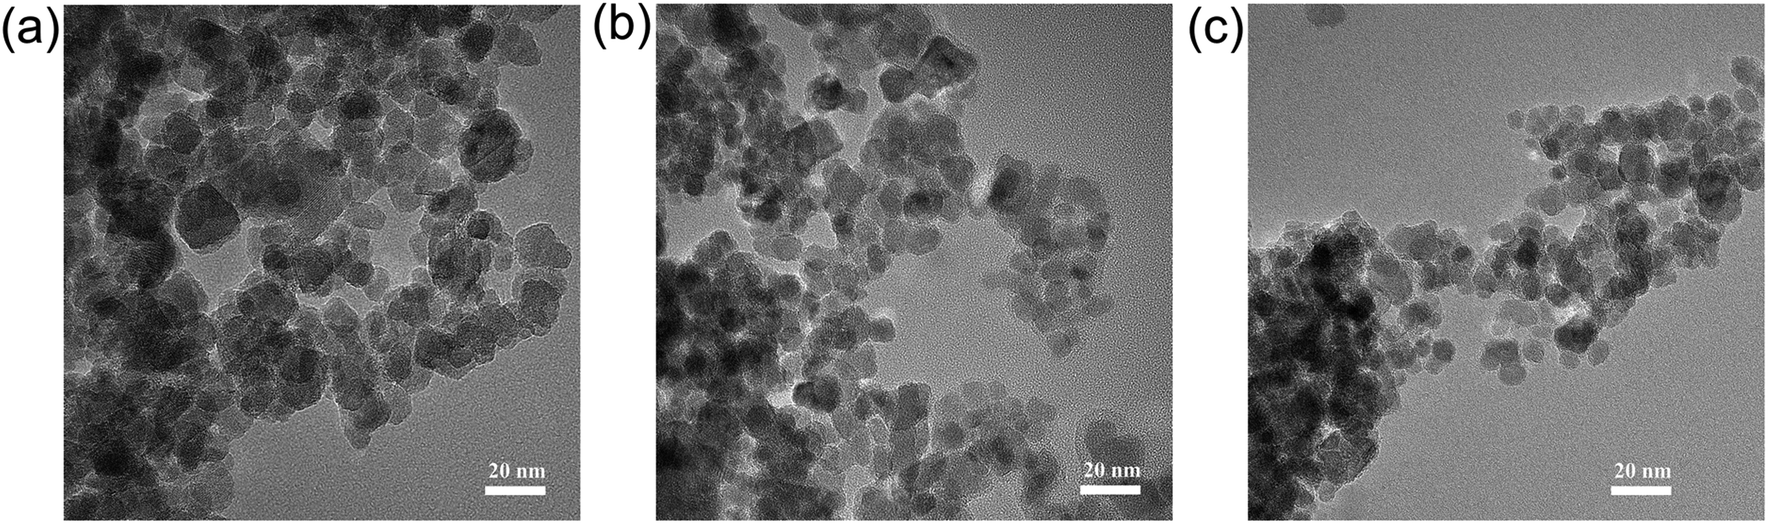 | ||
| Fig. 1 TEM images of (a) Fe3O4, (b) Fe3O4–VTMS, and (c) Fe3O4–pDMC (the scale bars for a, b, and c represent 20 nm). | ||
VSM analysis was conducted to further identify the magnetic properties of Fe3O4–pDMC, and the results are shown in Fig. S2† and Table 1. The saturation magnetization values of Fe3O4, Fe3O4–VTMS, and Fe3O4–pDMC obtained at room temperature were 53.32, 50.50, and 40.73 emu g−1, respectively. Although the saturation magnetization of Fe3O4–pDMC decreased slightly compared with that of Fe3O4, it still remained relatively high. This characteristic could significantly benefit separation after adsorption. Additionally, the remanent magnetization, field coercivity, and remanence magnetization ratio of Fe3O4–pDMC were negligibly 1.94 emu g−1, 74.15 Oe, and 0.0476, respectively, indicating that Fe3O4–pDMC exhibited superparamagnetism. In addition, no hysteresis loop was observed in the magnetization curves of Fe3O4–pDMC. These results illustrated that the Fe3O4–pDMC adsorbent could not only possess good magnetic separation characteristic but also avoid self-aggregation.
| Sample | Saturation magnetization Ms (emu g−1) | Remanent magnetization Mr (emu g−1) | Coercivity Hc (Oe) | Remanence ratio Mr/Ms |
|---|---|---|---|---|
| Fe3O4 | 53.32 | 1.25 | 22.29 | 0.0234 |
| Fe3O4–VTMS | 50.50 | 1.16 | 18.61 | 0.0230 |
| Fe3O4–pDMC | 40.73 | 1.94 | 74.15 | 0.0476 |
The XRD patterns of pure Fe3O4, Fe3O4–VTMS, and Fe3O4–pDMC are shown in Fig. 2a. A series of diffraction peaks at approximately the 2θ of 30.1°, 35.5°, 43.2°, 54.2°, 57.0°, and 62.7° were found in the XRD patterns of Fe3O4 and were assigned to the (200), (311), (400), (422), (511), and (440) planes of cubic MNPs with the Fd![[3 with combining macron]](https://www.rsc.org/images/entities/char_0033_0304.gif) m space group, respectively.35 The characteristic peaks in Fe3O4–VTMS and Fe3O4–pDMC were retained, indicating that the preparation condition of Fe3O4–pDMC was mild and the crystal phases of Fe3O4 remained stable after the immobilization of pDMC.
m space group, respectively.35 The characteristic peaks in Fe3O4–VTMS and Fe3O4–pDMC were retained, indicating that the preparation condition of Fe3O4–pDMC was mild and the crystal phases of Fe3O4 remained stable after the immobilization of pDMC.
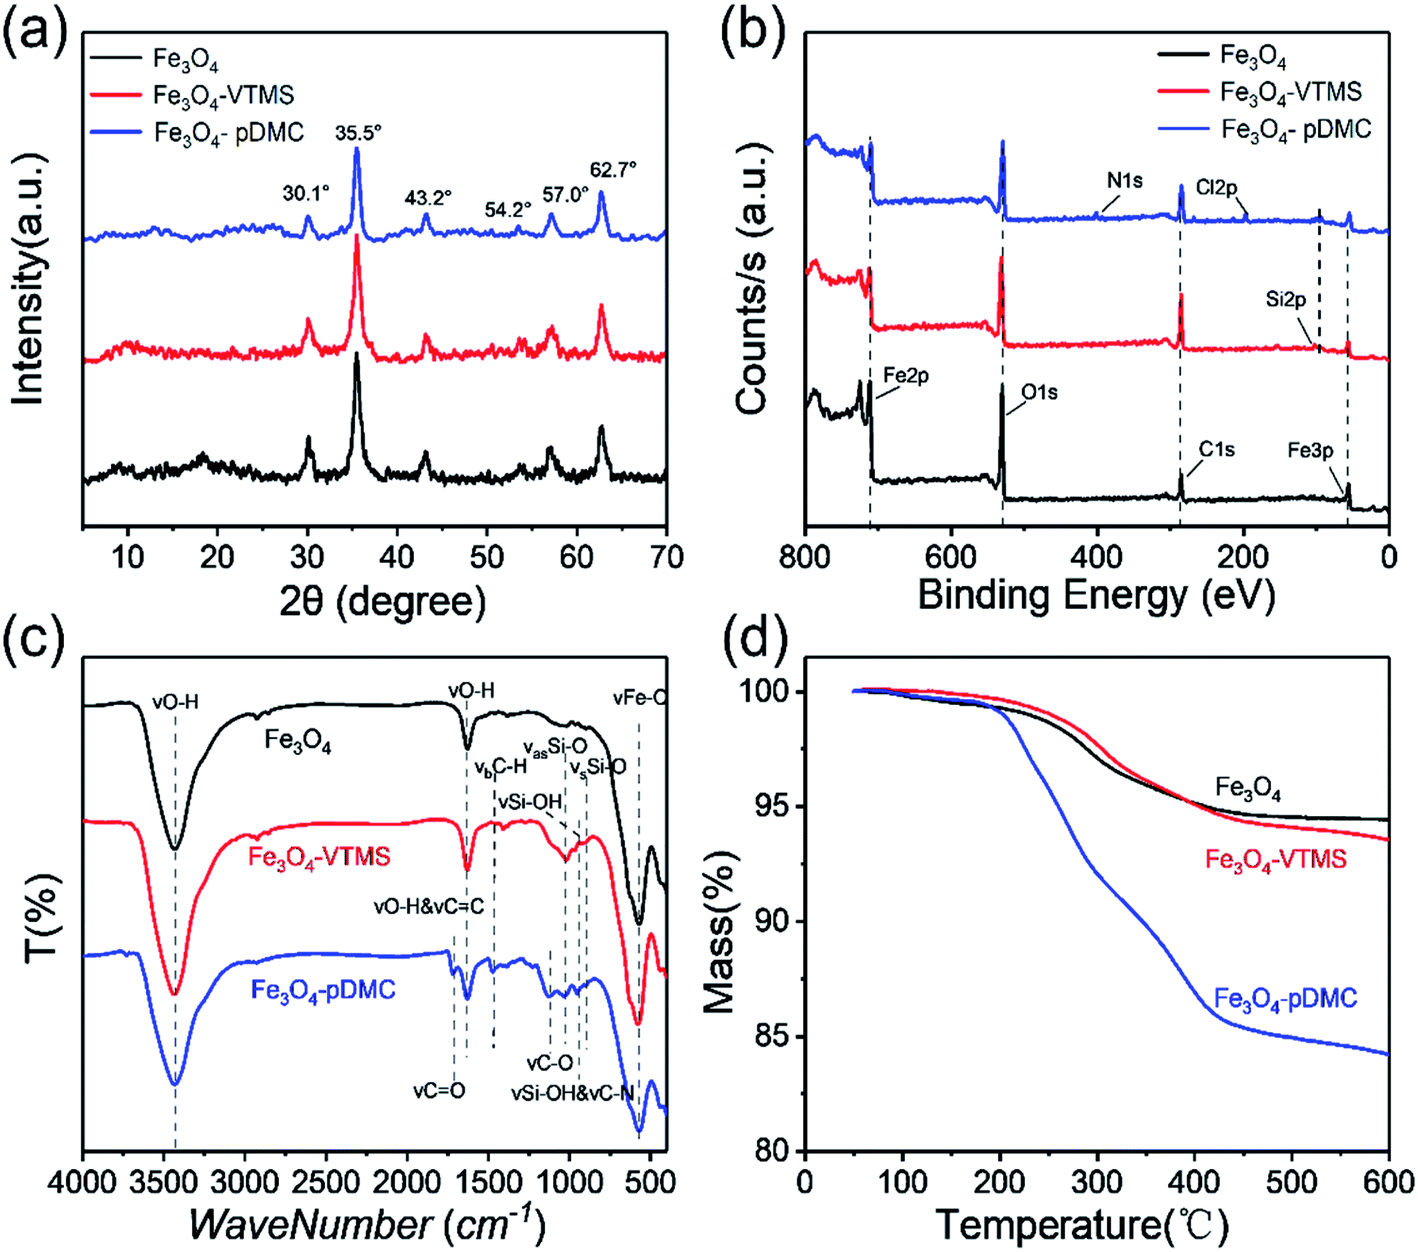 | ||
| Fig. 2 Characterization results of Fe3O4, Fe3O4–VTMS, and Fe3O4–pDMC: (a) XRD patterns, (b) XPS scanned spectra, (c) FTIR spectra, and (d) TGA curves (N2 atmosphere, scan rate of 10 °C min−1). | ||
The surface properties of Fe3O4, Fe3O4–VTMS, and Fe3O4–pDMC were further investigated through the N2 adsorption–desorption technique and presented in Fig. S3.† The calculated specific surface areas of Fe3O4, Fe3O4–VTMS, and Fe3O4–pDMC were 104.5, 86.7, and 35.7 m2 g−1, respectively. Additionally, the qualitative analysis of chemical elements was conducted on the basis of XPS scanned spectra (Fig. 2b). The new peak of Si in Fe3O4–VTMS and Fe3O4–pDMC samples suggested that a reaction occurred between Fe3O4 and VTMS, and the new peaks of N 1s and Cl 2p in Fe3O4–pDMC illustrated the successful grafting of DMC.
The FT-IR spectra were used for the investigation of the surface functional groups of Fe3O4, Fe3O4–VTMS, and Fe3O4–pDMC and are presented in Fig. 2c. In the FT-IR spectrum of Fe3O4, the peaks at 3432 and 1630 cm−1 were attributed to the stretching vibrations of –OH bonds and the OH stretching vibrations of H2O that had adsorbed on Fe3O4.36 A typical absorption peak at 570 cm−1 was ascribed to the stretching vibrations of the Fe–O bond.37 In the spectrum of Fe3O4–VTMS, four new adsorption peaks at 1403, 1018, 957, and 887 cm−1 corresponded to C–H bending vibration, Si–O–Si asymmetric stretching vibration, external Si–OH vibration, and Si–O–Si symmetric stretching vibration, respectively.38 Meanwhile, the broadening of the absorption band at 1630 cm−1 was attributed to the superposition of C![[double bond, length as m-dash]](https://www.rsc.org/images/entities/char_e001.gif) C stretching vibration in the presence of VTMS. The additional absorption bands that appeared at 1718 and 1127 cm−1 in the spectrum of Fe3O4–pDMC but not in that of Fe3O4–VTMS were related to the stretching vibration of the CO bond and the stretching vibration of the C–O of the ester group.39 In addition, the slight intensification of the absorption band at approximately 957 cm−1 could be associated with the stretching vibration of C–N.39 Consequently, the appearance of these peaks indicated that the organic polymer DMC was successfully immobilized on the surfaces of Fe3O4 nanoparticles.
C stretching vibration in the presence of VTMS. The additional absorption bands that appeared at 1718 and 1127 cm−1 in the spectrum of Fe3O4–pDMC but not in that of Fe3O4–VTMS were related to the stretching vibration of the CO bond and the stretching vibration of the C–O of the ester group.39 In addition, the slight intensification of the absorption band at approximately 957 cm−1 could be associated with the stretching vibration of C–N.39 Consequently, the appearance of these peaks indicated that the organic polymer DMC was successfully immobilized on the surfaces of Fe3O4 nanoparticles.
The TGA curves of Fe3O4, Fe3O4–VTMS, and Fe3O4–pDMC are shown in Fig. 2d. All samples exhibited two distinct stages from 50 °C to 600 °C under nitrogen. The first slight weight losses in the three samples occurred below 180 °C and were due to the release of physically adhered water. The second stage of mass loss (approximately 5.56%) for Fe3O4 was observed between 180 °C and 450 °C and was attributed to the decomposition of iron hydroxide molecules that had superficially attached to the nanoparticles. Mass remained unchanged between 450 °C and 600 °C. This result demonstrated the good thermal stability of Fe3O4. At the second stage, Fe3O4–VTMS exhibited 7.14% weight loss from 180 °C to 600 °C. This phenomenon might correspond to the removal of the traces of iron hydroxide molecules and the degradation of the VTMS layer. The weight loss of Fe3O4–pDMC in the second stage from 180 °C to 600 °C increased rapidly to 15.2%. This weight loss change could be ascribed to the increase in the degradation of the polymeric backbones of the nanocomposites due to the presence of abundant pDMC. Furthermore, as shown in Table S1,† the concentration of surface cationic groups of Fe3O4–pDMC was up to 298.5 μmol g−1, indicating there are large quantity quaternary ammonium groups on the synthesized Fe3O4–pDMC as well. Overall, the results confirmed that Fe3O4–pDMC was successfully prepared through the successive immobilization of VTMS and DMC on Fe3O4 nanoparticles.
3.2. Effect of solution pH on adsorption
Generally, solution pH is an important parameter that affects adsorption capacity by changing the surface properties of the adsorbent and the ionization of anionic dyes. Therefore, the effect of solution pH on the adsorption of AO7 and DB15 were investigated in the pH range of 3.0 to 10.0, and the results are presented in Fig. 3. The removal efficiency of AO7 and DB15 by Fe3O4 decreased sharply with the increase in initial pH mainly because the isoelectric point (pHzp) of Fe3O4 was approximately 6.3. When the solution pH was less than pHzp, Fe3O4 was positively charged and underwent electrostatic interaction with AO7 and DB15. By contrast, Fe3O4 was negatively charged when the solution pH was higher than pHzp and showed electrostatic repulsion with AO7 and DB15. The maximum removal efficiency at the pH of 3.0 was 27% and 32%. The low removal rate was ascribed to the few adsorption sites of Fe3O4. In addition, nearly all the AO7 and DB15 were adsorbed by the pure pDMC in the pH range of 3.0–10.0 (Fig. S4†), indicating that the high removal rates of AO7 and DB15 by Fe3O4–pDMC were mainly depended on the introduction of quaternary ammonium groups onto the surface of Fe3O4. Besides, the introduction of Fe3O4 in Fe3O4–pDMC could endow the excellent magnetic separation after adsorption (Fig. S5†). Notably, the removal efficiency of Fe3O4–pDMC for DB15 was higher than that for AO7 likely because DB15 was more negatively charged than AO7. These phenomena suggested that electrostatic attraction could be the dominant mechanism underlying the removal of anionic dye molecules by Fe3O4–pDMC from wastewater.40 The increment in solution pH weakened the electrostatic interaction between adsorbents and dyes, leading to competition between excess hydroxide ions and anionic dye molecules in the occupation of the adsorption sites of adsorbents.41,42 But the surface zeta potential of the synthesized Fe3O4–pDMC adsorbents possessing numerous quaternary ammonium groups enabled retaining the high positive charge level at the studied pH range. Therefore, the dominant AO7 and DB15 uptake sites on Fe3O4–pDMC were the protonated quaternary ammonium groups, and Fe3O4–pDMC had a desirable adsorption performance over a wide pH range for the adsorption of AO7 and DB15.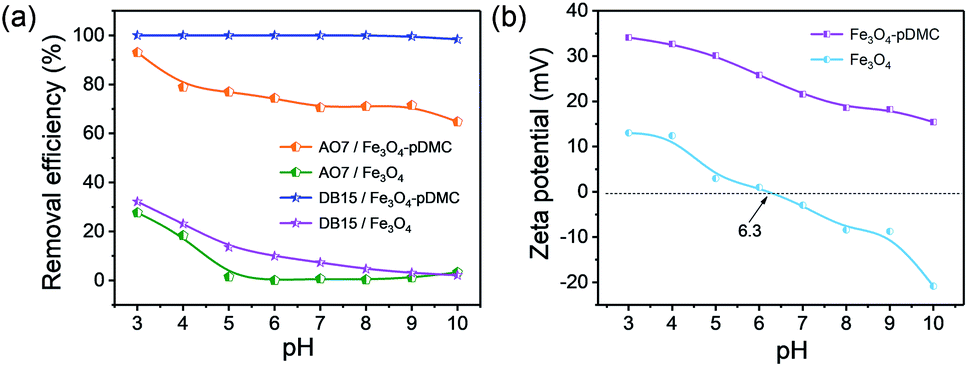 | ||
| Fig. 3 (a) Effect of solution pH on the adsorption of AO7 and DB15 by Fe3O4 and Fe3O4–pDMC, respectively. (b) Zeta potentials/pH profiles of Fe3O4 and Fe3O4–pDMC. | ||
3.3. Adsorption isotherms
Adsorption isotherms play an important role in understanding the qualitative information on the adsorption capacity of adsorbents and the distribution of adsorbates between liquid and solid phases when adsorption reaches equilibrium.43,44 The effects of dye concentration on adsorption capacity were studied and are illustrated in Fig. 4a. The adsorption capacity of AO7 and DB15 increased significantly and plateaued with the increase in initial dye concentrations. In addition, as the temperature increased, the equilibrium adsorption capacity of AO7 and DB15 increased (Fig. S6†), indicating that the adsorption process of anionic dyes onto Fe3O4-pDMC was an endothermic process, and increasing the temperature was conducive to the adsorption process. Fe3O4–pDMC clearly showed high adsorption capacity for AO7 and DB15 in aqueous solutions because of its abundant quaternary ammonium groups. As shown in Table 2, the maximum adsorption capacities of Fe3O4–pDMC for AO7 and DB15 were 266.78 and 336.53 mg g−1, respectively, and were much higher than those of other reported adsorbents (Table S2†).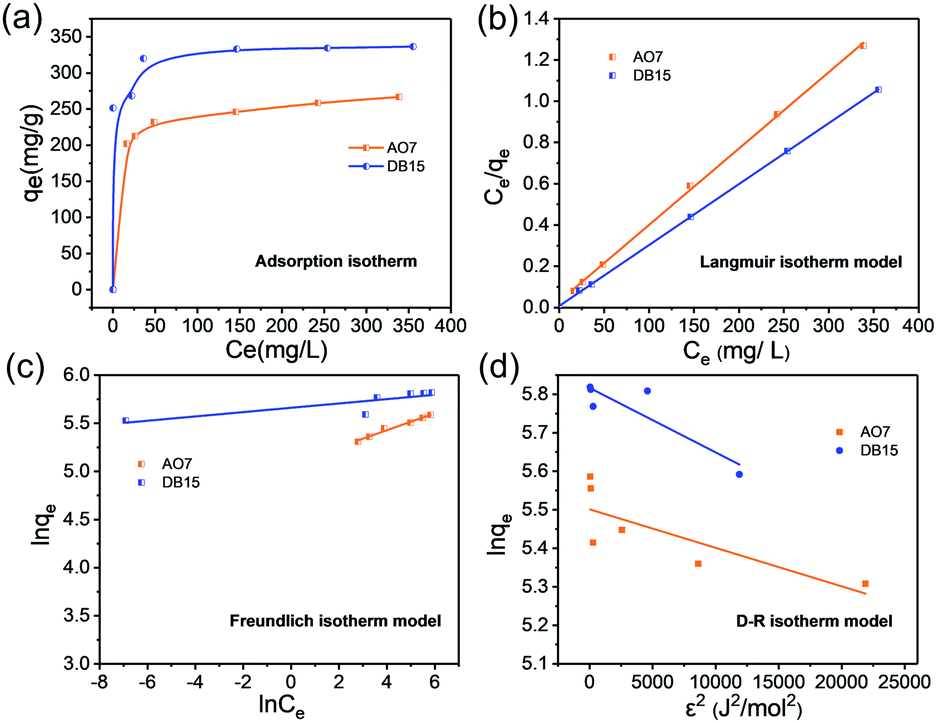 | ||
| Fig. 4 (a) Adsorption isotherms of AO7 and DB15 by Fe3O4–pDMC. (b) Fitting curves of the Langmuir model. (c) Fitting curves of the Freundlich model. (d) Fitting curves of the Dubinin–Radushkevich (D–R) model. | ||
| Anionic dye kind | qe,exp (mg g−1) | Langmuir model | Freundlich model | D–R model | ||||||
|---|---|---|---|---|---|---|---|---|---|---|
| qm (mg g−1) | kL (L mg−1) | R2 | n | KF | R2 | qD (mg g−1) | KD × 10−5 (mol2 kJ−2) | R2 | ||
| Acid orange 7 | 266.78 | 270.27 | 0.1211 | 0.9992 | 11.3921 | 160.2684 | 0.9804 | 245.00 | 1.0004 | 0.6299 |
| Direct blue 15 | 336.53 | 338.98 | 0.3846 | 0.9998 | 45.5038 | 287.3497 | 0.7181 | 335.86 | 1.6761 | 0.8017 |
Langmuir, Freundlich, and Dubinin–Radushkevich (D–R) isotherm models were applied in the analysis of experimental equilibrium adsorption data to describe the adsorption characteristics of anionic dyes onto Fe3O4–pDMC.45,46 These models were expressed as eqn (3)–(5) as follows:
Langmuir:
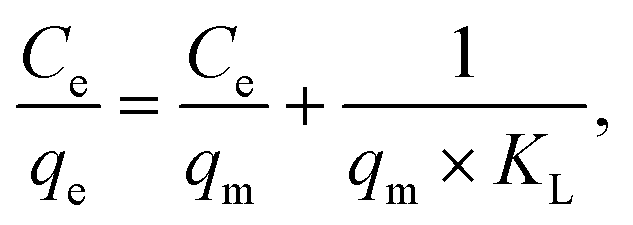 | (3) |
Freundlich:
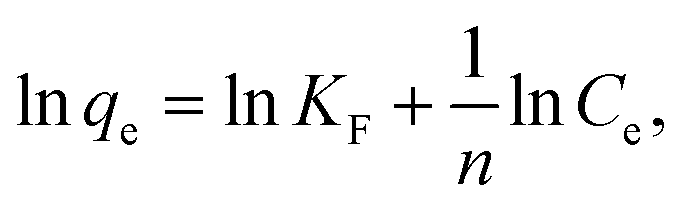 | (4) |
D−R:
|
lnqe = lnqm − KD × ε2,
| (5) |
ln[1 + 1/Ce]). R (J mol−1 K−1) is the gas constant, and T (K) is the thermodynamic temperature.
The fitted plots and isothermal parameters of each model are shown in Fig. 4b–d and Table 2. The correlation coefficients (R2) for the Langmuir model of AO7 (RAO72 = 0.9992) and DB15 (RDB152 = 0.9998) were higher than those of the Freundlich model and the D–R model. In addition, the qm values for the adsorption of AO7 and DB15 on the magnetic nanocomposite calculated by the Langmuir model were 270.27 and 338.98 mg g−1, respectively, which were consistent with those obtained through experiments. These results indicated that the adsorption of anionic dye on Fe3O4–pDMC could be better described by the Langmuir model than by the other models. In addition, the affinity between anionic dyes and Fe3O4–pDMC could be predicted by using a dimensionless constant separation factor (RL) calculated by the Langmuir model as defined in eqn (6):
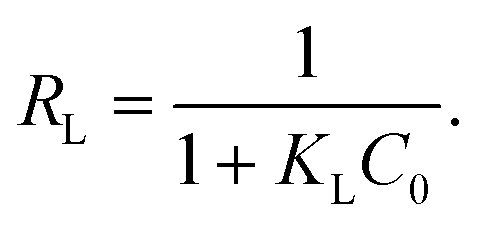 | (6) |
The values of RL indicated that the essential characteristic of the Langmuir isotherm type was either unfavorable (RL > 1), linear (RL = 1), favorable (0 < RL < 1), or irreversible (RL = 0).47,48
As shown in Fig. S7,† the RL values of the adsorption of AO7 and DB15 on Fe3O4–pDMC were smaller than 0.15, showing that the adsorption of anionic dyes on Fe3O4–pDMC was a favorable process. Furthermore, the RL values decreased as the initial concentrations of AO7 and DB15 were increased. This behavior indicated that high anionic dye concentration was beneficial to adsorption.
3.4. Adsorption kinetics
The effect of contact time on the removal rates of Fe3O4–pDMC for AO7 and DB15 in single and binary solutions were studied and are illustrated in Fig. 5. In the single dye solution, more than 58.6% of AO7 and 98.1% of DB15 were adsorbed during the first 1 min. This result was better than the results obtained for many other reported adsorbents.49–52 Notably, the adsorption equilibrium of DB15 was reached at 10 min, which was shorter than the time to the adsorption equilibrium of AO7 (60 min). In the binary dye solutions, the removal rate of DB15 remained close to 95.6% in the first 1 min, whereas only 33.8% of AO7 was adsorbed under the same conditions, indicating that Fe3O4–pDMC exhibited superior adsorption for DB15 in the competition system. Notably, in the single and binary solution systems, the removal rate of DB15 rapidly approached 100% and was considerably higher than that of AO7 in each time period. These phenomena were ascribed to the higher numbers of anionic groups and stronger negative charge of DB15 than those of AO7.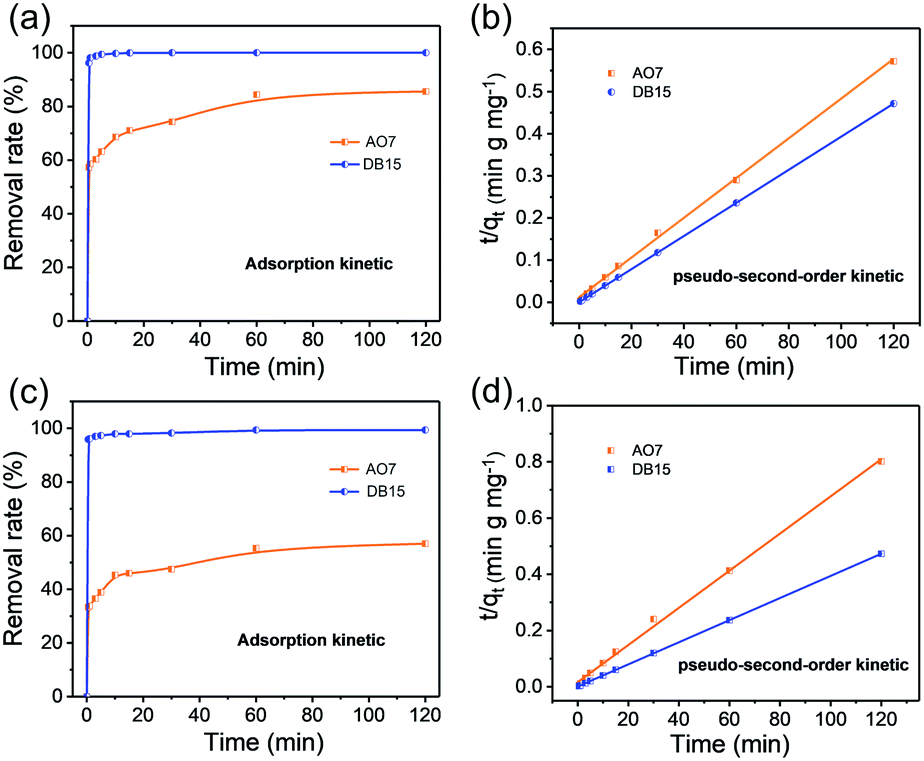 | ||
| Fig. 5 (a) and (c) Adsorption kinetics of AO7 and DB15 by Fe3O4–pDMC in single dye and binary dye systems. (b) and (d) Fitting curves of the pseudo-second-order kinetic model in single dye and binary dye system. | ||
The pseudo-first-order, pseudo-second-order, and intraparticle diffusion kinetic models were adopted to analyze the adsorption data to study the dynamics of single and binary solution adsorption and are shown in eqn (7)–(9), respectively.53–55
Pseudo-first-order equation:
|
ln(qe − qt) = lnqe − k1t,
| (7) |
Pseudo-second-order equation:
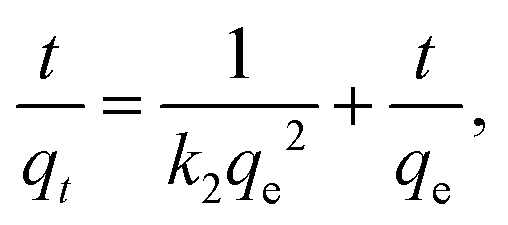 | (8) |
Intraparticle diffusion equation:
| qt = ki × t1/2 + c, | (9) |
The correlation coefficients of the pseudo-second-order kinetic model for the single and binary solutions were close to 1, which was higher than those of the pseudo-first-order and intraparticle diffusion kinetic models (Fig. S8, Tables S3 and S4†). This result indicated that the adsorption processes in the single and binary solutions fitted better to the pseudo-second-order kinetic model than to the other models and that the adsorption rate was mainly controlled by the chemical adsorption mechanism.47,56 The qe,cal values of AO7 and DB15 calculated from the pseudo-second-order model in the single and binary solutions were nearly consistent with the experimental qe,exp for the samples. Hence, the adsorption of anionic dyes on Fe3O4–pDMC in binary and single solutions could be better described by the pseudo-second-order kinetic model than the pseudo-first-order and intraparticle diffusion kinetic models. In addition, the rate constants of the pseudo-second-order model of AO7 and DB15 in the binary solution were 27.26 × 10⁻⁴ and 163.33 × 10⁻⁴ (g mg−1 min−1), respectively. The adsorption velocity of DB15 was suggested to be considerably higher than that of AO7, and DB15 molecules were highly likely to bind to quaternary ammonium groups on the surfaces of Fe3O4–pDMC. In summary, Fe3O4–pDMC exhibited a strong affinity with anionic dyes with negative charges. This characteristic could accelerate adsorption equilibrium.
3.5. Possible mechanism of the adsorption of anionic dyes
Fe3O4–pDMC before and after adsorption was measured to investigate the possible mechanism of AO7 and DB15 removal by Fe3O4–pDMC. XPS peaks corresponding to the C, O, N, Si, and Fe of Fe3O4–pDMC before and after adsorption were analyzed for the assessment of the contributions of each component and shown in Fig. 6. The XPS spectra indicated that C, O, N, and Fe appeared on the surfaces of the three samples, and N atom concentrations slightly increased after adsorption because of the adsorption of AO7 and DB15. The N 1s spectrum of Fe3O4–pDMC before adsorption was deconvoluted into the peaks at 402.2 eV, which were assigned to –N+(CH3)3. The new peak at 400.03 eV in the N 1s spectrum after AO7 adsorption was attributed to theN– of AO7. The new peaks at 401.53 and 399.42 eV in the N 1s spectrum after DB15 adsorption were attributed to the characteristic –NH2 and N– of DB15. Moreover, the binding energy of the –N+(CH3)3 of Fe3O4–pDMC after AO7 and DB15 adsorption changed from 402.2 eV to 402.87 and 402.68 eV, respectively, and the relative area percentages of –N+(CH3)3 decreased after adsorption. These results suggested that quaternary ammonium groups were involved in the adsorption of AO7 and DB15 onto Fe3O4–pDMC. Moreover, the surface charges of Fe3O4–pDMC decreased from 28.48 mV to 17.61 and 7.34 mV after the adsorption of AO7 and DB15, respectively, indicating that a part of quaternary ammoniums were occupied by anionic dyes and that electrostatic attraction mainly contributed to the removal of AO7 and DB15. These findings demonstrated that AO7 and DB15 abundantly accumulated over the surfaces of Fe3O4–pDMC via electrostatic interaction. The mechanism of adsorption is schematically illustrated in Fig. 7.
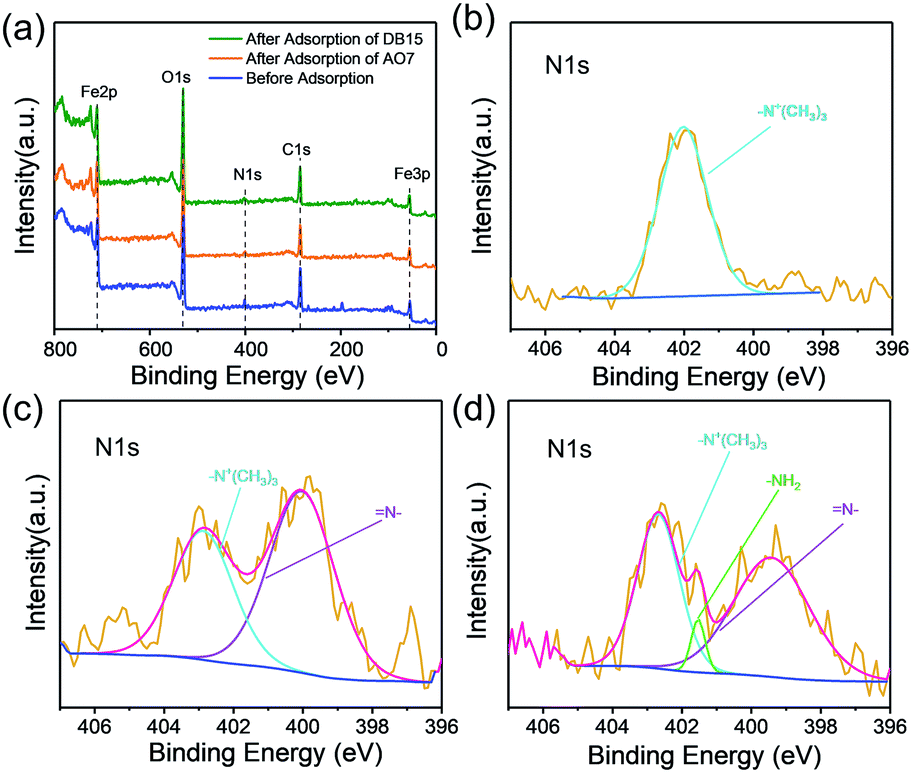 | ||
| Fig. 6 XPS spectra of Fe3O4–pDMC before and after AO7 and DB15 adsorption. (a) Survey spectra, (b) N 1s XPS spectra of Fe3O4–pDMC, (c) N 1s XPS spectra of AO7 adsorption by Fe3O4–pDMC, (d) N 1s XPS spectra of DB15 adsorption by Fe3O4–pDMC. | ||
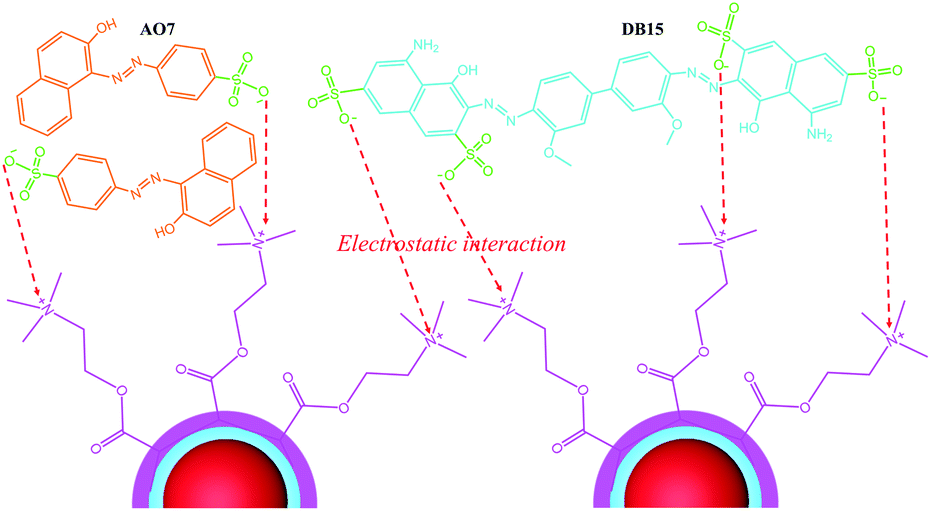 | ||
| Fig. 7 Schematic illustration of anionic dye adsorption by Fe3O4–pDMC. | ||
3.6. Regeneration and reusability studies on Fe3O4–pDMC
Reuse is a crucial factor for the practical use of advanced adsorbents. In this study, a simple method was applied for the regeneration of the utilized adsorbents. The adsorbents were immersed with 10 mL of ethanol for 30 min because AO7 and DB15 exhibited favorable solubility in ethanol. Then, the regenerated Fe3O4–pDMC was dried and reused for adsorption in subsequent cycles. As shown in Fig. 8, after five cycles, the recovery efficiency for AO7 and DB15 continued to exceed 72.4% and 88.5%, respectively, indicating that Fe3O4–pDMC had good regeneration capability. Therefore, the prepared Fe3O4–pDMC could be used several times as a potential adsorbent for the removal of anionic dyes in wastewater treatment.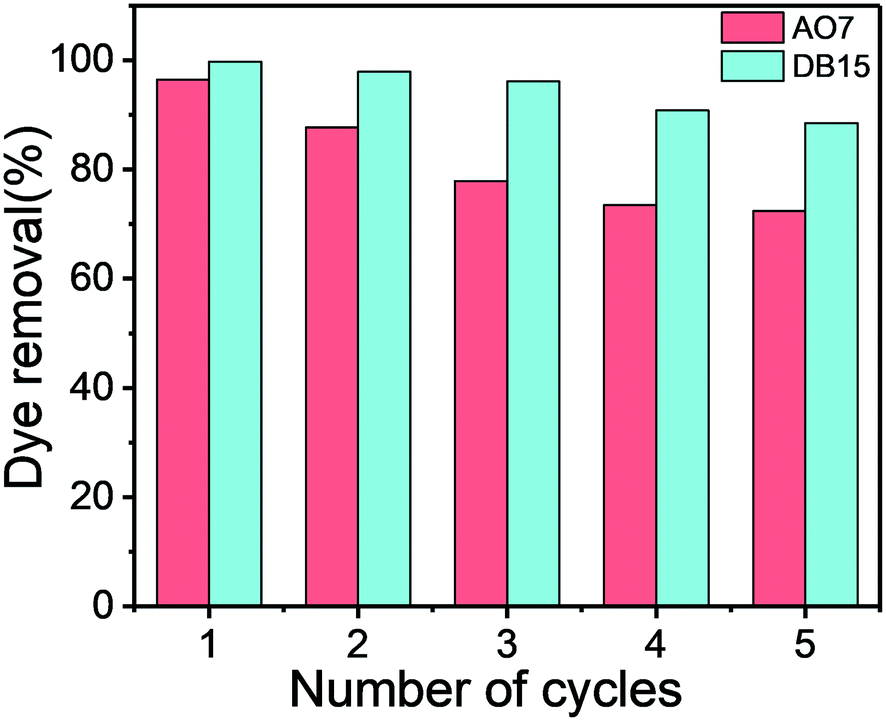 | ||
| Fig. 8 Reusability of Fe3O4–pDMC for AO7 and DB15 adsorption. | ||
4. Conclusions
An ingenious Fe3O4–pDMC adsorbent was successfully synthesized by grafting DMC on the surfaces of Fe3O4 through free radical polymerization. The prepared Fe3O4–pDMC exhibited excellent adsorption for anionic dyes mainly because of the introduction of abundant quaternary ammonium groups on its surfaces. In addition, the adsorption of AO7 and DB15 on Fe3O4–pDMC could be described by the pseudo-second-order and Langmuir models. The mechanism of AO7 and DB15 adsorption might be ascribed to electrostatic interactions between dye molecules and Fe3O4–pDMC so that Fe3O4–pDMC exhibited a better affinity with more negatively charged anionic dyes in the mixture solutions. Furthermore, Fe3O4–pDMC performed a high efficiency in magnetic separation and good reusability in multiple adsorption–desorption cycles. This study provided new insight into the design of an effective adsorbent for the removal of anionic dyes. And Fe3O4–pDMC is a potential adsorbent for application in real wastewater given its advantages of excellent adsorption capability, outstanding magnetic separation, and good reusability.Conflicts of interest
There are no conflicts to declare.Acknowledgements
This work was supported by the National Key Research and Development Program of China (2019YFC1904501), the National Natural Science Foundation of China (21476149), the Innovation Team Program of Science & Technology Department of Sichuan Province (grant 2017TD0010).Notes and references
- K. G. Pavithra, P. Senthil Kumar, V. Jaikumar and P. Sundar Rajan, J. Ind. Eng. Chem., 2019, 75, 1–19 CrossRef CAS.
- S. N. Jain, S. R. Tamboli, D. S. Sutar, S. R. Jadhav, J. V. Marathe, A. A. Shaikh and A. A. Prajapati, J. Cleaner Prod., 2020, 252 DOI:10.1016/j.jclepro.2019.119778.
- S. Samsami, M. Mohamadi, M.-H. Sarrafzadeh, E. R. Rene and M. Firoozbahr, Process Saf. Environ. Prot., 2020, 143, 138–163 CrossRef CAS.
- M. M. Hassan and C. M. Carr, Chemosphere, 2018, 209, 201–219 CrossRef CAS.
- C. M. Carvalho da Cruz Brambilla, A. L. Hilario Garcia, F. Rabaioli da Silva, S. R. Taffarel, I. Grivicich, J. N. Picada, A. Scotti, D. Dalberto, M. Misik, S. Knasmuller and J. da Silva, Chemosphere, 2019, 217, 430–436 CrossRef CAS.
- M. F. Chowdhury, S. Khandaker, F. Sarker, A. Islam, M. T. Rahman and M. R. Awual, J. Mol. Liq., 2020, 318 DOI:10.1016/j.molliq.2020.114061.
- M. E. Mahmoud, A. E. H. Abdou, A. K. Shehata, H. M. A. Header and E. A. Hamed, J. Ind. Eng. Chem., 2018, 57, 28–36 CrossRef CAS.
- C. Feng, P. Ren, M. Huo, Z. Dai, D. Liang, Y. Jin and F. Ren, Carbohydr. Polym., 2020, 241, 116369 CrossRef CAS.
- N. R. J. Hynes, J. S. Kumar, H. Kamyab, J. A. J. Sujana, O. A. Al-Khashman, Y. Kuslu, A. Ene and B. Suresh Kumar, J. Cleaner Prod., 2020, 272 DOI:10.1016/j.jclepro.2020.122636.
- A. Azari, R. Nabizadeh, S. Nasseri, A. H. Mahvi and A. R. Mesdaghinia, Chemosphere, 2020, 250, 126238 CrossRef CAS.
- C. Patra, R. Gupta, D. Bedadeep and S. Narayanasamy, Environ. Pollut., 2020, 266, 115102 CrossRef CAS.
- L. Chen, N. Chen, H. Wu, W. Li, Z. Fang, Z. Xu and X. Qian, Sep. Purif. Technol., 2018, 207, 406–415 CrossRef CAS.
- S. Benkhaya, S. M’ rabet and A. El Harfi, Inorg. Chem. Commun., 2020, 115 DOI:10.1016/j.inoche.2020.107891.
- A. Chowdhury, S. Kumari, A. A. Khan and S. Hussain, J. Hazard. Mater., 2020, 385, 121602 CrossRef CAS.
- X. Huang, B. Li, S. Wang, X. Yue, Y. Zhengguo, X. Deng and J. Ma, Colloids Surf., A, 2020, 586 DOI:10.1016/j.colsurfa.2019.124163.
- H. Lee, J. Y. Kim, W. Choi and M. H. Moon, J. Chromatogr. A, 2017, 1503, 49–56 CrossRef CAS.
- J. Ma, K. Fu, X. Fu, Q. Guan, L. Ding, J. Shi, G. Zhu, X. Zhang, S. Zhang and L. Jiang, Sep. Purif. Technol., 2017, 182, 134–143 CrossRef CAS.
- C. S. Lee, J. Robinson and M. F. Chong, Process Saf. Environ. Prot., 2014, 92, 489–508 CrossRef CAS.
- H. Wei, B. Gao, J. Ren, A. Li and H. Yang, Water Res., 2018, 143, 608–631 CrossRef CAS.
- P. Hu, Z. Xi, Y. Li, A. Li and H. Yang, Chemosphere, 2020, 240, 124866 CrossRef CAS.
- H. Dai and H. Huang, Carbohydr. Polym., 2016, 148, 1–10 CrossRef CAS.
- T. Benhalima and H. Ferfera-Harrar, Int. J. Biol. Macromol., 2019, 132, 126–141 CrossRef CAS.
- D. Sarmah and N. Karak, Carbohydr. Polym., 2020, 242, 116320 CrossRef CAS.
- Y. Zhang, K. Xia, X. Liu, Z. Chen, H. Du and X. Zhang, J. Taiwan Inst. Chem. Eng., 2019, 102, 1–8 CrossRef CAS.
- Y. An, H. Zheng, Q. Sun, X. Zheng, W. Liu, X. Tang and Z. Xiong, J. Hazard. Mater., 2020, 384, 121262 CrossRef CAS.
- S. Liu, B. Yu, S. Wang, Y. Shen and H. Cong, Adv. Colloid Interface Sci., 2020, 281, 102165 CrossRef CAS.
- Y. P. Yew, K. Shameli, M. Miyake, N. B. B. Ahmad Khairudin, S. E. B. Mohamad, T. Naiki and K. X. Lee, Arabian J. Chem., 2020, 13, 2287–2308 CrossRef CAS.
- K. Zhou, X. Zhou, J. Liu and Z. Huang, J. Pet. Sci. Eng., 2020, 188 DOI:10.1016/j.petrol.2020.106943.
- A. Maleki, Z. Hajizadeh, V. Sharifi and Z. Emdadi, J. Cleaner Prod., 2019, 215, 1233–1245 CrossRef CAS.
- C. Liu, Y. Pi, G. Ju and Z. Wang, Desalin. Water Treat., 2019, 143, 256–267 CrossRef.
- M. Zirak, A. Abdollahiyan, B. Eftekhari-Sis and M. Saraei, Cellulose, 2017, 25, 503–515 CrossRef.
- U. Jeong, X. Teng, Y. Wang, H. Yang and Y. Xia, Adv. Mater., 2007, 19, 33–60 CrossRef CAS.
- B. K. Sodipo and A. A. Aziz, J. Magn. Magn. Mater., 2016, 416, 275–291 CrossRef CAS.
- J. Gadke, J. W. Thies, L. Kleinfeldt, T. Schulze, R. Biedendieck, I. Rustenbeck, G. Garnweitner, R. Krull and A. Dietzel, Eur. J. Pharm. Biopharm., 2018, 126, 67–74 CrossRef.
- M. S. Lima, J. F. Cruz-Filho, L. F. G. Noleto, L. J. Silva, T. M. S. Costa and G. E. Luz, J. Environ. Chem. Eng., 2020, 8 DOI:10.1016/j.jece.2020.104145.
- A. H. Karim, A. A. Jalil, S. Triwahyono, S. M. Sidik, N. H. Kamarudin, R. Jusoh, N. W. Jusoh and B. H. Hameed, J. Colloid Interface Sci., 2012, 386, 307–314 CrossRef CAS.
- Z. Kheilkordi, G. Mohammadi Ziarani and A. Badiei, Polyhedron, 2020, 178 DOI:10.1016/j.poly.2019.114343.
- M. H. R. Farimani, N. Shahtahmasebi, M. Rezaee Roknabadi, N. Ghows and A. Kazemi, Phys. E, 2013, 53, 207–216 CrossRef CAS.
- H. Deng, Y. Xu, Q. Chen, X. Wei and B. Zhu, J. Membr. Sci., 2011, 366, 363–372 CrossRef CAS.
- Q. Han, L. Chen, W. Li, Z. Zhou, Z. Fang, Z. Xu and X. Qian, Environ. Sci. Pollut. Res. Int., 2018, 25, 34438–34447 CrossRef CAS.
- L. P. Lingamdinne, J. R. Koduru, Y.-L. Choi, Y.-Y. Chang and J.-K. Yang, Hydrometallurgy, 2016, 165, 64–72 CrossRef CAS.
- B. Yu, L. He, Y. Wang and H. Cong, Material, 2017, 10 DOI:10.3390/ma10111239.
- P. Tang, Q. Sun, Z. Suo, L. Zhao, H. Yang, X. Xiong, H. Pu, N. Gan and H. Li, Chem. Eng. J., 2018, 344, 514–523 CrossRef CAS.
- X. Wang, Y. Wang, S. He, H. Hou and C. Hao, Ultrason. Sonochem., 2018, 40, 221–229 CrossRef CAS.
- Y. Li, H.-Y. Bi, X.-M. Mao, Y.-Q. Liang and H. Li, Appl. Clay Sci., 2018, 162, 230–238 CrossRef CAS.
- M. A. Al-Ghouti and D. A. Da'ana, J. Hazard. Mater., 2020, 393, 122383 CrossRef CAS.
- M. Saxena, N. Sharma and R. Saxena, Surf. Interfaces, 2020, 21 DOI:10.1016/j.surfin.2020.100639.
- S. Sadeghi, H. R. Zakeri, M. H. Saghi, S. K. Ghadiri, S. S. Talebi, M. Shams and G. L. Dotto, Environ. Sci. Pollut. Res., 2020 DOI:10.1007/s11356-020-10647-w.
- J. P. Silva, S. Sousa, I. Gonçalves, J. J. Porter and S. Ferreira-Dias, Sep. Purif. Technol., 2004, 40, 163–170 CrossRef CAS.
- M. Kousha, E. Daneshvar, M. S. Sohrabi, M. Jokar and A. Bhatnagar, Chem. Eng. J., 2012, 192, 67–76 CrossRef CAS.
- S. Noreen, U. Khalid, S. M. Ibrahim, T. Javed, A. Ghani, S. Naz and M. Iqbal, J. Mater. Res. Technol., 2020, 9, 5881–5893 CrossRef CAS.
- A. Thirunavukkarasu and R. Nithya, J. Taiwan Inst. Chem. Eng., 2020, 111, 44–62 CrossRef CAS.
- Z. Zhu, P. Wu, G. Liu, X. He, B. Qi, G. Zeng, W. Wang, Y. Sun and F. Cui, Chem. Eng. J., 2017, 313, 957–966 CrossRef CAS.
- J. L. Marco-Brown, L. Guz, M. S. Olivelli, B. Schampera, R. M. Torres Sánchez, G. Curutchet and R. Candal, Chem. Eng. J., 2018, 333, 495–504 CrossRef CAS.
- H. Yang, L. Bai, D. Wei, L. Yang, W. Wang, H. Chen, Y. Niu and Z. Xue, Chem. Eng. J., 2019, 358, 850–859 CrossRef CAS.
- N. Lu, T. Hu, Y. Zhai, H. Qin, J. Aliyeva and H. Zhang, Environ. Res., 2020, 182, 109061 CrossRef CAS.
Footnote |
| † Electronic supplementary information (ESI) available. See DOI: 10.1039/d0ra09296g |
| This journal is © The Royal Society of Chemistry 2021 |