 Open Access Article
Promoting dry reforming of methane via bifunctional NiO/dolomite catalysts for production of hydrogen-rich syngas
Mohd Razali Shamsuddin a,
Nurul Asikin-Mijan
 b,
Tengku Sharifah Marlizac,
Manabu Miyamoto
 d,
Shigeyuki Uemiyad,
Mohd Ambar Yarmob and
Yun Hin Taufiq-Yap
 *ae
*ae
aCatalysis Science and Technology Research Centre (PutraCAT), Chemistry Department, Faculty of Science, Universiti Putra Malaysia, 43400 UPM Serdang, Selangor, Malaysia. E-mail: taufiq@upm.edu.my; Fax: +60 3 89466758; Tel: +60 3 89466809
bDepartment of Chemical Science, Faculty of Science and Technology, Universiti Kebangsaan Malaysia, 43650 UKM Bangi, Selangor, Malaysia
cDepartment of Basic Science and Engineering, Faculty of Agriculture and Food Sciences, Universiti Putra Malaysia, Bintulu Sarawak Campus, 97008 Bintulu, Sarawak, Malaysia
dDepartment of Chemistry and Biomolecular Science, Faculty of Engineering, Gifu University, Japan
eFaculty of Science and Natural Resources, Universiti Malaysia Sabah, Jln UMS, 88400 Kota Kinabalu, Sabah, Malaysia
First published on 12th February 2021
Abstract
Extensive effort has been focused on the advancement of an efficient catalyst for CO2 reforming of CH4 to achieve optimum catalytic activity together with cost-effectiveness and high resistance to catalyst deactivation. In this study, for the first time, a new catalytic support/catalyst system of bifunctional NiO/dolomite has been synthesized by a wet impregnation method using low-cost materials, and it shows unique performance in terms of amphoteric sites and self-reduction properties. The catalysts were loaded into a continuous micro-reactor equipped with an online GC-TCD system. The reaction was carried out with a gas mixture consisting of CH4 and CO2 in the ratio of 1![[thin space (1/6-em)]](https://www.rsc.org/images/entities/char_2009.gif) :
:![[thin space (1/6-em)]](https://www.rsc.org/images/entities/char_2009.gif) 1 flowing 30 ml min−1 at 800 °C for 10 h. The physicochemical properties of the synthesized catalysts were determined by various methods including X-ray diffraction (XRD), N2 adsorption–desorption, H2 temperature-programmed reduction (H2-TPR), temperature-programmed desorption of CO2 (TPD-CO2), and temperature-programmed desorption of NH3 (TPD-NH3). The highest catalytic performance of the DRM reaction was shown by the 10% NiO/dolomite catalyst (CH4 & CO2 conversion, χCH4; χCO2 ∼ 98% and H2 selectivity, SH2 = 75%; H2/CO ∼ 1
1 flowing 30 ml min−1 at 800 °C for 10 h. The physicochemical properties of the synthesized catalysts were determined by various methods including X-ray diffraction (XRD), N2 adsorption–desorption, H2 temperature-programmed reduction (H2-TPR), temperature-programmed desorption of CO2 (TPD-CO2), and temperature-programmed desorption of NH3 (TPD-NH3). The highest catalytic performance of the DRM reaction was shown by the 10% NiO/dolomite catalyst (CH4 & CO2 conversion, χCH4; χCO2 ∼ 98% and H2 selectivity, SH2 = 75%; H2/CO ∼ 1![[thin space (1/6-em)]](https://www.rsc.org/images/entities/char_2009.gif) :
:![[thin space (1/6-em)]](https://www.rsc.org/images/entities/char_2009.gif) 1 respectively). Bifunctional properties of amphoteric sites on the catalyst and self-reduction behaviour of the NiO/dolomite catalyst improved dry reforming of the CH4 process by enhancing CH4 and CO2 conversion without involving a catalyst reduction step, and the catalyst was constantly active for more than 10 h.
1 respectively). Bifunctional properties of amphoteric sites on the catalyst and self-reduction behaviour of the NiO/dolomite catalyst improved dry reforming of the CH4 process by enhancing CH4 and CO2 conversion without involving a catalyst reduction step, and the catalyst was constantly active for more than 10 h.
1 Introduction
An International Panel on Climate Change (2014)1 predicted that the world energy demand for natural gas, oil, and other energy sources will increase extensively. The estimation of worldwide energy utilization, which is associated with rising population and economic growth, was projected to be >40% by the year 2035. Currently, world energy demand is laid on fossil hydrocarbon-coal, petroleum, and natural gas. However, the limited sources and the long-term trend in feedstock prices encourage people to increase the economical use of renewable resources, such as utilizing synthetic gas or syngas.Syngas is a fuel gas mixture primarily comprised of hydrogen, carbon monoxide and frequently carbon dioxide. It is an essential intermediate for ammonia, methanol, and synthetic hydrocarbon fuel production. The formation of syngas requires high temperatures due to the strongly endothermic reaction. The production of syngas commonly involves a reforming process which includes steam reforming,2 gasification3 or partial oxidation of CH4,4 and dry reforming CH4 (DRM).5
DRM was introduced by Fischer and Tropsch in 1928 by a catalytic reaction using Ni and Co as the catalysts.5 This process has advantages for the environment compared to the universally admitted harmful effect of CO2. Contrarily, DRM is deliberately the most convenient alternative because of the significant output of a higher H2/CO ratio.6 Concurrently in the process, CH4 reacts with an equimolar amount of CO2 over a catalyst to produce H2 and CO (1). Nevertheless, because of the high temperature (650–1000 °C) which is required for the reaction, active catalyst material sintering and coke formation might occur via the eqn (2) and (3).7–10
| CH4 + CO2 ⇌ 2H2 + 2CO, ΔH° = +247.3 kJ mol−1, ΔG = 61.770–67.32T kJ mol−1, at T = 643 °C, ΔG° = +104.88 kJ mol−1, at T = 647 °C, ΔG° = −164.4 kJ mol−1 | (1) |
| CH4 ⇌ C + 2H2, ΔH° = +75 kJ mol−1, ΔG = 21.90–26.45T kJ mol−1 | (2) |
| 2CO ⇌ C + CO2, ΔH° = −171 kJ mol−1, ΔG = −39.810 + 40.87T kJ mol−1 | (3) |
The major dispute is that it prevents the extensive applications of DRM withstand in catalyst performance. From an economic standpoint, Ni-based catalysts are more appealing than noble metals which are very expensive and often unavailable.10,55 However, in terms of industrial applications, Ni catalysts are limited due to their unstable performance which is induced by sintering of active Ni species and coke formation on the metal surfaces.11–13 Therefore, coke deposition presents a major barrier for the DRM reaction over Ni-based catalysts.
To overcome the problem, there are some efficient alternatives to prevent coke deposition, such as (i) doping with alkali/alkaline earth or transition metal promoters, (ii) poisoning of coke-formation sites by sulphur, (iii) dispersing Ni chemically or physically into other metal oxides; (iv) restricting Ni particles in mesoporous materials, (v) and encapsulating Ni particles in an inorganic frame or shell.10 Utilization of a basic metal such as Mg14–16 and Ca17,18 is able to solve this problem by hindering coking mechanisms. Hence, employing dolomite, which contains Mg and Ca, may be a better choice for producing a supreme bifunctional catalyst for the DRM reaction. Noteworthy, the synergetic effect between NiO and dolomite have been proven to hinder coke formation. Although NiO supported on dolomite (NiO/dolomite) was reported to have outstanding catalytic performance in a variety of reaction process such as oil cracking,19 pyrolysis/reforming,20 steam reforming,21 and gasification.22 However, there is no evidence in the previous literature of NiO/dolomite being used as a catalyst in the DRM reaction.
Due to aforementioned finding, the focus of this study was the use of bifunctional Ni/dolomite catalyst for production of syngas especially H2 via DRM reaction with zero waste production from catalyst synthesis until end of reaction. It is expected that incorporation of Ni and dolomite would form a bifunctional catalyst with strong metal-support interaction, which in thus result in a excellent synergetic effect between both metals and the support. It is believed that this trait will able to enhance the DRM activity and stability of the catalyst.
2 Experimental
2.1 Material
The chemicals involved in the synthesis of the catalyst were Ni(NO3)2·6H2O and natural dolomite. Dolomite from Perlis Dolomite Sdn. Bhd. went through a pre-treatment by calcination at 900 °C (Table 1). Dolomite are apparently dominated by Ca (55.6%) and Mg (12.9%) followed by Fe (0.2%) Si (0.1)% and Al (0.1%). Ni(NO3)2·6H2O (ACROS, purity 99.8%) was used as received without any pre-treatment.| Element | Z | Concentrationa |
|---|---|---|
| a Result obtained from XRF Analysis. Dolomites contain C and O which cannot be detected by XRF spectroscopy which effect to total elemental content is not 100%. | ||
| Ca | 20 | 55.56% |
| Mg | 12 | 12.92% |
| Fe | 26 | 0.17% |
| Si | 14 | 0.13% |
| Al | 13 | 0.11% |
| Cl | 17 | 0.02% |
| S | 16 | 0.02% |
| Sr | 38 | 0.02% |
| Mn | 25 | 92 ppm |
| Cu | 29 | 67 ppm |
| Mo | 42 | 57 ppm |
| Zr | 40 | 11 ppm |
2.2 Catalyst preparation
Five grams of catalyst was prepared by using a wet-impregnation method. 10 w/w% of Ni(NO3)2·6H2O was dissolved in distilled water and stirred for one hour. Dolomite was added, and the mixture was continuously heated at 100 °C until all of the water evaporated. The sludge-like catalyst was then oven-dried at 150 °C for 24 h. Then, the dried catalyst was ground using mortar and pestle until it became a fine powder before being calcined in a tube furnace heated at 10 °C min−1 to 600 °C for 3 h under air atmosphere.2.3 Physicochemical properties analysis
The physicochemical properties of the prepared catalyst were characterized by X-ray diffraction (XRD), surface area and porosity (BET), Field Emission Scanning Electron Microscopy (FESEM), H2 temperature-programmed reduction (TPR-H2), and temperature programmed desorption of CO2 (TPD-CO2) and NH3 (TPD-NH3). The XRD analysis was determined using a Shimadzu diffractometer model XRD-6000 with Cu-Kα radiation = 1.5418 Å radiation at 2θ between 20° to 80° and a scan speed of 4° min−1 to identify the crystal phase of the obtained catalyst.Nitrogen isotherm adsorption–desorption analysis gave the specific surface area, average pore size, and pore volume distribution of the catalysts. The determination was carried out by using a Micromeritic ASAP2020 instrument at −196 °C. Before the evaluation, the catalyst was degassed at 150 °C for 8 h to take off the water or other adsorbed gases from the catalyst surface. The specific surface area (Vm) was calculated using the BET method at a pressure range of 0.05 < p/p° < 0.30.
Field Emission Scanning Electron Microscopy (FESEM) images were obtained on a Microscope-Hitachi (FESEM-Hitachi model) at high magnification combined with Energy Dispersive X-ray analysis (EDX) for quantitative determination of the amount of metal loading.
The ground catalysts were placed evenly on top of an aluminium stub with double-sided carbon tape and coated with platinum before testing in order to avoid electrical charging during catalyst analysis.
Temperature programmed reduction (TPR-H2) and temperature-programmed desorption (TPD-CO2 & TPD-NH3) analysis were performed using the Thermo Finnigan TPD/R/O 1100 Instrument. About 0.05 g of the catalysts were inserted into a quartz tube reactor with an internal diameter of 6 mm, and then they were pre-treated under 20 ml min−1 N2 gas flow at 150 °C for 10 min. The analysis condition was carried out using 5% H2/Ar flow at 25 ml min−1 from 50 to 900 °C with a heating ramp of 10 °C min−1. Hence, to prove the in situ reduction of NiO/dolomite catalyst under CH4 reductant, the reaction model was conducted using a Micromeritics Autochem II+ Enhanced Chemisorption Analyzer connected with mass spectrometer model Cirrus 2 Quadrupole. The transient MS signals at a mass-to-charge ratio (m/z) of 2, 16, 18, 28, and 44 were measured continuously for H2, CH4, H2O, CO, and CO2, respectively. For TPD-CO2 and TPD-NH3, the pre-treatment was performed under a N2 flow of 20 ml min−1 at 300 °C for 30 min. Then the catalyst was exposed to CO2 and NH3 gas (30 ml min−1) at ambient temperature for 60 min and cleaned by N2 flow for 30 min to remove the excess CO2 or NH3 on the catalyst surface. The analysis was conducted using helium gas with 25 ml min−1 flow from 60 to 900 °C with a heating ramp of 10 °C min−1. All analysis were identified by a thermal conductivity detector (TCD).
2.4 Catalytic performance
The model biogas reforming (DRMC) reaction was conducted using a fixed bed stainless steel micro-reactor with internal diameter, Ø = 6 mm, and height, h = 340 mm, in the continuous flow system. In a prior reaction for some catalysts, ∼0.20 g catalyst was reduced in 5% H2/Ar at a flow rate of 30 ml min−1 and temperatures from 100 to 700 °C for 1 h in order to determine the effect of the reduction environment on catalytic activity. The DRM reaction was performed using a mixture of gases consisting of CH4 and CO2 with molar ratio 1![[thin space (1/6-em)]](https://www.rsc.org/images/entities/char_2009.gif) :
:![[thin space (1/6-em)]](https://www.rsc.org/images/entities/char_2009.gif) 1 without dilution. The measurement was carried out by flowing the feed gas (30 ml min−1) at 1 atm and 800 °C and holding for 600 min. The gas products were analysed by an online gas chromatograph with a TCD detector, Agilent 6890N (G 1540N) equipped with Varian capillary columns “HPPLOT/Q and HP-MOLSIV”. Fig. 1 shows the schematic diagram of the catalytic micro-reactor system.
1 without dilution. The measurement was carried out by flowing the feed gas (30 ml min−1) at 1 atm and 800 °C and holding for 600 min. The gas products were analysed by an online gas chromatograph with a TCD detector, Agilent 6890N (G 1540N) equipped with Varian capillary columns “HPPLOT/Q and HP-MOLSIV”. Fig. 1 shows the schematic diagram of the catalytic micro-reactor system.
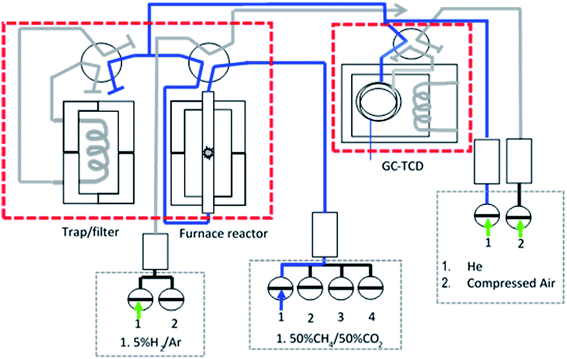 | ||
| Fig. 1 Schematic diagram of fixed bed stainless steel micro-reactor equipped with online TCD gas chromatography in a continuous flow system. | ||
2.5 Carbon formation on spent catalyst analysis
To evaluate the deposited carbon during the DRM reaction, the images and amount of carbon accumulated after 10 h of the reaction were analysed. A comparative study of fresh and spent catalysts to determine carbon formation was carried out on an FESEM model JEOL JSM7600F at 20 K magnification and a transmission electron microscope (LEO 912AB).Determination of crystal phases that appeared after the DRM reaction was conducted using XRD analysis (Shimadzu XRD-6000). Quantitative analysis of carbon formation was performed in a Mettler-Toledo TGA/DSC1 instrument. The coked catalyst was submitted to a heat treatment under 5% O2/N2 (100 cm3 min−1) with a heating rate of 10 °C min−1. Thus, the amount of carbon burned out was determined by the weight loss of CO2 and CO produced during the analysis.
3 Results and discussion
3.1 X-ray diffraction spectroscopy (XRD)
The XRD profiles of dolomite and NiO/dolomite based catalysts are shown in Fig. 2. The raw dolomite (dolomiteraw) and dolomite calcined at 900 °C, (dolomite900) (Fig. 2a) shows a few changes in the crystallite system during the preparation of the catalyst. The calcination step at 900 °C during the pre-treatment promoted half decomposition of dolomite. However, only some part of the dolomite, (CaMg(CO3)2) suffered from this half decomposition due to the presence of dolomite peaks (ICDD 00-075-1765) on the XRD profiles. Half decomposition of dolomite creates a new crystal phase in a mixture of CaCO3 and Mg(OH)2 which was confirmed by the appearance of peaks CaCO3 (ICDD 00-001-0837) at planes 2θ = 29.36° (014), 39.49° (113), 43.25° (202), 47.30° (024), 57.56° (122), 61.34° (119) and 76.89° (220). Meanwhile, for hexagonal Mg(OH)2 (JCPDS no. 01-1169) plane 2θ = 18.66° (001), 50.98° (102), 62.26° (103) proves the existence of this crystal phase in the catalyst. Formation of Mg(OH)2 is due to the interaction of MgO with moisture at room temperature during sample storage. Decomposition of dolomite involved three different paths: one step/full decomposition23,24 and two-step/half decomposition25–27 routes and formation of a “mixed crystal” between calcite and magnesite.28 Chemical eqn (4)–(7) show the decomposition steps that occurred in the dolomite system.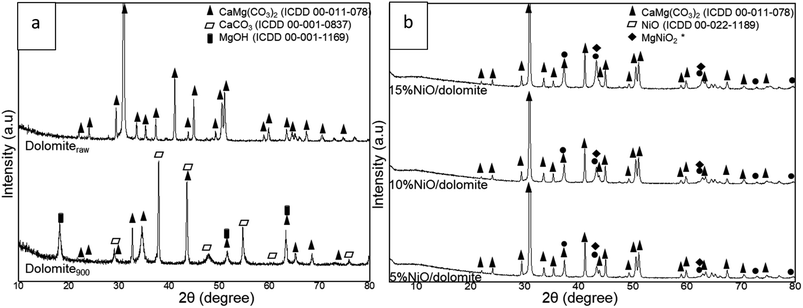 | ||
| Fig. 2 XRD profile of (a) dolomiteraw (raw dolomite) and dolomite900 (calcined at 900) and (b) NiO/dolomite catalysts series. | ||
One step/full decomposition:
| CaMg(CO3)2 → CaO + MgO + 2CO2 | (4) |
Two step/half decomposition:
| (i) CaMg(CO3)2 → CaCO3 + MgO + CO2 | (5) |
| (ii) CaCO3 → CaO + CO2 | (6) |
Mixed crystal formation:
| CaMg(CO3)2 → CaCO3(1 − n)MgCO3 + nMgO + nCO2 | (7) |
Based on the phase that appeared in dolomite900, it can be suggested that calcination of dolomite during the pre-treatment step followed eqn (5), which proves that dolomite is a very stable compound.
Investigation of 5–15% NiO/dolomite after calcination (Fig. 2b) at 600 °C for 3 h exposed the presence of a sharp diffraction peak of dolomite, which is nearly identical to a dolomiteraw catalyst, located at 2θ between 20° to 78° (ICDD 00-011-0078). The wet impregnation method consequently took place after pre-treatment of dolomite restructured the crystallite form of dolomite. Sibley et al. (1987)29 proved that the dolomization process can occur at 175 °C where calcite, CaCO3, can be transformed to dolomite with an optimum Mg/Ca ratio. These results reveal that there was crystallographic control in the advancement of the reactant-product interface through which CO2 diffused outside while the reaction progressed from the surface towards the core.30 Impregnation of NiO in/on dolomite support was proven successful by the appearance of NiO crystal peaks in the XRD pattern at 2θ = 37°, 43°, 62°, 75° and 79°, which respectively corresponded to (111), (200), (220), (311) and (222) planes of cubic NiO species (ICDD 00-022-1189). The peaks at 43° and 62° were determined as overlapping peaks for dolomite, NiO and MgNiO2. It was confirmed that Ni and dolomite formed a stable phase of MgNiO2, which increased the degree of Ni distribution and hindered Ni agglomeration in the DRM process.19
As proved by Table 2. NiO crystallite size increased as the following order: 5% NiO/dolomite > 15% NiO/dolomite > 10% NiO/dolomite. These crystal size increased from 27 to 77 nm due to agglomeration of the NiO species. 10% NiO/dolomite show finest crystallite size, and this might be due to uniform distribution of NiO particle on dolomite surface. In addition, comparative value of NiO percentages of dispersion and particle sizes shows vice versa trend. It has been confirmed that 10% NiO/dolomite show high NiO dispersion compared to 15% Ni loading. Hence, it can be deduced that upon increasing the Ni percentage, these NiO peaks became intensified, while those corresponding to dolomite remain the same, which thereby corroborates greater dispersion and produced fine particle and crystallite size.
| Analysis | NiO | NiO | Average NiO | SBET (m2 g−1) | Pore size (nm) | TPR-H2 | TPD-CO2 | TPD-NH3 | |||
|---|---|---|---|---|---|---|---|---|---|---|---|
| Catalysts | Crystallite size (nm) | Dispersionsa (%) | Particle sizea (nm) | Temp. (°C) | Amount (μmol g−1) | Temp. (°C) | Amount (μmol g−1) | Temp. (°C) | Amount (μmol g−1) | ||
| a Results obtained from TPDRO analysis. | |||||||||||
| Dolomite | — | — | — | 17 | 16.50 | 807 | 3950 | 804 | 22![[thin space (1/6-em)]](https://www.rsc.org/images/entities/char_2009.gif) 488 488 |
635 | 3293 |
| 5% Ni/dolomite | 33 | 62.26 | 23.6 | 4 | 11.59 | 443 | 557 | 777 | 20![[thin space (1/6-em)]](https://www.rsc.org/images/entities/char_2009.gif) 948 948 |
655 | 2191 |
| 771 | 8073 | ||||||||||
| 827 | 1977 | ||||||||||
| 10% Ni/dolomite | 27 | 40.55 | 36.3 | 25 | 11.67 | 401 | 1407 | 771 | 15![[thin space (1/6-em)]](https://www.rsc.org/images/entities/char_2009.gif) 357 357 |
685 | 7969 |
| 765 | 5499 | ||||||||||
| 15% Ni/dolomite | 76 | 19.87 | 74.1 | 10 | 22.27 | 433 | 1121 | 768 | 17![[thin space (1/6-em)]](https://www.rsc.org/images/entities/char_2009.gif) 603 603 |
663 | 3361 |
| 746 | 2265 | ||||||||||
3.2 Physisorption analysis
Based on Fig. 3a 10% NiO/dolomite displayed a significant Type IIB with H3 hysteresis pattern. This isotherm displays physisorption behaviour for mesoporous which are responsible for the hysteresis and macroporous, with the plateau-like mesoporous.31,32 The H3 hysteresis pattern expressed plate-like particles for non-rigid aggregates. Hence, the pore network consisted of macropores which were not filled with pore condensate.33 Dolomite900, 5% NiO/dolomite, and 15% NiO/dolomite showed a type III physisorption isotherm with an H3 hysteresis which corresponded to a nonporous or macroporous solid. These materials showed a very low quantity of gas adsorbed compared to 10% NiO/dolomite, and the lower hysteresis indicated the dominant macroporous character of the catalysts.32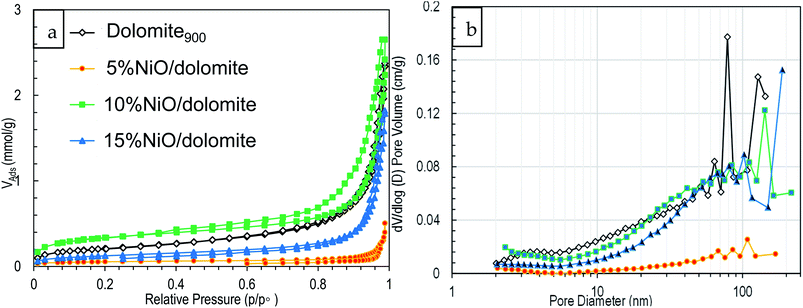 | ||
| Fig. 3 Physisorption of prepared catalysts series (a) N2 adsorption–desorption isotherm and (b) pore sized distribution. | ||
Fig. 3b shows the BJH pore-size distribution plotted from dV/d (log![[thin space (1/6-em)]](https://www.rsc.org/images/entities/char_2009.gif) D) versus pore diameter. For all catalysts, the distribution is unimodal with a dominant peak between 10–100 nm. Kuila & Prasad (2013) and Jullien et al. (2005)31,34 summarized that this pore-size distribution can be associated with porosities of ‘intra-aggregate’ or large mesopores and fine macropores (diameter 50–100 nm).
D) versus pore diameter. For all catalysts, the distribution is unimodal with a dominant peak between 10–100 nm. Kuila & Prasad (2013) and Jullien et al. (2005)31,34 summarized that this pore-size distribution can be associated with porosities of ‘intra-aggregate’ or large mesopores and fine macropores (diameter 50–100 nm).
The comparison study of dolomite900 and prepared NiO/dolomite catalysts in BET specific surface area (SBET) and average pore sizes are tabulated in Table 2. The SBET and total pore volumes follow the order of 5% NiO/dolomite < 15% NiO/dolomite < dolomite900 < 10% NiO/dolomite. The higher SBET obtained by 10% NiO/dolomite is due to the existence of fine mesopores and larger mesopores and macropores contributed by additional NiO particles forming on the external surface area of NiO. However, as the nickel loading increased over the optimum value (15% NiO/dolomite), the SBET dropped significantly due to agglomeration of NiO particles and pore blockage on support. Meanwhile, the average pore size of the prepared catalysts has the following order: 5% NiO/dolomite > 10% NiO/dolomite > dolomite900 > 15% NiO/dolomite. As shown by Du Plessis (2007), the relationship between average pore size and SBET is found to be an inverse, with a constant specific surface area times the pore diameter product.35 This explains why 10% NiO/dolomite shows the lowest average pore size, besides 5% NiO/dolomite. Nevertheless, 15% NiO/dolomite shows higher average pore size due to formation of unimodular pore size in this catalyst. 5% NiO/dolomite shows the lowest textural properties (SBET and pore size) due to total pore blockage on the catalyst. As proven by the adsorption–desorption isotherm and pore distribution plot, a lower quantity of adsorbed and low intensity of plot cause the lowest value of SBET, average pore volume and pore size.
3.3 FESEM-EDX analysis
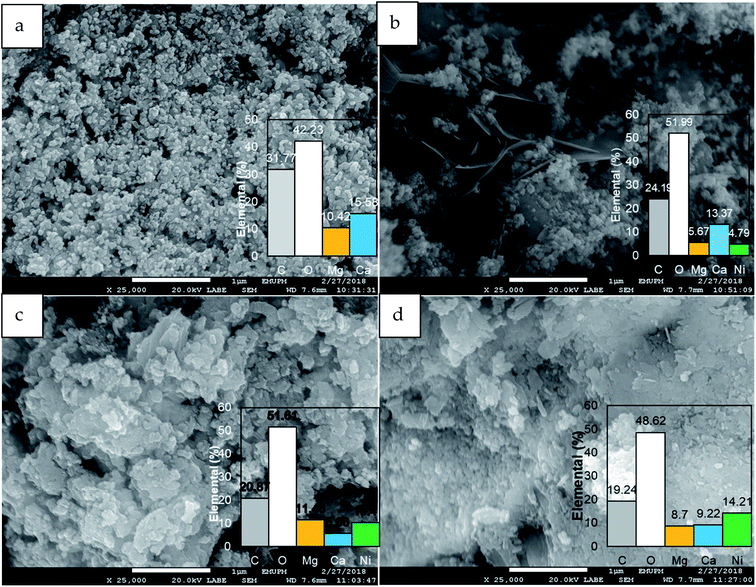
The FESEM image of dolomite (Fig. 4) showed sand-like particles with an average diameter of 50 nm. The distribution of elements C, O, Mg, and Ca reveals dolomite900 without noticeable composition changes. 5% NiO/dolomite exhibited the formation of a thin layer sheet crystal on dolomite particles which decreased the surface area and porosity of dolomite. On the contrary, 10% NiO/dolomite presented aggregate structures. NiO particles were uniformly distributed on/in the dolomite surface by creating a solid solution. Thus, there was no clear difference between NiO and dolomite. This solid solution enhanced the external surface area of NiO/dolomite aggregates. However, at the same time, some large pores on dolomite support were blocked. This resulted in an agreement with the physisorption analysis where the BET surface area increased but pore size decreased. Excessive addition of NiO (15% NiO/dolomite) tends to form an agglomeration of aggregates which reduces the surface area of dolomite. Nevertheless, these agglomerated particles provide large pores which contribute to the increment of pore size. EDX spectroscopy obtained for a series of catalysts (5%/15% NiO/dolomite) proves that NiO was successfully impregnated into the dolomite support in the desired amount. Also, NiO dispersion (Table 2) proved that as the amount of NiO loading increases from 5% to 15%, the degree of dispersion shows different behaviour on the dolomite support. 10% NiO/dolomite shows the highest degree of Ni dispersion followed 15% NiO/dolomite and 5% NiO/dolomite. This might be due to the interaction between NiO and support. Thus, a low amount of NiO results in low dispersion, but a too high amount also can cause agglomeration of NiO particles and at the same time reduce the dispersion degree.3.4 Chemisorption analysis
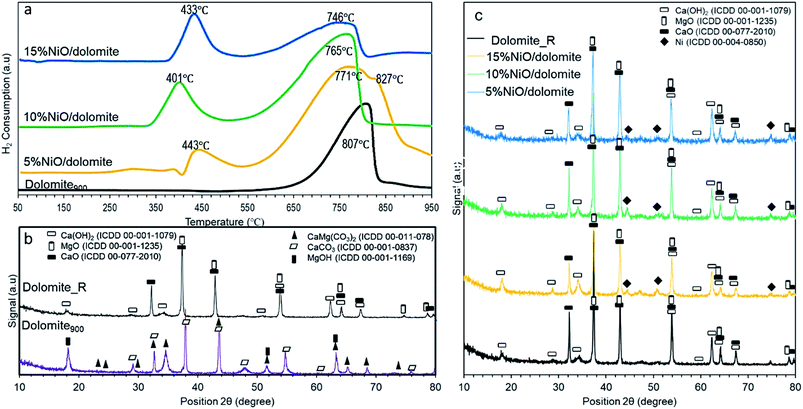
![[thin space (1/6-em)]](https://www.rsc.org/images/entities/char_2009.gif) 827 °C. The first reduction peak can be described as the reduction of Ni2+ to Ni0 on the surface.36 The XRD diffractogram of reduced catalysts (Fig. 5c) confirmed the formation of Ni0 species (ICDD 01-087-9414) after NiO/dolomite (5–15%) was reduced by 5% H2/Ar. Whereas, the broad peak with a shoulder at the higher temperature can be ascribed to Ni reduction with a strong interaction with the support. The NiMgO2 spinel was proven by the XRD diffractogram.36 In good agreement with this, Ni reduction peaks are presented at around 800 °C with the periclase form of NiMgO2.37–39 Simultaneously, the degradation of species existing on dolomite900 also occurred at this high temperature, which is proven by the presence of extremely broad peaks on the NiO/dolomite catalysts. The degree of NiO reduction for NiO/dolomite was variable due to the addition the different loadings of NiO. It is described by the following order: 5% NiO/dolomite < 10% NiO/dolomite < 15% NiO/dolomite. These marked results might be contributed by the formation of a solid solution of NiO and MgO. It is noteworthy that the reduction behaviour of the NiO catalysts was strongly affected by the presence of the alkaline earth oxide (MgO) in the catalyst.40
827 °C. The first reduction peak can be described as the reduction of Ni2+ to Ni0 on the surface.36 The XRD diffractogram of reduced catalysts (Fig. 5c) confirmed the formation of Ni0 species (ICDD 01-087-9414) after NiO/dolomite (5–15%) was reduced by 5% H2/Ar. Whereas, the broad peak with a shoulder at the higher temperature can be ascribed to Ni reduction with a strong interaction with the support. The NiMgO2 spinel was proven by the XRD diffractogram.36 In good agreement with this, Ni reduction peaks are presented at around 800 °C with the periclase form of NiMgO2.37–39 Simultaneously, the degradation of species existing on dolomite900 also occurred at this high temperature, which is proven by the presence of extremely broad peaks on the NiO/dolomite catalysts. The degree of NiO reduction for NiO/dolomite was variable due to the addition the different loadings of NiO. It is described by the following order: 5% NiO/dolomite < 10% NiO/dolomite < 15% NiO/dolomite. These marked results might be contributed by the formation of a solid solution of NiO and MgO. It is noteworthy that the reduction behaviour of the NiO catalysts was strongly affected by the presence of the alkaline earth oxide (MgO) in the catalyst.40
 | ||
| Fig. 5 (a) Temperature-programmed reduction of hydrogen (H2-TPR) profile from 50 °C to 950 °C (b) XRD profile of dolomite and reduced dolomite (c) XRD profile of reduced catalysts. | ||
The process of NiO reduction is considered to be a complex solid–gas reaction influenced by temperature, the concentration of reducing gas, and the presence of additives.41 Manukyan et al. (2015) reported that this reduction starts with initial nucleation of Ni in the temperature range of 543–773 K (270 to 500 °C).42 During this phase, the Ni nuclei emerged on the NiO particles' outer surface. This slow process then underwent the creation of a small channel that commenced to propagate and start the second step of reduction.42 Consequently, a dominant peak appeared at 550 to 900 °C, referring to the second step of reduction on the bulk of the NiO and NiMgO2 particles. The small channel grew into the NiO bulk. Further Ni nucleation occurred on the inner surface of these channels, leading to the formation of Ni nano-layers. Then these nano-layers start branching and interconnect the network until the NiO phase completely reduces to Ni.42
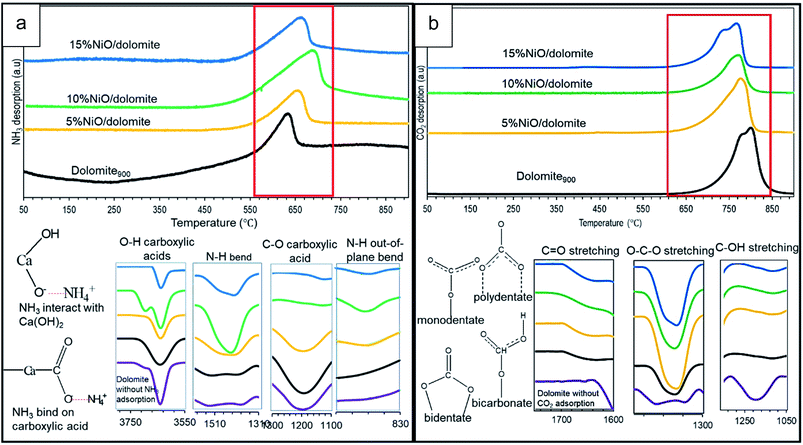
As it is evidenced by Hakim et al. 2016,44 basic properties enhance adsorption of acidic CO2 molecules more easily on the catalyst surface. Based on the TPD-CO2 profile (Fig. 6b), the temperature intervals were estimated for very strong sites with the maximum temperature range of 768–804 °C (refer Table 2). Dolomite showed the highest amount of adsorption capacity compared to other catalysts (22![[thin space (1/6-em)]](https://www.rsc.org/images/entities/char_2009.gif) 488 μmol g−1), which was contributed by the basic properties of CaO–MgO of alkaline earth metal. FTIR spectra at wavelengths of 1650 cm−1 (polydentate), 1440 cm−1 (bidentate), and 1130 cm−1 (monodentate) indicate asymmetric vibrations of O–C–O, O–CO symmetric vibrations, and C–OH stretching for bicarbonate, respectively.45 Thus, only bicarbonate has been detected on dolomite without CO2 adsorption, due to carbonate backbone of dolomite crystal system. 10% NiO/dolomite showed the lowest CO2 desorption temperature among prepared catalysts (Tmax = 771 °C, 15
488 μmol g−1), which was contributed by the basic properties of CaO–MgO of alkaline earth metal. FTIR spectra at wavelengths of 1650 cm−1 (polydentate), 1440 cm−1 (bidentate), and 1130 cm−1 (monodentate) indicate asymmetric vibrations of O–C–O, O–CO symmetric vibrations, and C–OH stretching for bicarbonate, respectively.45 Thus, only bicarbonate has been detected on dolomite without CO2 adsorption, due to carbonate backbone of dolomite crystal system. 10% NiO/dolomite showed the lowest CO2 desorption temperature among prepared catalysts (Tmax = 771 °C, 15![[thin space (1/6-em)]](https://www.rsc.org/images/entities/char_2009.gif) 357 μmol g−1). The acid strength from NiO decreased basic site densities (nCO2) of the catalyst. These are caused by the accessibility of CO2 towards basic sites on dolomite hindered by NiO particles which coincides with decreasing of materials specific surface area (dolomite).46 However, the amount of CO2 desorption for 15% NiO/dolomite was a little bit higher than 10% NiO/dolomite, due to the agglomeration of NiO particles which affected its distribution and thus lowered the surface area of the catalyst.
357 μmol g−1). The acid strength from NiO decreased basic site densities (nCO2) of the catalyst. These are caused by the accessibility of CO2 towards basic sites on dolomite hindered by NiO particles which coincides with decreasing of materials specific surface area (dolomite).46 However, the amount of CO2 desorption for 15% NiO/dolomite was a little bit higher than 10% NiO/dolomite, due to the agglomeration of NiO particles which affected its distribution and thus lowered the surface area of the catalyst.
3.5 Catalytic performance
 | ||
| Fig. 7 Effect of reduction step on the percentage of (a) CH4 and CO2 conversions (b) H2 and CO selectivity (c) MS profiles of non-isothermal reduction of 10% NiO/dolomite under CH4. | ||
Non-isothermal reduction of NiO/dolomite under a CH4 environment (CH4![[thin space (1/6-em)]](https://www.rsc.org/images/entities/char_2009.gif) :
:![[thin space (1/6-em)]](https://www.rsc.org/images/entities/char_2009.gif) N2 = 1
N2 = 1![[thin space (1/6-em)]](https://www.rsc.org/images/entities/char_2009.gif) :
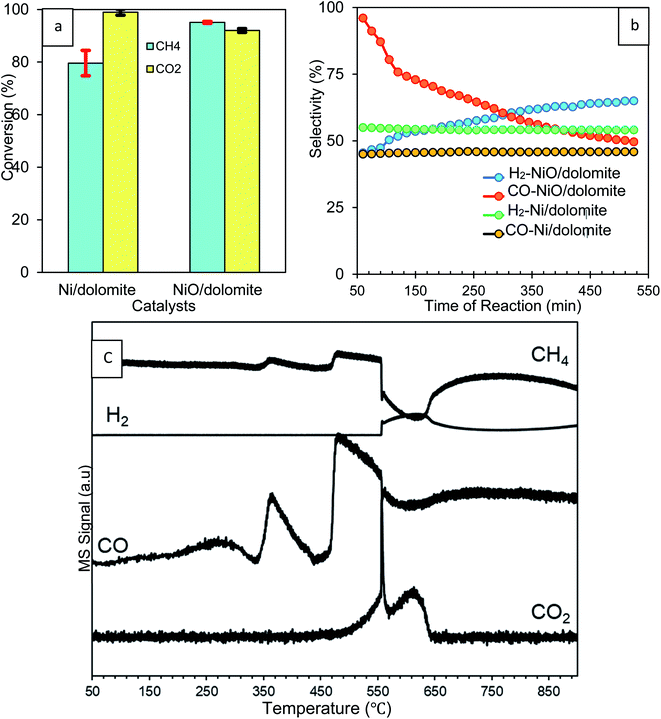
:![[thin space (1/6-em)]](https://www.rsc.org/images/entities/char_2009.gif) 9) was carried out to prove in situ reduction of NiO under dry reforming conditions. Fig. 7c demonstrates that the MS signal of CH4 exhibited this redox reaction only above a temperature of around 250 °C. This was indicated by a significant drop of the signal due to chemical utilization of CH4 or its adsorption on the NiO surface. Hereafter, CH4 starts to dissociate to carbon and hydrogen adatoms on NiO as described by the following eqn (8).47
9) was carried out to prove in situ reduction of NiO under dry reforming conditions. Fig. 7c demonstrates that the MS signal of CH4 exhibited this redox reaction only above a temperature of around 250 °C. This was indicated by a significant drop of the signal due to chemical utilization of CH4 or its adsorption on the NiO surface. Hereafter, CH4 starts to dissociate to carbon and hydrogen adatoms on NiO as described by the following eqn (8).47
| CH4 + 5* → C* + 4H* | (8) |
| C* + NiO → Ni0 + CO + * | (9) |
| 2H* → H2 + 2* | (10) |
| CH4 + ½O2 → CO+ 2H2 | (11) |
Dissociation of CH4 occurred in two-steps, which first happens on surface and then in the bulk of the catalyst. Consequently, the MS signal of CO peaks detected early at 350 °C are due to the production of carbon adatoms. Ni was produced by the oxidation of these carbon adatoms, and NiO results in the formation of CO (9). H2 is produced via the associative desorption of two hydrogen adatoms (10), and this was proven by the high-intensity peak of the H2 signal at 550 °C. A small spike in the signal at the beginning refers to the reaction that occurs at the surface of the catalyst before continuing to the bulk, as mentioned before. Overall, the decomposition of methane on reduced Ni results in the formation of CO and H2 adatoms until reduction is complete at about 650 °C (11).47 Consecutive oxidation of CO via oxygen present in NiO would lead to the formation of CO2. However, CO oxidation is not a dominant reaction and only appears at 550 °C, as indicated by the presence of a spike in the CO2 signal.
The results obtained from CH4 & CO2 conversion and H2 & CO selectivity (Fig. 7a and b) were clear evidence of the effect of H2 reduction on the catalyst. Inside into the reaction, H2 reduction caused decomposition of the dolomite support which produced Ca(OH)2, MgO and CaO. CH4 was dissociated to produce carbon adatoms and H2 and then utilized during NiO reduction. This proves that the CH4 conversion of NiO/dolomite is much higher than Ni/dolomite. Yet, CO2 conversion of NiO/dolomite is slightly less than Ni/dolomite. This can be correlated with the CO2 that was produced as a side product during decomposition of dolomite from CaCO3, which has an effect on the CO2 conversion measurement. H2 selectivity was slightly lower at the beginning of the reaction on NiO/dolomite catalyst due to the utilization of H2 to reduce NiO to Ni0. Meanwhile, for CO selectivity, production and oxidation of CO occurred simultaneously on NiO/dolomite caused the plot is slightly dropped. Oxidation of CO leads to the reduction of NiO to Ni0.
 | ||
| Fig. 8 Effect of nickel loading on catalytic performance of catalysts (a) CH4 conversion (b) CO2 conversion (c) H2 selectivity (d) H2/CO ratio. | ||
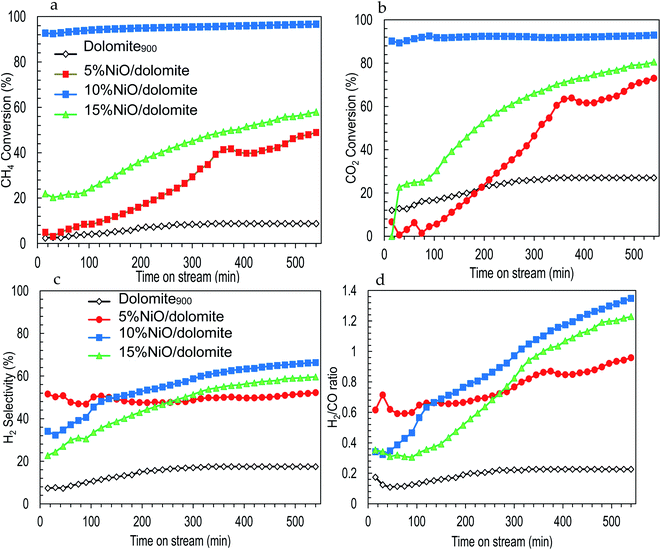
Fig. 8b shows CO2 conversion which is directly proportional to the time in the stream of the DRM reaction. For the first 300 min, 10% NiO/dolomite shows higher conversion of CO2 (up to 95%) followed by NiO. Besides, as the time increased, 15% NiO/dolomite increased rapidly up to 80% conversion. In agreement with other researchers,7,11,13 NiO catalyst always is a good choice for the DRM reaction. Unfortunately, as time increased, the catalytic performance of Ni catalyst decreased (deactivation of the active sites) due to sintering or/and carbon deposition. In contrast, using dolomite as a support increased the catalytic performance of the Ni catalyst. However, poor textural properties (5% NiO/dolomite) and agglomeration of Ni particles (15% NiO/dolomite) lowering the catalytic activity. Meanwhile, higher temperatures and a large amount of hydrogen was consumed caused 5% NiO/dolomite to be less reactive at the beginning of the reaction, but it increased as the time of reaction increased. Dolomite showed the lowest catalytic activities, which were less than 20% CO2 conversion due to the high attraction of Ca–Mg in dolomite to CO2 molecules and more energy was needed to break the bond.
The H2 production and H2/CO ratio are displayed in Fig. 8c and d. The plotted results exhibited the same pattern of H2 selectivity and H2/CO ratio. The H2 selectivity and H2/CO ratio was in the following order: 10% NiO/dolomite > 15% NiO/dolomite > 5% NiO/dolomite > dolomite. However, in the first 3 h reaction, 5% NiO/dolomite showed remarkable H2 selectivity and H2/CO ratio.
It has been agreed that the dissociation of CH4 (8) might have occurred at the beginning of reaction followed by NiO reduction to Ni0 (9). Based on CH4 conversion and H2 production, these reactions tend to follow eqn (8) and (9) due to the higher conversion of CH4 but the slightly low production of H2 for the first 3 h of the reactions. Meanwhile, during CO2 conversion, the strong base sites from the alkaline earth metal oxide (dolomite) tend to attract CO2 for the formation of ‘bent’ CO2∂+ configurations. However, the formation of these CO2∂+ species alone does not lead to CO2 activation. Therefore, surface transitions of sp metals (in this case C adatom from CH4 dissociation), can activate CO2 and generate CO through splitting of CO2 by decreasing its work function.48 Yet, the water-gas shift reaction (12), in which CO reacts with H2O to form CO2 and H2, and the Boudouard reaction (3) take place for most of the catalysts, except 10% NiO/dolomite which resulted in a decrease of CO2 conversion. Another parallel reaction involved was the reduction of CO by H2 (ref. 48) as in the following eqn (13).
| H2O + CO ⇌ CO2 + H2 | (12) |
| CO + H2 ⇌ C + H2O | (13) |
In general, NiO promotes acidic sites in the catalyst system. However, increasing to a high concentration of Ni metal (15% NiO) resulted in a low conversion of CH4 and CO2. This indicates that the parallel reactions occurred more efficiently. Hence, the products are farther from the stoichiometric proportions. This might be due to the formation of bigger crystallite sizes of NiO (less dispersed) and low quantity of Lewis acid sites. This active site is important in assisted and enhancing catalytic activities, low carbon deposition, and stable catalysts.
Another crucial piece of evidence in the catalyst life cycle is the thermal stability of the support (NiO/dolomite has high thermal stability).49 Hence, the catalytic performance of NiO/dolomite catalysts shows a significant conversion of CH4 and CO2 for more than 600 minutes on stream. Therefore, using dolomites as a support will highly disperse NiO particles on the catalyst and enhance its acid–base properties.
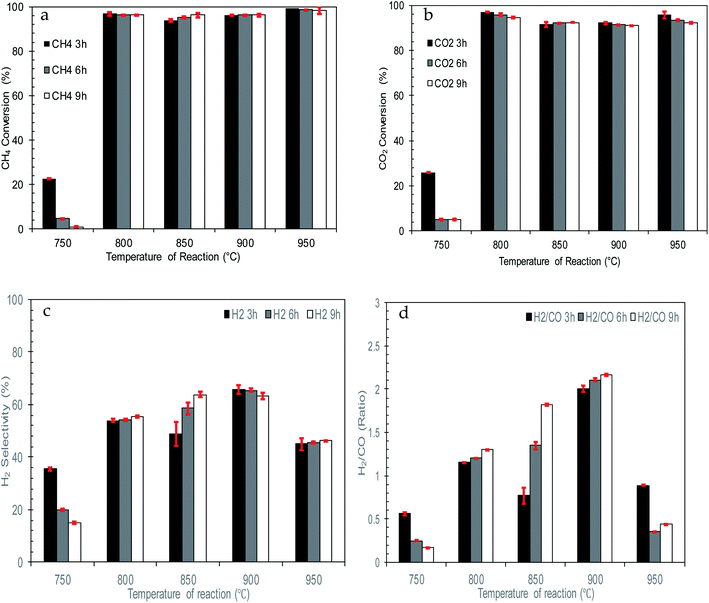 | ||
| Fig. 9 Effect of reaction temperature on catalytic performance of catalysts (a) CH4 conversion (b) CO2 conversion (c) H2 selectivity (d) H2/CO ratio. | ||
Thus, as the temperature of reaction increased from 800 to 950 °C, the formation of the Ni0 active phase increased. This propels CH4 decomposition and enhances H2 production. The changes in temperature also boost CO2 conversion by intensifying carbon formation to reverse the Boudouard reaction and break down CO2-dolomite bonding. Therefore, high and stable conversion of CH4 and CO2 together with H2 selectivity can be observed for the whole reaction.
However, at 950 °C, there is a significant drop in terms of H2 selectivity and H2/CO ratio which is due to parallel reactions occurring. Higher temperatures and concentrations of H2 and CO2 inside the reactor bed enhanced reversing the WGS reaction (10) and lowering H2 selectivity and H2/CO ratio. Furthermore, extremely high reaction temperatures promote Ni sintering, which reduces the activity of the catalyst.
Based on the H2/CO ratio, there are some unusual behaviours of the catalytic performance at 850 °C and 900 °C. This might be due to enhanced catalytic conversion of 10% NiO/dolomite together with parallel reactions involved during the reaction. The water gas shift reaction (12) and Bourdoard's reaction (3) might be occurring, which effectively leads to higher production of H2 and CO. Simultaneously, conversion of CH4 and CO2 also happen with great enthusiasm, caused by the H2/CO present at a value of more than 1. Although 850 °C and 900 °C produced higher conversion and selectivity, in terms of catalytic performance, these temperatures can disturb the reaction equilibrium, and this might have an effect in the long-term if the reaction is continued for more than 10 h.
3.6 Analysis of carbon formation on spent catalyst
Fig. 10 shows a comparison of carbon formation on fresh and spent catalysts using FESEM, TEM, XRD and TGA techniques after 10 h of DRM reaction. FESEM images of the fresh catalyst (Fig. 10a) exhibited NiO particles in aggregate form which were uniformly distributed on/in the dolomite surface by creating a solid solution and NiO particles cannot be distinguished from support. Hence, TEM images of a NiO/dolomite (Fig. 10b), and it can be confirmed that the small size of NiO particles (black) is well distributed on/into dolomite (grey) particles (fine distribution of Ni).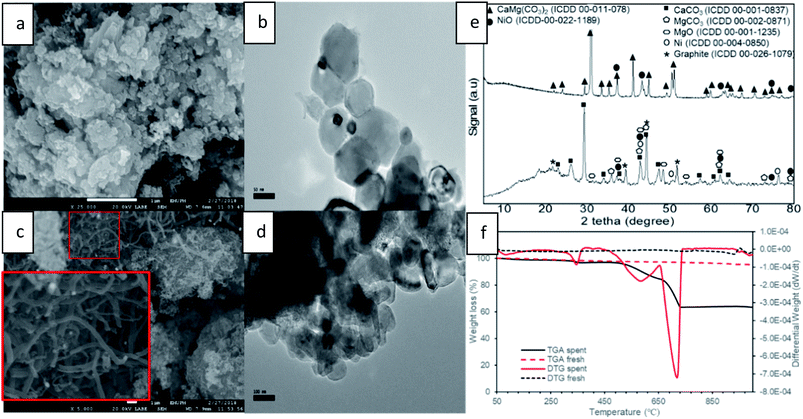 | ||
| Fig. 10 Carbon formation on spent catalyst (a) FESEM fresh (b) TEM fresh (c) FESEM spent (d) TEM spent (e) XRD profiles of fresh and spent (f) TGA and DTG thermogram of fresh and spent. | ||
FESEM and TEM images of the spent catalyst after 10 h (Fig. 10c and d) show the formation of small carbon branches in between Ni and the dolomite area. This can be related to carbon growth on nickel, which is consistently distributed on dolomite. Thus, the formation of filamentous carbon (with the range of 100 to 200 nm) deposited on the surface of the catalyst is concentrated in some areas, which proves that the deposition of carbon takes place at the edges and corners of nickel species.50,51 There are hard to be separated the carbon formation, Ni and dolomite on TEM images (Fig. 10d) due to the bulky image of NiO/dolomite during TEM analysis. The observed images can be related to the carbon-coating on the catalyst surface, because bigger and layered particles appeared. Furthermore, because of the formation of large sized carbon particles, which are nearly the same size as Ni particles, the carbon cannot be determined specifically using TEM analysis.
Fig. 10e shows XRD profiles of fresh and spent 10% NiO/dolomite catalysts run at 2θ = 10° to 80° at the rate of 4° min−1. The fresh catalyst only displayed two types of species (i.e., dolomite and NiO) which have been discussed briefly. However, it can be observed that dolomite peaks are already diminished and replaced by three dominant phases for spent catalyst. This is due to the decomposition of dolomite under DRM reaction conditions. The most significant peaks belong to the rhombohedral CaCO3 phase (ICDD 00-001-0837) at 2θ = 23.02° (012), 29.36° (104), 36.04° (110), 39.49° (113), 43.25° (202), 47.31° (024), 48.65° (116), 57.55° (122) 62.73° (125) and 64.68° (300). Also, prominent peaks appeared that prove the existence of a MgCO3 (ICDD 00-002-0871) and cubic periclase, MgO (ICDD 00-0011235). The appearance of these three peaks provide strong evidence for the decomposition of dolomite under CH4![[thin space (1/6-em)]](https://www.rsc.org/images/entities/char_2009.gif) :
:![[thin space (1/6-em)]](https://www.rsc.org/images/entities/char_2009.gif) CO2 at 800 °C followed by mixed crystal formation (7). NiO species are reduced to the active phase of Ni0 (ICDD 01-087-0712) and the existence of Ni phase at 2θ = 44.5° (111), 51.85° (200) and 76.38° (220) is strong evidence that in situ reduction of NiO by CH4 and/or H2 has occurred. However, NiO species still exist after the DRM reaction, because oxidation of Ni by CO might be occurring simultaneously. Besides, the appearance of a rhombohedral graphite peak (ICCD 00-026-1079) can be correlated to the formation of filamentous carbon on FESEM and TEM.
CO2 at 800 °C followed by mixed crystal formation (7). NiO species are reduced to the active phase of Ni0 (ICDD 01-087-0712) and the existence of Ni phase at 2θ = 44.5° (111), 51.85° (200) and 76.38° (220) is strong evidence that in situ reduction of NiO by CH4 and/or H2 has occurred. However, NiO species still exist after the DRM reaction, because oxidation of Ni by CO might be occurring simultaneously. Besides, the appearance of a rhombohedral graphite peak (ICCD 00-026-1079) can be correlated to the formation of filamentous carbon on FESEM and TEM.
TGA and DTG analysis (Fig. 10f) of the fresh catalyst shows very stable thermal properties because there are no peaks appearing on TGA and DTG thermograms, except for a small drop at a temperature of more than 950 °C. It might be related to the starting point of dolomite decomposition due to the extreme temperature. However, the spent catalyst shows 3-step degradation peak and the first peak of weight loss appeared at Tmax = 83 °C. This prominent peak could be associated with the loss of water in the catalyst. A gradual temperature increase shows the second peak which appeared at Tmax = 346 °C. This peak is due to the degradation one of the mixed crystal species. Based on the literature, MgCO3, species could be degraded (1.96 wt%) around this temperature to produce MgO and CO2.52 Next, the obvious peak drop on both TGA and DTG thermograms is the peak recorded at Tmax = 580 °C. This third weight loss was attributed to the combustion of deposited carbon material, which was about 12.26 wt% of the overall weight of catalyst during the DRM reaction. In succession, the deepest peak of degradation of other carbon material was at Tmax = 715 °C. Bang et al. (2018) classified three different types of carbon species such as species of intermediate phase (α), encapsulated carbon (β), and filamentous carbon (γ).53 The presence of β-type and γ-type carbon during DRM reaction is evident from FESEM and TEM analysis. Hence, the appearance of two significant peaks is associated with these types of carbon which degrade at different temperatures. Luisetto et al. (2015) suggested that filamentous graphitic carbon (γ) is much easier to oxidize at a lower temperature compared to deposits of graphitic carbon (β) species, due to it strongly interfered with contact between the active Ni metal and the reactant.54 Thus, for the two peaks appearing at around 450 to 750 °C, the first peaks belong to filamentous carbon, and the second peaks belong to encapsulated/coated carbon on the surface of the catalyst.
4 Conclusions
NiO/dolomite catalysts with different NiO loadings were successfully synthesized via the wet impregnation method. Physicochemical properties showed that NiO/dolomite catalysts have a low surface area, but they have excellent bifunctional properties. 10% NiO/dolomite showed excellent conversion of CH4 and CO2 (up to 98%). This is due to its high surface area and good acid–base properties along with a lower reduction temperature. The conversions of other catalysts showed a significant increase up to 10 h on stream, and deactivation didn't occur during the reaction period. Meanwhile, 10% NiO/dolomite showed better performance on H2 selectivity (up to 75%) and a H2/CO ratio near to 1![[thin space (1/6-em)]](https://www.rsc.org/images/entities/char_2009.gif) :
:![[thin space (1/6-em)]](https://www.rsc.org/images/entities/char_2009.gif) 1 and increased with increasing the time of reaction. However, using dolomite only tends to produce the lowest H2 selectivity and H2/CO ratio due to highly basicity properties of the catalyst. All catalysts showed H2/CO ratio <1 at under 200 min of reaction, because the reverse water-gas shift reaction occurred to a significant extent. Other parallel reactions such as the Boudouard reaction, reduction of CO by H2, and CH4 decomposition might affect the conversion of CH4 and CO2, which is related to the production of H2 and the H2/CO ratio. Investigation of the reaction temperature from 750 to 950 °C revealed that too low of a temperature hindered the activity of the catalyst by lowering the formation of the Ni0 active phase and a strong interaction between CO2 and catalyst. Yet, too high of temperature leads to a reverse Boudouard reaction and nickel sintering, which reduces catalytic performance. Therefore, using dolomites as a support will highly disperse NiO particles on the catalyst, thus contributing to maintaining active sites and increased catalytic stability. A study of 10% NiO/dolomite spent catalyst showed that 20% carbon was deposited after 10 h reaction. The existence of the Ni and NiO phases prove that the catalyst is still stable for the DRM reaction.
1 and increased with increasing the time of reaction. However, using dolomite only tends to produce the lowest H2 selectivity and H2/CO ratio due to highly basicity properties of the catalyst. All catalysts showed H2/CO ratio <1 at under 200 min of reaction, because the reverse water-gas shift reaction occurred to a significant extent. Other parallel reactions such as the Boudouard reaction, reduction of CO by H2, and CH4 decomposition might affect the conversion of CH4 and CO2, which is related to the production of H2 and the H2/CO ratio. Investigation of the reaction temperature from 750 to 950 °C revealed that too low of a temperature hindered the activity of the catalyst by lowering the formation of the Ni0 active phase and a strong interaction between CO2 and catalyst. Yet, too high of temperature leads to a reverse Boudouard reaction and nickel sintering, which reduces catalytic performance. Therefore, using dolomites as a support will highly disperse NiO particles on the catalyst, thus contributing to maintaining active sites and increased catalytic stability. A study of 10% NiO/dolomite spent catalyst showed that 20% carbon was deposited after 10 h reaction. The existence of the Ni and NiO phases prove that the catalyst is still stable for the DRM reaction.
Conflicts of interest
There are no conflicts to declare.Acknowledgements
This research was funded by Kementerian Pendidikan Tinggi of Long-Term Research Grant Scheme (LRSG) NanoMITE, grant number 5526308, Putra Grant IPS, grant number 9643000 and IPM, grant number 9559000, Universiti Putra Malaysia.References
- O. Edenhofer, R. Pichs-Madruga, E. Y. Sokona, S. Farahani, K. Kadner, A. Seyboth, I. Adler, S. Baum, P. Brunner, B. Eickemeier, J. Kriemann, S. Savolainen, C. Schlömer, T. von Stechow and J. C. Zwickel, IPCC, 2014: Climate Change 2014: Mitigation of Climate Change. Contribution of Working Group III to the Fifth Assessment Report of the Intergovernmental Panel on Climate Change, 2014 Search PubMed.
- T. D. F. Silva and A. Costa, Catal. Sci. Technol., 2013, 3, 635–643 RSC.
- A. M. Starik, P. S. Kuleshov, B. I. Loukhovitski and N. S. Titova, Int. J. Hydrogen Energy, 2015, 40, 9872–9884 CrossRef CAS.
- J. R. H. Ross, Catal. Today, 2005, 100, 151–158 CrossRef CAS.
- F. Fisher and H. Tropsch, Brennst.-Chem., 1928, 9, 39–42 Search PubMed.
- O. Muraza and A. Galadima, Int. J. Energy Res., 2015, 39, 1196–1216 CrossRef.
- V. C. H. Kroll, H. M. Swaan and C. Mirodatos, J. Catal., 1996, 161, 409–422 CrossRef CAS.
- S. Arora and R. Prasad, RSC Adv., 2016, 6, 108668–108688 RSC.
- J. A. Montoya, E. Romero-pascual, C. Gimon, P. Del Angel and A. Monzón, Catal. Today, 2000, 63, 71–85 CrossRef CAS.
- J. Zhang and F. Li, Appl. Catal., B, 2015, 176–177, 513–521 CrossRef CAS.
- S. Sokolov, E. V. Kondratenko, M. Pohl, A. Barkschat and U. Rodemerck, Appl. Catal., B, 2012, 113–114, 19–30 CrossRef CAS.
- M. H. Amin, K. Mantri, J. Newnham, J. Tardio and S. K. Bhargava, Appl. Catal., B, 2012, 119–120, 217–226 CrossRef CAS.
- K. Mette, S. Kühl, H. Düdder, K. Kähler, A. Tarasov, M. Muhler and M. Behrens, ChemCatChem, 2014, 6, 100–104 CrossRef CAS.
- Y. Song, E. Ozdemir, S. Ramesh, A. Adishev, S. Subramanian, A. Harale, M. Albuali, B. A. Fadhel, A. Jamal, D. Moon, S. H. Choi and C. T. Yavuz, Science, 2020, 367, 777–781 CrossRef CAS.
- V. R. Bach, A. C. de Camargo, T. L. de Souza, L. Cardozo-Filho and H. J. Alves, Int. J. Hydrogen Energy, 2020, 45, 5252–5263 CrossRef CAS.
- Q. L. M. Ha, H. Lund, C. Kreyenschulte, S. Bartling, H. Atia, T. H. Vuong, S. Wohlrab and U. Armbruster, ChemCatChem, 2020, 12, 1562–1568 CrossRef CAS.
- C. Wang, N. Sun, N. Zhao, W. Wei, Y. Sun, C. Sun, H. Liu and C. E. Snape, Fuel, 2015, 143, 527–535 CrossRef CAS.
- C. Lin, J. B. Jang, L. Zhang, E. A. Stach and R. J. Gorte, ACS Catal., 2018, 8, 7679–7687 CrossRef CAS.
- P. Liang, A. Wei, Y. Liu, Y. Zhang, J. Wu, P. Liang, A. Wei, Y. Liu, Y. Zhang and J. Wu, Mater. Res. Innovations, 2015, 19, 306–311 Search PubMed.
- Q. M. K. Waheed, C. Wu and P. T. Williams, J. Energy Inst., 2015, 89, 657–667 CrossRef.
- D. Toulouse, I. M. T. M. Albi, U. M. R. Cnrs, C. Rapsodee and C. Jarlard, Hydrogen Production From Biogas Reforming: An Overview of Steam Reforming, Dry Reforming, Dual Reforming and Tri-Reforming of Methane, Elsevier Ltd., 2018 Search PubMed.
- Y. Tian, X. Zhou, S. Lin, X. Ji, J. Bai and M. Xu, Sci. Total Environ., 2018, 645, 518–523 CrossRef CAS.
- W. R. Bandi and G. Krapf, Thermochim. Acta, 1976, 14, 221–243 CrossRef CAS.
- E. K. Powell and A. W. Searcy, J. Am. Ceram. Soc., 1978, 61, 216–221 CrossRef CAS.
- J. M. Valverde, A. Perejon and L. A. Perez-maqueda, Phys. Chem. Chem. Phys., 2015, 17, 30162–30176 RSC.
- A. E. Milodowski, D. J. Morgan and S. S. J. Warne, Thermochim. Acta, 1989, 152, 279–297 CrossRef CAS.
- A. H. De Aza, M. A. Rodrı, L. Rodrı, P. Convert, T. Hansen and X. Turrillas, J. Am. Ceram. Soc., 2004, 85, 881–888 CrossRef.
- C. Rodriguez-Navarro, K. Kudlacz and E. Ruiz-Agudo, Am. Mineral., 2012, 97, 38–51 CrossRef CAS.
- D. F. Sibley, R. E. Dedoes and T. R. Bartlett, Geology, 1987, 15, 1112–1114 CrossRef CAS.
- H. Hashimoto and T. Uematsu, J. Solid State Chem., 1980, 33, 181–188 CrossRef CAS.
- U. Kuila and M. Prasad, Geophys. Prospect., 2013, 61, 341–362 CrossRef.
- J. Rouquerol, D. Avnir, C. W. Fairbridge, D. H. Everett, J. M. Haynes, N. Pernicone, J. D. F. Ramsay, K. S. W. Sing and K. K. Unger, Pure Appl. Chem., 1994, 66, 1739–1758 CAS.
- M. Thommes, K. Kaneko, A. V. Neimark, J. P. Olivier, F. Rodriguez-reinoso, J. Rouquerol and K. S. W. Sing, Pure Appl. Chem., 2015, 87, 1051–1069 CAS.
- M. Jullien, J. Raynal, É. Kohler and O. Bildstein, Oil Gas Sci. Technol., 2005, 60, 107–120 CrossRef CAS.
- M. Du Plessis, Phys. Status Solidi A, 2007, 204, 2319–2328 CrossRef CAS.
- X. Zhong, W. Xie, N. Wang, Y. Duan, R. Shang and L. Huang, Catalysts, 2016, 6, 1–12 CrossRef.
- M. Varkolu, V. Velpula, D. R. Burri and S. R. R. Kamaraju, New J. Chem., 2016, 40, 3261–3267 RSC.
- M. L. Dieuzeide, V. Iannibelli, M. Jobbagy and N. Amadeo, Int. J. Hydrogen Energy, 2011, 37, 14926–14930 CrossRef.
- E. Salehi, F. S. Azad, T. Harding and J. Abedi, Fuel Process. Technol., 2011, 92, 2203–2210 CrossRef CAS.
- V. R. Choudhary, A. M. Rajput and A. S. Mamman, J. Catal., 1998, 585, 576–585 CrossRef.
- M. Abu Tahari, F. Salleh, S. Tengku, N. Dzakaria, A. Samsuri, M. Wahab and M. Yarmo, Int. J. Hydrogen Energy, 2018, 44, 20751–20759 CrossRef.
- K. V. Manukyan, A. Avetisyan, C. Shuck, S. Rouvimov, S. Kharatyan and A. S. Mukasyan, J. Phys. Chem., 2015, 119, 16131–16138 CAS.
- R. Sokoll, H. Hobert and I. Schmuck, J. Catal., 1990, 125, 276–284 CrossRef CAS.
- A. Hakim, T. S. Marliza, N. M. A. Tahari, R. W. N. W. Isahak, R. M. Yusop, W. M. H. Mohamed and A. M. Yarmo, Ind. Eng. Chem. Res., 2016, 55, 7888–7897 CrossRef CAS.
- J. Baltrusaitis, J. Schuttlefield, E. Zeitler and V. H. Grassian, Chem. Eng. J., 2011, 170, 471–481 CrossRef CAS.
- J. Titus, M. Goepel, S. A. Schunk, N. Wilde and R. Gläser, Catal. Commun., 2017, 100, 76–80 CrossRef CAS.
- E. P. J. Mallens, J. H. B. J. Hoebink and G. B. Marin, J. Catal., 1997, 167, 43–56 CrossRef CAS.
- Y. Toda, H. Hirayama, N. Kuganathan, A. Torrisi, P. V. Sushko and H. Hosono, Nat. Commun., 2013, 4, 1–8 Search PubMed.
- M. M. Barroso-Quiroga and A. E. Castro-Luna, Int. J. Hydrogen Energy, 2010, 35, 6052–6056 CrossRef CAS.
- H. S. Bengaard, J. K. Nørskov, J. Sehested, B. S. Clausen, L. P. Nielsen and A. M. Molenbroek, J. Catal., 2002, 209, 365–384 CrossRef CAS.
- S. Helveg, C. Lopez-Cartes, J. Sehested, P. L. Hansen, B. S. Clausen, J. R. RostrupNielsen, F. Abild-Pedersen and J. K. Nørskov, Nature, 2004, 427, 5–8 CrossRef.
- L. A. Hollingbery and T. R. Hull, Thermochim. Acta, 2010, 509, 1–11 CrossRef CAS.
- S. Bang, E. Hong, S. W. Baek and C. Shin, Catal. Today, 2018, 303, 100–105 CrossRef CAS.
- I. Luisetto, S. Tuti, C. Battocchio, S. Lo and A. Sodo, Appl. Catal., A, 2015, 500, 12–22 CrossRef CAS.
- Sudarno, S. M. Razali, N. Asikin-Mijan, S. Sivasangar and Y. H. Taufiq-Yap, Int. J. Hydrogen Energy, 2019, 44(37), 20738–20750 CrossRef CAS.
| This journal is © The Royal Society of Chemistry 2021 |

