 Open Access Article
Phase transitions in nanostructured water confined in carbon nanotubes by external electric and magnetic fields: a molecular dynamics investigation†
Mohsen Abbaspour *,
Hamed Akbarzadeh
 ,
Sirous Salemi and
Leila Bahmanipour
Department of Chemistry, Hakim Sabzevari University, Sabzevar, Iran. E-mail: m.abbaspour@hsu.ac.ir
First published on 11th March 2021
Abstract
Applying electric and magnetic fields on water molecules confined in carbon nanotubes (CNTs) has important applications in cell biology and nanotechnology-based fields. In this work, molecular dynamics (MD) simulations were carried out to examine the probable phase transitions in confined water molecules confined in (14,0) CNTs at 300 K by applying different electric and magnetic fields in the axial direction. We have also studied some thermodynamics and structural properties of the confined water molecules in the different fields. Our results showed that the confined water molecules experience. Some phase (shape) transitions from the pentagonal to twisted pentagonal, spiral and circle-like shapes by increasing the electric field from 104 (V m−1) to 107 (V m−1). Also, applying the magnetic field with different intensities has small effects on the pentagonal shape of confined water molecules but applying the highest magnetic field (300 T) makes the pentagonal shape more ordered. These phase transitions have not been reported before. Our results also indicated that the ring-like shapes obtained in the presence of the electric field form more hydrogen bonds (HBs) than the other structures. The phase transitions of confined water molecules have been also proved by radial distribution function (RDF) and angle distribution function (ADF) analyses.
1. Introduction
Water shows different behavior when experiencing external electric or magnetic fields. These behaviors of liquid water are important in many applications, such as in biotechnology and the desalination process.1 Previous studies have also shown that applying electric and magnetic fields on water molecules in carbon nanotubes (CNTs) has important application in cell biology and nanotechnology based fields such as nano-pumping.2–5Experimental investigations indicated that water confined in CNTs creates different shapes ranging from pentagonal to nanogonal nanotubes. Forming of these shapes has been also proved by molecular dynamics (MD) simulations under different temperatures, pressure, and CNT sizes.6–11 Recently, some investigations reported that the confined water molecules show phase and shape transitions when experiencing electric or magnetic fields with different intensities in different directions.12–16 For instance, Fu et al.12 studied the phase behavior of water confined in a CNT with the diameter of 1.2 nm under an external electric field using MD simulations. They found that the liquid water freezes continuously into pentagonal and helical solid-like ice nanotube by applying the different external electric field along the CNT axis. Winarto et al.13 investigated applying electric field in axial direction on the structure of water confined into CNTs with different diameters using MD simulations. They found that the external electric field induces a phase transition from liquid to ice in a wide range of CNT diameters. He et al.14 examined the external fields effects on phase transformations of water molecules encapsulated into CNTs. They reported a phase transition for water molecules from a prism to a helical structure by increasing the electric field. Meng and Huang15 investigated the electric field effect on the permeation of water from a defective CNT using MD simulations. They reported a wet–dry phase transition of at the electric field of 0.32 V nm−1. Ritos et al.16 studied the water structure within a carbon nanotube using MD simulation. They reported a molecular ordering which was enhanced by applying an axial electric field.
Understanding the properties of water molecules confined into CNT is important to find fluid transport at nanopores and to shed light on the solvation of biomolecules.17 More investigations on the effects of electric and magnetic fields effects on the encapsulated water are still required to further clarify the phenomena and its related mechanisms.18 The aim of this work is to examine the probable phase transitions of confined water molecules into (14,0) CNT by applying the different electric and magnetic fields in the axial direction. We have also studied some thermodynamics and structural properties of the confined water molecules at the different fields. To achieve this target, we have employed different functions such as energy, radial distribution function, self-diffusion coefficient, angular distribution function, and potential of mean force.
2. Simulation details
Our MD simulations have been performed on 90 water molecules confined into (14,0) CNT with the length of 50 Å (according to the work of Zhao et al.19). The snapshots of the system have been presented in Fig. S1 in the ESI.†The simulations of increasing electric fields were run in cascade from 0 (V m−1) to 109 (V m−1) in the axial (x) direction of the CNT as the following fields: No Field, E6 = 104 (V m−1), E5 = 105 (V m−1), E4 = 106 (V m−1), E3 = 107 (V m−1), E2 = 108 (V m−1), and E1 = 109 (V m−1). Then, to approve phase transitions, the simulations of decreasing electric fields were also run in cascade from 109 (V m−1) to 0 (V m−1). Previous works have been also used the external electric fields up to the order of 109 (V m−1) in their simulations.12–14,20 Recently, high energy X-ray diffraction experiments were used to apply electric field of 106 (V m−1) and 109 (V m−1) on a series of floating water bridges.21
The simulations of increasing magnetic fields were run in cascade in the axial direction as the following fields: no field, M3 = 10.5 (T), M2 = 100 (T), and M1 = 300 (T). The simulations of decreasing magnetic fields were also run in cascade from M1 = 300 (T) to 0 (T). Recently, an ultra-high magnetic field was generated by the electro-magnetic flux compression technique and achieved maximum magnetic field intensity of 763 T.22 A magnetic field of 370 T has been also generated by the electro-magnetic flux compression destructive pulsed magnet-coil technique to single-chirality semiconducting carbon nanotubes.23 Magnetic fields up to the order of 100 T have been also used to investigate thermodynamic properties of magnetic nanofluids in channel.24
The simulations were performed for 20 ns of equilibration followed by production time of 5 ns for calculated properties. In our simulations, the CNT was kept in fixed position.
All of the simulations have been carried out in the NVT ensemble and the Nosé–Hoover thermostat was used at 300 K with the relaxation time of 0.1 ps. The DL_POLY 4.03 (ref. 25) was used with the Verlet leapfrog algorithm with the time step of 1 fs. The Ewald summation method has been used for electrostatic interactions. The cutoff distance was 12 Å. Periodic boundary conditions have been used in all three directions. To avoid artificial influence from periodic images, the CNT was kept in the center of a simple orthorhombic box with vacuum on both sides separating it from the next periodic image in Z direction. We have used the SPC/E26 model for the confined water molecules. The Lennard-Jones potential was also used to represent the interactions between the water molecules and the CNT.27 The LJ parameters for the different interactions were also given in Table 1.
| Interaction | ε (eV) | σ (Å) | q (C) |
|---|---|---|---|
| O(water)–O(water) | 0.006737 | 3.166 | −0.8476 |
| H(water)–H(water) | 0 | 0 | 0.4238 |
| C(CNT)–C(CNT) | 0.002413 | 3.4 |
The electric force was computed in our simulations force-field from the following equation:
| F = q × E | (1) |
| F = q(ν × H) | (2) |
3. Results and discussion
3.1 Energy and stability
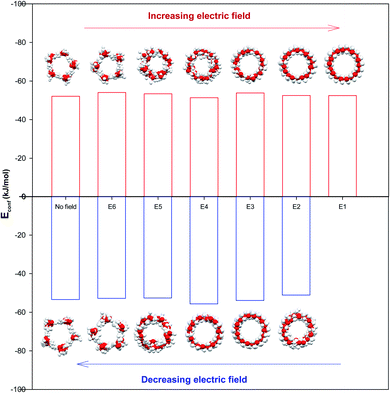
The configurational energy of confined water molecules into the CNT has been presented in both increasing and decreasing processes in the electric and magnetic fields at 300 K in Fig. 1 and 2, respectively. According to Fig. 1, applying the electric field has small effect on the configurational energy and the stability of confined water molecules. Initially, applying the E6 makes the confined molecules more stable and the energy becomes more negative. Then, some shape transitions take place by increasing the electric field. According to the snapshots inserted in Fig. 1, the shape of confined water molecules changes from the ordered pentagonal to a twisted pentagonal by increasing the field from E6 to E5 which also makes the system a little unstable. After that, increasing the electric field from E5 to E4 leads to a spiral shape which is more unstable. Finally, the shape of confined molecules changes to a circle-like shape by increasing the electric field from E4 to E3. Interestingly, the resulted shape is more stable than the shape at E4 and E5. The shape of water molecules does not change by more increasing the electric field from E3 to E1 but, they form more ordered a circle-like shape. These phase transitions can be also better observed in Fig. 3. As Fig. 1 shows, the shape transitions from circle-like shape to normal pentagonal shape can be also observed by decreasing the electric field from E1 to “No Field”. These results show that the phase transitions are take place only by applying the external electric fields.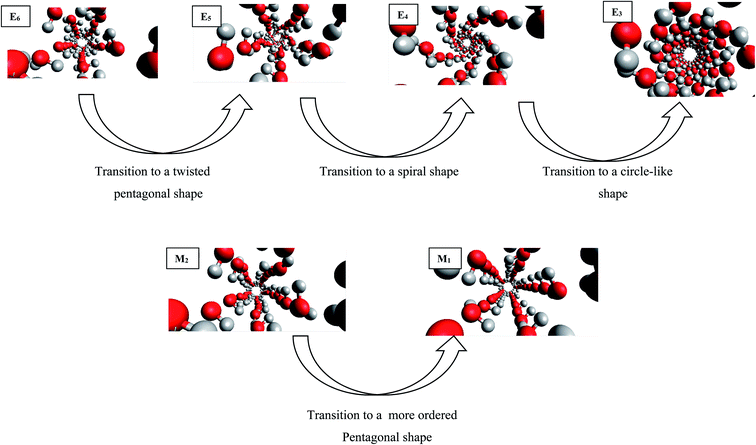 | ||
| Fig. 3 The shape transitions of confined water into the CNT at the different electric and magnetic fields. | ||
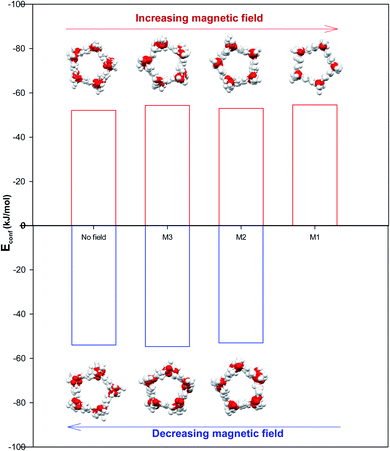
It is also shown in Fig. 2 that applying the magnetic fields has small effect on the configurational energy of the confined molecules. However, the confined molecules form more ordered pentagonal shape by applying the strongest magnetic field (M1) and become more stable. This small shape transition can be also better observed in Fig. 3. As Fig. 3 shows, the shape transition from more ordered pentagonal shape to less ordered pentagonal shape can be also observed by decreasing the magnetic field from M1 to “No Field”.
3.2 Shape and morphology
As Table S1 in the ESI† shows, the confined water molecules form a pentagonal shape inside the (14,0) CNT. This result is in good agreement with the simulation results of Zhao et al.19 As we discussed in the previous section, by applying the electric fields, we can observe an interesting phenomenon. The shape of confined water molecules changes from the ordered pentagonal to a twisted pentagonal by increasing the field from E6 to E5. After that, increasing the electric field from E5 to E4 leads to a spiral shape. Finally, the shape of confined molecules change to a circle-like shape by increasing the electric field from E4 to E3. This shape does not change by more increasing the electric field from E3 to E1 but, they form more ordered a circle-like shape. The shape transitions from circle-like shape to normal pentagonal shape can be also observed by decreasing the electric field from E1 to “No Field”.According to Table S2,† the magnetic fields with different intensities have small effects on this pentagonal shape but makes the pentagonal shape more ordered. Applying strongest magnetic field (M1) change the pentagonal shape to a more-ordered pentagonal shape (the side view of M1 in Table S2† also shows this phenomenon). The shape transition from more ordered pentagonal shape to less ordered shape can be also observed by decreasing the magnetic field from M1 to “No Field”.
Fu et al.12 reported a first-order solid–solid phase transition of confined water into (4,13) CNT from the pentagonal shape to a helical shape at the temperature and electric field which were different from ours (T = 295 K and E = 1.25 × 10⁹ (V m−1)). Moreover, they showed that the confined water molecules tend to position at a disordered liquid state even by applying the electric field at T = 300 K. He et al.14 reported a phase transition for confined water molecules confined into the CNT with the diameter of 5.55 Å and the electric field range of 6 × 10⁸ (V m−1) < E < 1.1 × 10⁹ (V m−1) from the pentagonal structure at T < 300 K to a square liquid at T > 300 K. Winarto et al.13 reported a phase transition for confined water molecules into (8,8) CNT from a square shape to a helical shape under an applied electric field of E = 109 (V nm−1) at 200 and 350 K. According to the previous studies, our results about the phase transitions of confined water molecules at 300 K from the pentagonal shape to the twisted pentagonal at 105 (V m−1), transition to the spiral at 106 (V m−1), and transition to the circle-like shape at the electric fields of 107 (V m−1) have not reported before. Also, the shape transition to the more-ordered pentagonal shape by increasing the magnetic field to 300 (T) has not been reported before. The origin of the difference between our phase transition results and those reported before is due to the difference between the CNT diameters, temperatures, and fields used in our simulations and the previous works.
Mechanism of the shape transitions of confined molecules by applying the external fields is related to the dipole moment in water molecules. When an external electric field is applied, the water molecules re-orient themselves along the external electric field due to strong electrostatic interactions between water dipoles and electric field. This new arrangement of the confined water molecules favors the formation of a new HB network. In the other words, when the confined water molecules experience the external field, they realign themselves along the field which may destroy the HB network and form a new HB network which leads in forming a new phase.12 We will investigate the HB properties under the external fields in the next section.
3.3 Radial distribution function
To study the structural properties of the confined water molecules into the CNT, we have computed the radial distribution function (RDF or g(r)) using the following formula:29
 | (3) |
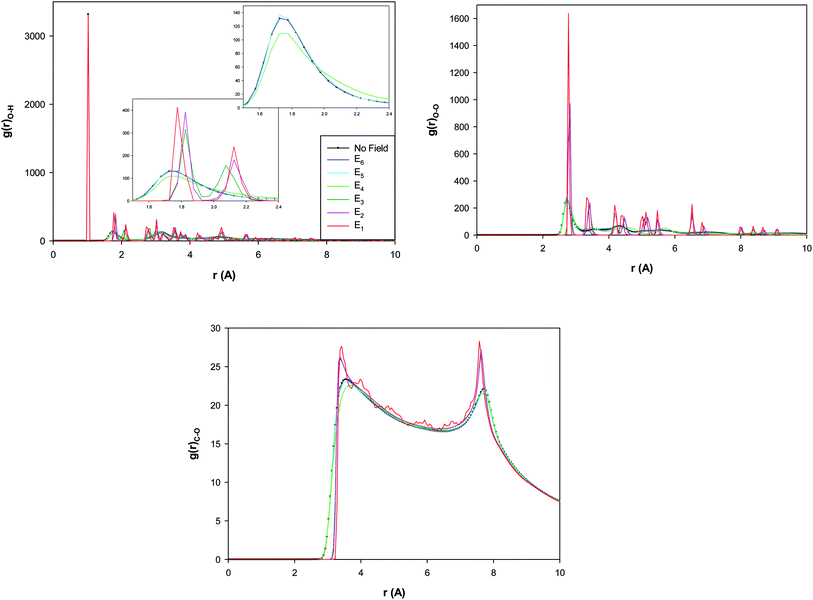
The different RDFs show a small increase from E6 to E5 which is a transition to a twisted pentagonal shape. Then, the different RDFs represent a decrease from E5 to E4 which is a transition to a spiral shape. This decrease of the second peak of O–H RDF and the first peak of O–O RDF by increasing the electric field indicate that the hydrogen bonds (HBs) decrease by increasing the electric field from E5 to E4. The decrease of HBs by applying the electric field has been reported in the before investigations30 which is due to the change of the orientations of the water molecules by applying the electric field. But, interestingly, it is observed that the RDF peaks sharply increase by increasing the electric field from E4 to E3 (which is a transition to a circle-like shape) and indicate the increase of HBs by increasing the field. It is also shown that the RDF peaks subsequently increase more by increasing the electric field from E3 to E1 (without a shape transition). According to Fig. 4, the certain ring-like structure of the confined water molecules forms more HBs than the other structures. The much features observed in the RDFs from the E3 field means that the transition from E4 to E3 is a transition from liquid to a solid-like phase (the circle-like structure). It is also found that the second O–H RDF peak and the first O–O RDF peak appear at longer distance by increasing the electric field from E4 to E3. This is also due to the shape transition to the circle-like shape in which the HB length increases.
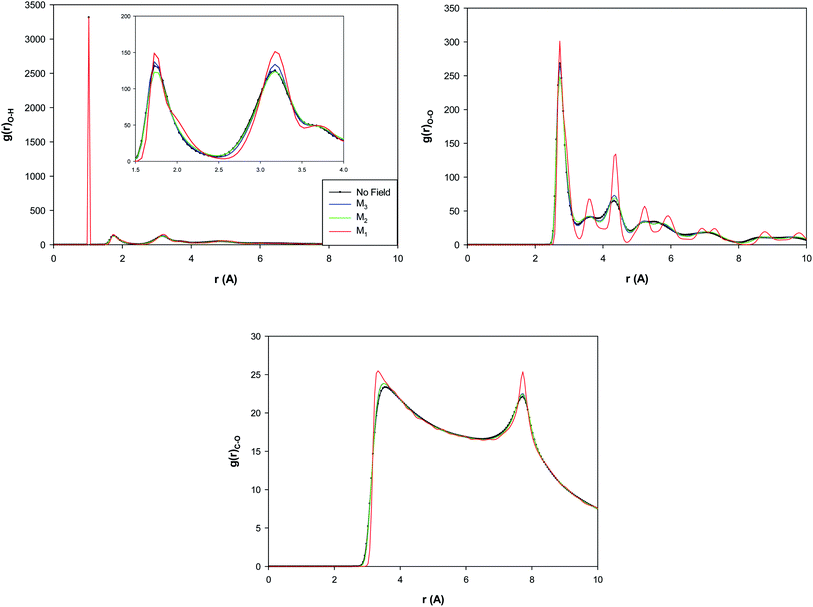
The O–H, O–O, and C–O RDFs for the confined water molecules at the different magnetic fields have been also presented in Fig. 5 at 300 K. According to Fig. 5, applying the M3 magnetic field increases the O–H and O–O RDF peaks than the “No field” state. This means that applying the M3 field increases the HBs than the no field state. This result is in good agreement with the previous MD simulations with almost the same amount of magnetic field.30–32 It is also shown that the increasing of magnetic field from M3 to M2 decreases the O–H and O–O RDFs and thus decreases the number of the HBs between the confined molecules. Interestingly, more increasing of the magnetic field from M2 to M1 much increases the RDF peaks which indicates the much increase of the HBs. This result is in agreement with the snapshots in Table S1† and Fig. 3 in which we found that applying strongest magnetic field (M1) changes the shape of confined water molecules to a more-ordered pentagonal shape. The more featured and higher RDF peaks in Fig. 5 (especially the O–O and C–O RDFs) also show that the increasing magnetic field from M2 to M1 leads to a phase transition from liquid to a solid-like phase (the ordered pentagonal structure).
3.4 Potential of mean force
The potential of mean force (PMF(r)) has been computed for the confined water molecules into the CNT at the different electric and magnetic fields and presented in Fig. 6. The PMF(r) represents the HB breaking energy30 and can be calculated by the equation:
 | (4) |
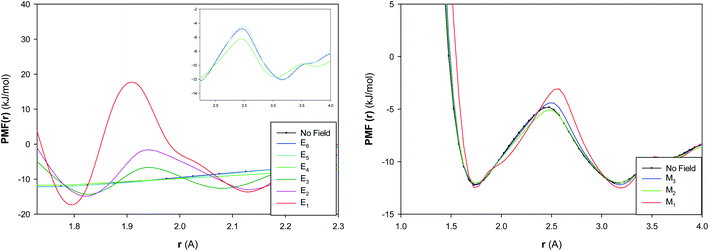 | ||
| Fig. 6 The potential of mean force of confined water into the CNT at the different electric and magnetic fields. | ||
The HB energy is the difference between the first minimum and maximum in the plot of PMF(r). According to Fig. 6, the HB energy initially shows a small increase by increasing the electric field from E6 to E5, then it decreases from E5 to E4, then it sharply increases from E4 to E3. The HB energy subsequently increases more by increasing the electric field from E3 to E1. These results are in agreement with the RDF results and also approves the phase transitions at the different fields (especially at E5, E4 and E3). It is also shown that the increasing magnetic field initially increases (a bit) the HB breaking energy from “No Field” to M3 and then decreases it from M3 to M2. The subsequent increase of magnetic field leads to much increase of HB energy from M2 to M1. These results also approve the structure change by increasing the magnetic field from M2 to M1.
3.5 Angle distribution function
The angle distribution function (ADF) has been also computed for the confined water molecules into the CNT at the different fields at 300 K using the TRAVIS software33,34 and presented in Fig. 7. The ADF illustrates the probability of finding the confined molecules at specific orientation angle. This angle is between the dipole moment vector of water and the vector perpendicular to the water surface (please refer to Fig. S2 in the ESI†).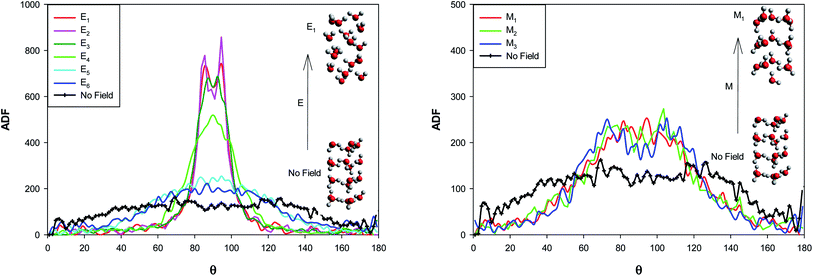 | ||
| Fig. 7 The angle distribution function for the confined water molecules into the CNT at the different electric and magnetic fields at 300 K. | ||
According to Fig. 7, at the “No Field” state, the water molecules have been oriented at the different angles, mostly in the middle angle range. By applying the electric and magnetic fields, the probability of finding the molecules at the angle closer to θ = 90° increases and the probability at θ = 0° (or 180°) decreases. This effect is more at the electric fields. As Fig. 7 shows, an small jump from E6 to E5 and two significant jumps from E5 to E4 and E4 to E3 show the more molecular orientations in the range of 80° < θ < 100° and correspond the phase transitions discussed in the previous sections (Fig. 3 and Table S1†). Increasing the electric field from E3 to E1 has small effect on the probability. This is why we can not observe any important shape transitions by more increasing of the electric field from E3 to E1.
Applying of magnetic fields has small effect on the molecular orientations but increases the orientations in the range of 60° < θ < 120°. Increasing the magnetic field from M2 to M1 leads to a small jump in the probability of the molecular orientations at θ = 90° which is responsible for the change in the shape structure observed in Fig. 3 and Table S2.†
4. Conclusion
To summarize our study, the following significant results have been obtained:• The shape of confined water molecules changes from the ordered pentagonal to a twisted pentagonal by increasing the field from E6 to E5. After that, increasing the electric field from E5 to E4 leads to a spiral shape. Finally, the shape of confined molecules changes to a circle-like shape by increasing the electric field from E4 to E3. The shape of water molecules does not change by more increasing the electric field from E3 to E1 but, they form more ordered a circle-like shape.
• The confined molecules form more ordered pentagonal shape by applying the strongest magnetic field (M1).
• Mechanism of the shape transitions of confined molecules by applying the external fields is related to the dipole moment in water molecules. When an external electric field is applied, the water molecules re-orient themselves along the external electric field due to strong electrostatic interactions between water dipoles and electric field. This new arrangement of the confined water molecules favors the formation of a new HB network.
• The RDF results showed that the number of hydrogen bonds (HBs) decrease by increasing the electric field from E5 to E4. But, the HBs increase by increasing the electric field from E4 to E3 (which is a transition to a circle-like shape).
• The much features observed in the RDFs from the E3 field means that the transition from E4 to E3 is a transition from liquid to a solid-like phase (the circle-like structure). The shape transition to the circle-like shape also increases the HB length.
• Applying the M3 field increases the number of HBs than the no field state. Increasing of magnetic field from M3 to M2 decreases the number of the HBs between the confined molecules. Interestingly, more increasing of the magnetic field from M2 to M1 much increases the number of HBs.
• The increasing magnetic field from M2 to M1 leads to a phase transition from liquid to a solid-like phase (the ordered pentagonal structure).
• According to the ADF results, by applying the electric and magnetic fields, the probability of finding the molecules at the angle closer to θ = 90° increases and the probability at θ = 0° (or 180°) decreases. This effect is more at the electric fields. By increasing the electric fields from E6 to E3, the ADF curves show significant jumps toward the molecular orientations in the range of 80° < θ < 100° which correspond the phase transitions. Increasing the electric field from E3 to E1 has small effect on the probability. This is why we have not observed any important shape transitions by more increasing of the electric field from E3 to E1.
• Applying of magnetic fields has small effect on the molecular orientations but increases the orientations in the range of 60° < θ < 120°. Increasing the magnetic field from M2 to M1 leads to a small jump in the probability of the molecular orientations at θ = 90° which is responsible for the change in the shape structure.
Conflicts of interest
There are no conflicts to declare.References
- K. T. Chang and C. I. Weng, J. Appl. Phys., 2006, 100, 043917 CrossRef.
- J. Kou, X. Zhou, H. Lu, Y. Xu, F. Wu and J. Fan, Soft Matter, 2012, 8, 12111–12115 RSC.
- J. Su and H. Guo, ACS Nano, 2011, 5, 351–359 CrossRef CAS PubMed.
- K. F. Rinne, S. Gekle, D. J. Bonthuis and R. R. Netz, Nano Lett., 2012, 12, 1780–1783 CrossRef CAS PubMed.
- S. De Luca, B. D. Todd, J. S. Hansen and P. J. Daivis, J. Chem. Phys., 2013, 138, 154712 CrossRef PubMed.
- W. H. Noon, K. D. Ausman, R. E. Smalley and J. Ma, Chem. Phys. Lett., 2002, 355, 445–448 CrossRef CAS.
- Y. Liu, Q. Wang, T. Wu and L. Zhang, J. Chem. Phys., 2005, 123, 234701 CrossRef PubMed.
- J. Bai, J. Wang and X. C. Zeng, Proc. Natl. Acad. Sci. U. S. A., 2006, 103, 19664–19667 CrossRef CAS PubMed.
- D. Takaiwa, I. Hatano, K. Koga and H. Tanaka, Proc. Natl. Acad. Sci. U. S. A., 2008, 105, 39–43 CrossRef CAS PubMed.
- E. Jalalitalab, M. Abbaspour and H. Akbarzadeh, New J. Chem., 2018, 42, 16258–16272 RSC.
- M. Abbaspour, H. Akbarzadeh and S. Zaeifi, Ind. Eng. Chem. Res., 2020, 59, 9642–9654 CrossRef CAS.
- Z. Fu, Y. Luo, J. Ma and G. Wei, J. Chem. Phys., 2011, 134, 154507 CrossRef PubMed.
- W. E. Yamamoto and K. Yasuoka, Water, 2017, 9, 473 CrossRef.
- Y. He, G. Sun, K. Koga and L. Xu, Sci. Rep., 2014, 4, 1–5 Search PubMed.
- X. Meng and J. Huang, Int. J. Mod. Phys. B, 2016, 30, 1650019 CrossRef CAS.
- K. Ritos, M. K. Borg, N. J. Mottram and J. M. Reese, Philos. Trans. R. Soc., A, 2016, 374, 20150025 CrossRef PubMed.
- G. Cicero, J. C. Grossman, E. Schwegler, F. Gygi and G. Galli, J. Am. Chem. Soc., 2008, 130, 1871–1878 CrossRef CAS PubMed.
- Y. Z. Guo, D. C. Yin, H. L. Cao, J. Y. Shi, C. Y. Zhang, Y. M. Liu, H. H. Huang, Y. Liu, Y. Wang, W. H. Guo and A. R. Qian, Int. J. Mol. Sci., 2012, 13, 16916–16928 CrossRef CAS PubMed.
- W. Zhao, L. Wang, J. Bai, J. S. Francisco and X. C. Zeng, J. Am. Chem. Soc., 2014, 136, 10661–10668 CrossRef CAS PubMed.
- X. P. Li, G. P. Kong, X. Zhang and G. W. He, Appl. Phys. Lett., 2013, 103, 143117 CrossRef.
- L. B. Skinner, C. J. Benmore, B. Shyam, J. K. R. Weber and J. B. Parise, Proc. Natl. Acad. Sci. U. S. A., 2012, 109, 16463–16468 CrossRef CAS PubMed.
- D. Nakamura, H. Sawabe and S. Takeyama, arXiv prep, 2017, arXiv:1705.05520.
- D. Nakamura, T. Sasaki, W. Zhou, H. Liu, H. Kataura and S. Takeyama, Phys. Rev. B: Condens. Matter Mater. Phys., 2015, 91, 235427 CrossRef.
- D. Song, D. Jing, B. Luo, J. Geng and Y. Ren, J. Appl. Phys., 2015, 118, 045101 CrossRef.
- I. T. Todorov, W. Smith, K. Trachenko and M. T. Dove, J. Mater. Chem., 2006, 16, 1911–1918 RSC.
- H. J. C. Berendsen, J. R. Grigera and T. P. Straatsma, J. Phys. Chem., 1987, 91, 6269–6271 CrossRef CAS.
- H. Mosaddeghi, S. Alavi, M. H. Kowsari and B. Najafi, J. Chem. Phys., 2012, 137, 184703 CrossRef PubMed.
- I. T. Todorov and W. Smith, The DL Poly 4 User Manual, 2012, v. 4.03.4 available at, http://www.afs.enea.it/software/dlpoly/USRMAN4.03.pdf Search PubMed.
- M. P. Allen and D. J. Tildesley, Computer Simulation of Liquid, Clarendon, Oxford, 1997 Search PubMed.
- M. Razmkhah, F. Moosavi, M. T. H. Mosavian and A. Ahmadpour, Desalination, 2018, 432, 55–63 CrossRef CAS.
- H. Inaba, T. Saitou, K. I. Tozaki and H. Hayashi, J. Appl. Phys., 2004, 96, 6127–6132 CrossRef CAS.
- Y. Z. Guo, D. C. Yin, H. L. Cao, J. Y. Shi, C. Y. Zhang, Y. M. Liu, H. H. Huang, Y. Liu, Y. Wang, W. H. Guo and A. R. Qian, Int. J. Mol. Sci., 2012, 13, 16916–16928 CrossRef CAS PubMed.
- M. Brehm, M. Thomas, S. Gehrke and B. Kirchner, J. Chem. Phys., 2020, 152, 164105 CrossRef CAS PubMed.
- M. Brehm and B. Kirchner, J. Chem. Inf. Model., 2011, 51, 2007–2023 CrossRef CAS PubMed.
Footnote |
| † Electronic supplementary information (ESI) available. See DOI: 10.1039/d0ra09135a |
| This journal is © The Royal Society of Chemistry 2021 |

