 Open Access Article
MoS2/polyaniline/functionalized carbon cloth electrode materials for excellent supercapacitor performance
Yanfang Wanga,
Xinrong Lva,
Suyan Zoua,
Xiaoyun Lin *ab and
Yongnian Ni
 a
a
aCollege of Chemistry, Nanchang University, Nanchang 330031, China. E-mail: linxiaoyun@ncu.edu.cn; Fax: +86 791 83969500; Tel: +86 791 83969500
bJiangxi Province Key Laboratory of Modern Analytical Science, Nanchang University, Nanchang 330031, China
First published on 17th March 2021
Abstract
In this study, molybdenum disulfide (MoS2), polyaniline (PANI) and their composite (MoS2/PANI) were facilely prepared via a liquid-phase method and in situ polymerization. An MoS2/PANI/functionalized carbon cloth (MoS2/PANI/FCC) was facilely constructed by a drop-casting method. MoS2/PANI-10/FCC displays remarkable electrochemical performances, and its specific capacitances varied from 452.25 to 355.5 F g−1 at current densities ranging from 0.2 to 4 A g−1, which were higher than those of MoS2/CC (from 56.525 to 7.5 F g−1) and pure PANI/CC (319.5 to 248.5 F g−1), respectively. More importantly, the MoS2-10/PANI/FCC electrode has a long cycling life, and a capacity retention of 87% was obtained after 1000 cycles at a large current density of 10 A g−1. Moreover, the MoS2/PANI-10/FCC-based symmetric supercapacitor also exhibits excellent rate performance and good cycling stability. The specific capacitance based on the total mass of the two electrodes is 72.8 F g−1 at a current density of 0.2 A g−1 and the capacitance retention of 85% is obtained after 1000 cycles.
1. Introduction
Supercapacitors (SCs) are important storage devices due to the high power density and high energy density than fuel cells/batteries and traditional capacitors,1,2 and have received considerable attention from scientists in recent years. The capacitive property of SCs is influenced by assembled technology, electrolyte, electrode materials etc., the most important factor of which is electrode materials.3 Therefore, it is very important to develop new electrode materials with high specific capacitance, good rate capability and high cycling stability.SCs are classified into two types depending on their charge storage mechanism: electrical double layer capacitors (EDLCs) and pseudocapacitors. In general, pseudocapacitors are produced by the fast reversible faradic transitions of active materials and can yield higher specific capacitance than EDLCs.4–6
Common pseudocapacitors materials include metal hydroxides,6,7 transition metal compounds,8–11 and conductive polymers.12,13 Among these materials, polyaniline, a typical conductive polymer film, is widely used in supercapacitor electrode materials with high theoretical capacitance, good conductivity, and low cost.14,15 However, two major defects are found in PANI pseudocapacitive materials, including low practical capacitance and poor cycle stability.16,17 In addition, PANI electrode materials tend to cause a loss and unstable structural stability during the charge–discharge processes, resulting in poor supercapacitor performances, because the redox sites of the polymer backbone are not adequately stable and can be destroyed within a limited number of charge–discharge cycles. Therefore, numerous researchers focus on the architectural design of the multicomponent electrode materials to solve the above-mentioned problems. Many researchers have reported the use of two-dimensional nanosheets as the substrates for growing different nanosized PANI.18–20
Molybdenum disulfide (MoS2) nanosheet, a typical layered transition-metal sulfide, has attracted considerable attention as a supercapacitor electrode owing to its attractive properties such as high theoretical specific capacitance and good cycling stability.21–23 However, poor electrical conductivity for MoS2 limits its practical electrochemical performances. Studies have reported that the MoS2 and PANI composite is endowed with a synergistic effect and can overcome the above-mentioned deficiencies of MoS2 and improve its electrochemical performances.24,25 Furthermore, an electrode substrate is also an important factor to affect the rate capability and power density of supercapacitors.
In this study, a MoS2/polyaniline/functionalized carbon cloth electrode (MoS2/PANI/FCC) was constructed for applications in supercapacitors. MoS2 nanosheet and PANI were synthesized by a liquid-phase method, and the MoS2/PANI nanocomposite was prepared via in situ polymerization. The MoS2/PANI/FCC electrode delivers the enhanced specific capacitance and excellent cycle stability.
2. Experimental
2.1 Materials
Aniline (analytical grade), Na2MoO4·H2O (100 g, 99.95%), L-cysteine (analytical grade) and ammonium persulfate (APS) were purchased from Beijing Chemical Reagent Co., China, and used without further purification. A carbon cloth was obtained from Taiwan Carbon Energy Technology Co., Ltd.2.2 Instruments and equipment
Electrochemical experiments (cyclic voltammetry (CV) and galvanostatic charge–discharge (GCD)) were performed on a CHI660A (Shanghai Chenhua Co., Ltd.) electrochemical workstation in conjunction with a standard three-electrode system. The working electrode was a MoS2-10/PANI/FCC, the auxiliary electrode was a conductive electrode, and the reference electrode was an Ag/AgCl electrode.Electrochemical impedance spectroscopy (EIS) was performed in a 1.0 mol L−1 H2SO4 electrolyte solution, using an alternating current voltage of 10 mV, within the frequency range of 0.01–104 Hz on Instruments of AUTOLAB (PGSTAT302N, Metrohm, Switzerland) electrochemical workstation.
Transmission electron microscopy (TEM) images were recorded to characterize the morphology of MoS2 and MoS2–PANI nanomaterials with the use of a FEI Tecnai G2 F20 (Thermo Fisher Scientific – CN).
Scanning electron microscopy (SEM) images were obtained using a SU8010 instrument (Hitachi Co. Ltd., Japan).
The X-ray diffraction experiment was carried out on a Bede D1 System (Bede, UK) using Cu Kα radiation (l = 1.5406), with a Bragg angle range of 10°–70°.
2.3 Preparation of MoS2 nanosheets
MoS2 was prepared in a typical process: 0.25 g Na2MoO4·2H2O was dissolved in 25 mL deionized water and the pH value was adjusted to 6.5 with 0.1 mol L−1 HCl. Then, 0.5 g L-cysteine and 50 mL deionized water were added to the above mixture solution. After ultra-sonication for 10 min, the mixture was transferred into a 100 mL Teflon-lined stainless steel autoclave and was held at 200 °C for 36 h. After the above solution was cooled to room temperature naturally, the MoS2 composites were collected via centrifugation, washed with ultrapure water and ethanol for several times sufficiently and then dried in a vacuum at 60 °C for 12 h. Finally, the MoS2 nanosheets were obtained.2.4 Preparation of MoS2/PANI
PANI was synthesized according to the following method: 0.92 mL aniline, 20 mL of 1 mol L−1 HCl and 10 mL ethanol were dispersed into 50 mL deionized water in an ice bath (0–5 °C) with magnetic stirring. After stirring for 10 min, 10 mL 1 mol L−1 (NH4)2S2O8 was added into the above mixture drop by drop, and then stirred in an ice bath for 12 h. The obtained precipitates of PANI were washed deionized water and ethanol for several times and dried in a vacuum at 60 °C for 12 h. The dark green powder of PANI was finally obtained.Typically, MoS2/PANI composites were prepared by in situ polymerization induced by a MoS2 substrate. In a typical synthesis, 0.1 g of MoS2 was dispersed in 30 mL of 1 mol L−1 HCl by ultrasonication, and then, the mixture was placed in an ice bath. Subsequently, the fabrication process is the same as that for the preparation of the above-mentioned PANI. On the other hand, by changing the amount of MoS2 during the polymerization process, MoS2/PANI hybrid materials with different amounts of MoS2 and controllable morphologies were prepared using the same process, which were denoted as MoS2/PANI-x, where x is the mass percentage of MoS2 in the hybrid materials (x = 2, 5, 10, 15 and 38).
2.5 Preparation of MoS2/FCC, PANI/FCC or MoS2/PANI/FCC
The construction process of the working electrode is as follows: first, a carbon cloth (CC) was cut into appropriate size (1 × 2 cm2), and a few pieces of CC were fully immersed in 2.0 mol L−1 H2SO4, and the cyclic voltammetry (CV) test was carried out at the potential range from −0.8 V to 2.0 V at 100 mV s−1. The as-prepared functionalized CC (FCC) was fully washed with ultrapure water and dried in a vacuum at 80 °C. Second, the active materials (MoS2, PANI or MoS2/PANI) (80 wt%), acetylene black (10 wt%) and polytetrafluoroethylene (PTFE, 10 wt%) were mixed, and n-methyl pyrrolidone was used to homogenize the mixture. An appropriate mixture (about 3 g after drying) was evenly applied on the functionalized carbon cloth (FCC) (1 × 2 cm2), and then dried in a vacuum oven for 12 h. Finally, MoS2/FCC, PANI/FCC or MoS2/PANI/FCC was soaked in an electrolyte for 12 h for activation. The schematic of the construction process for the MoS2/PANI/FCC electrode is shown in Scheme 1.2.6 Experimental procedure
The crystal structures of the as-synthesized samples were investigated via X-ray diffraction (XRD) (Bruker D8 advance) with Cu-Kα radiation (λ = 1.54178). The morphology characterization of the as-synthesized samples was investigated via field-emission scanning electron microscopy (FESEM, SU8010) and transmission electron microscopy (TEM, FEI Tecnai G2 F20).The electrochemical tests were carried out on a three-electrode system in a 1.0 M H2SO4 aqueous electrolyte, and MoS2/FCC, PANI/FCC or MoS2/PANI/FCC, Ag/AgCl electrode and conductivity electrode were used as the working electrode, reference electrode and counter electrode, respectively. The electrochemical measurements of the electrode materials were characterized via cyclic voltammetry (CV) and galvanostatic charge–discharge (GCD) in the CHI660A electrochemical workstation (Shanghai Chenhua Co., Ltd). CV tests were performed between −0.2 V and 0.6 V (vs. Ag/AgCl) at different scan rates. GCD was carried out in the potential range of −0.2 V and 0.6 V (Ag/AgCl) at different current densities of 0.2, 0.5, 1, 1.5, 2 and 4 A g−1. Electrochemical impedance spectroscopy (EIS) measurements were also carried out in the frequency range from 100 kHz to 0.1 Hz at an open circuit potential in the Autolab (PGSTAT302N, Metrohm, Switzerland). All the electrochemical experiments were carried out at room temperature.
The specific capacitance (Cs) of the electrode material was calculated according to the following equation:
| Cs = I × Δt/(ΔV × m) | (1) |
| E = Cs × ΔV2/2 × 3.6 | (2) |
| P = (3600E)/Δt | (3) |
3. Results and discussion
3.1 Characterization of MoS2, PANI and MoS2/PANI-10
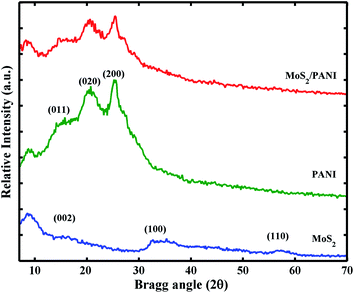
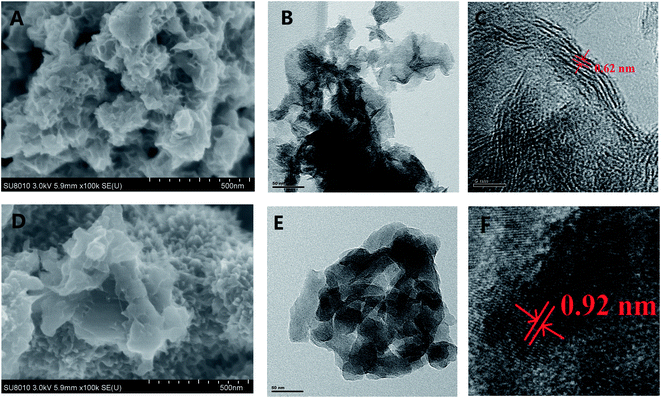
Fig. 1 shows the crystal characteristics of MoS2, PANI and MoS2/PANI-10. All the diffraction peaks (14.3°, 32.6° and 58.3°) in both samples can be assigned to hexagonal MoS2, respectively.23 For the pure PANI sample, its XRD pattern includes three peaks at approximately 14.1°, 20.5° and 25.5°, which are attributable to PANI (011), (020) and (200) planes, respectively, suggesting that PANI existed in the form of emeraldine salt.26 In addition, these three peaks of MoS2 are also observed in the MoS2/PANI-10 composite materials and the diffraction peak intensity of the hybrid material is lower than that of MoS2 and pure PANI, which may be caused by PANI nanosheets. To a certain extent PANI, the layered structure of MoS2/PANI-10 was destroyed by PANI nanosheets. Moreover, the weak diffraction peak around 20.5° for PANI is observed, suggesting that PANI is existed in a semicrystalline state in the MoS2/PANI-10.27The morphology of MoS2 and MoS2/PANI-10 was investigated by field emission scanning electron microscopy (SEM) and transmission electron microscopy (TEM) (Fig. 2). Fig. 2A and 2D show the SEM images of MoS2 and MoS2/PANI-10, and it can be seen that the precursor MoS2 had a lamellar structure with an uneven layer assembled surface (Fig. 2A). Fig. 2D shows that the layer PANI nanosheet was grown on the surface of the MoS2 nanowire arrays. TEM images of MoS2 and MoS2/PANI-10 are shown in Fig. 2B and E. From Fig. 2B, the as-prepared MoS2 was layered, but there is a stacking phenomenon in different MoS2 materials. When MoS2/PANI-10 was tested, more serious stacking phenomenon was observed and formed a disordered nano-structure (Fig. 2E), which coincided with the SEM image of MoS2/PANI-10. From the lattice fringes of the high-resolution TEM (HRTEM) image MoS2 (Fig. 1C) and MoS2/PANI-10 (Fig. 1F), lattice spacing between adjacent planes for MoS2 and MoS2/PANI-10 was measured 0.62 nm and 0.92 nm, respectively. An interplanar spacing of 0.62 nm corresponded to the (002) plane of MoS2 nanosheets, and interplanar spacing of 0.92 nm was observed in MoS2/PANI-10, indicating that amorphous PANI anchored onto the surface of the MoS2 nanosheet to form a loose structure, which is desirable for supercapacitor application because both surfaces containing thin PANI wafers are effective in contributing pseudocapacitance to the total energy storage.
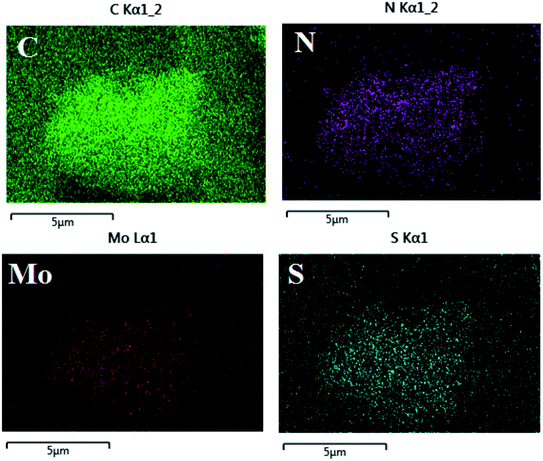
Fig. 3 shows that the uniform distribution of C, N, Mo and S elements of MoS2/PANI-10 can be seen in the elemental mapping images, which indicated that PANI was grown on the surface of MoS2 nanomaterials successfully.
In order to further analyze the composition of MoS2/PANI-10, XPS characterization was used to obtain more information. Fig. 4A shows the full-band scanning image of MoS2/PANI-10, and it can be seen that MoS2/PANI-10 is composed of Mo, S, C, N and O elements. It was explained that the elements of Mo and S originated from MoS2 nanosheet, C and N elements came from PANI, and O element may have generated by the Mo's REDOX reaction during the hydrothermal reaction. These results were consistent with the elemental mapping images of the MoS2/PANI-10 in Fig. 3. It can be seen from the XPS spectra image of C 1s (Fig. 4B) that three peaks at the binding energies of 283.5, 284.5 and 285.5 eV correspond to the following functional groups of C–C, C–N, and C–O, respectively. Two peaks of N 1s (Fig. 4C) at the binding energies of 398.8 and 399.65 eV were bound up with the corresponding functional groups for C![[double bond, length as m-dash]](https://www.rsc.org/images/entities/char_e001.gif) N- and –NH-, respectively. Fig. 4D is the XPS spectrogram of Mo 3d, and two peaks at the binding energies of 230 and 231.5 eV are attributed to Mo4+ 3d5/2 and Mo4+ 3d3/2, respectively. Also, a peak at 235.4 eV in the XPS spectrogram of Mo 3d was observed, which was mainly caused by Mo6+ 3d3/2, indicating that there existed a reactant-Na2MoO4·2H2O. In addition, from Fig. 4F, the S 2p spectrogram included two peaks of 167.8 eV (S 2p3/2) and 169 eV (S 2p1/2). Compared with the reported literatures,28–30 there was a significant shift in the peak position of S 2p for MoS2, which may be caused by the oxidation process of MoS2. Furthermore, according to the Mo, S, C and N peak area results, the quantitative percentage of Mo, S, C and N can be calculated to be 7.20%, 4.13%, 71.6% and 18.9%, respectively. As the peak area ratio for Mo6+/Mo4+ was estimated to be 1
N- and –NH-, respectively. Fig. 4D is the XPS spectrogram of Mo 3d, and two peaks at the binding energies of 230 and 231.5 eV are attributed to Mo4+ 3d5/2 and Mo4+ 3d3/2, respectively. Also, a peak at 235.4 eV in the XPS spectrogram of Mo 3d was observed, which was mainly caused by Mo6+ 3d3/2, indicating that there existed a reactant-Na2MoO4·2H2O. In addition, from Fig. 4F, the S 2p spectrogram included two peaks of 167.8 eV (S 2p3/2) and 169 eV (S 2p1/2). Compared with the reported literatures,28–30 there was a significant shift in the peak position of S 2p for MoS2, which may be caused by the oxidation process of MoS2. Furthermore, according to the Mo, S, C and N peak area results, the quantitative percentage of Mo, S, C and N can be calculated to be 7.20%, 4.13%, 71.6% and 18.9%, respectively. As the peak area ratio for Mo6+/Mo4+ was estimated to be 1![[thin space (1/6-em)]](https://www.rsc.org/images/entities/char_2009.gif) :
:![[thin space (1/6-em)]](https://www.rsc.org/images/entities/char_2009.gif) 3 according to Fig. 4D, the quantitative percentage of Mo4+ and S was 5.4% and 4.13%; that is to say, the ratio of Mo4+ and S2− are close to 1/2.28 or ∼1/2. So, and Mo element mainly existed in the form of MoS2.
3 according to Fig. 4D, the quantitative percentage of Mo4+ and S was 5.4% and 4.13%; that is to say, the ratio of Mo4+ and S2− are close to 1/2.28 or ∼1/2. So, and Mo element mainly existed in the form of MoS2.
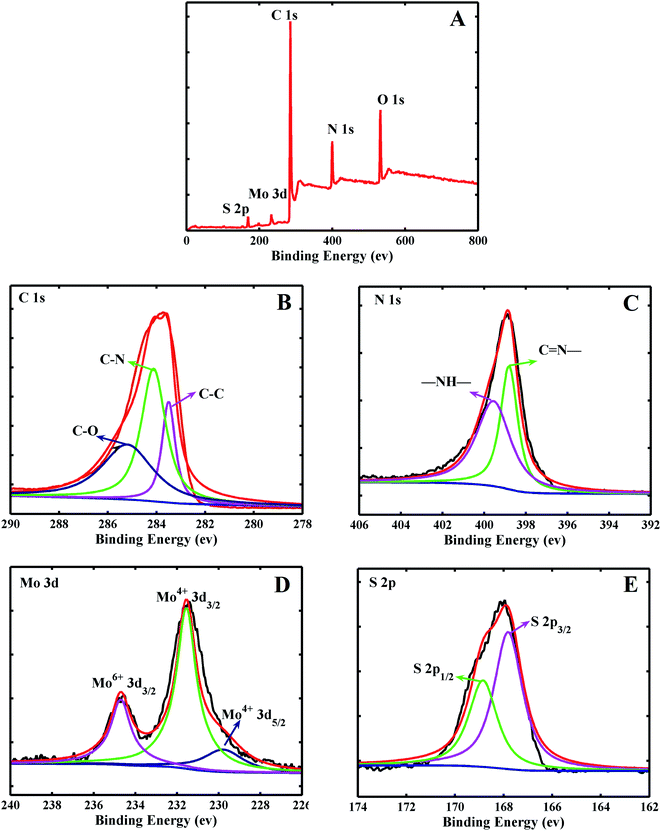 | ||
| Fig. 4 The XPS spectra image of the MoS2–PANI full spectrum (A), C 1s (B), N 1s (C), Mo 3d (D), S 2p (E). | ||
3.2 Electrochemical properties for MoS2/FCC, PANI/FCC and MoS2/PANI-x/FCC
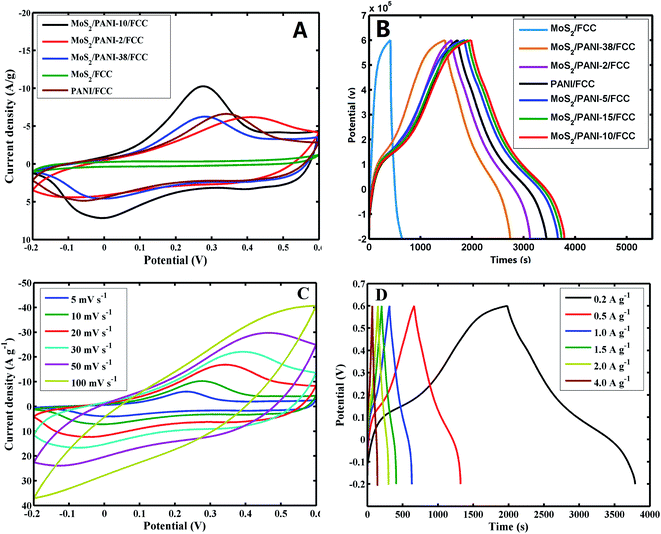
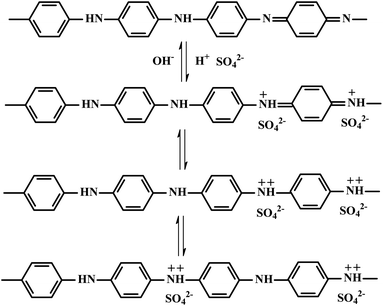
To explore their potential application in energy storage devices, the electrochemical properties of MoS2/FCC, PANI/FCC and MoS2/PANI-x/FCC were investigated via cyclic voltammetry (CV) and galvanostatic charge–discharge (GCD) tests in a three-electrode system in 1 M H2SO4 electrolyte. At a scan rate of 5 mV s−1, the CV curves of MoS2/FCC, PANI/FCC and MoS2/PANI-x/FCC are shown in Fig. 5A. The CV profile of MoS2/FCC revealed the typical CV curve of the electric double-layer capacitor (EDLC) within the potential window of −0.2–0.6 V (vs. Ag/AgCl). The capacitance characteristics for PANI/FCC and MoS2/PANI-x/FCC were different from that of EDLC. For PANI/FCC, a pair of distinct redox peaks was observed corresponding to the typical pseudocapacitive characteristic, which was ascribed to the transformation between the leucoemeraldine (LB) and emeraldine salt (ES) states of PANI. According to the ref. 31, the redox and conductive mechanisms of PANI could be deduced (Scheme 2). Compared with PANI/FCC and MoS2/FCC, the resultant MoS2/PANI-x/FCC possessed both pseudocapacitance and EDLC capacitance with significantly increased current densities and expanded the integral area of the CV curves, which resulted in a distinctly higher electrochemical capacitance than that of bare PANI/FCC and MoS2/FCC. The results could be due to the synergistic effects between PANI and MoS2, which facilitated charge carriers to transfer back and forth from MoS2 nanosheet edges to inside and outside of PANI.16,26 In addition, MoS2/PANI-x/FCC (MoS2/PANI-2/FCC, MoS2/PANI-5/FCC, MoS2/PANI-10/FCC, MoS2/PANI-15/FCC and MoS2/PANI-38/FCC) were tested by CV, and MoS2/PANI-10/FCC showed drastically enhanced current response, indicating that only a moderate amount ratio of PANI to MoS2 can obtain the desirable capacitance.Furthermore, the GCD curves of MoS2/FCC, PANI/FCC and MoS2/PANI-x/FCC are shown in Fig. 5B, which were measured at a constant current density of 0.2 A g−1 with voltage between −0.2 and 0.6 V. The results indicated that the capacitance of MoS2/FCC and PANI/FCC were 56.53 and 319.5 F g−1, respectively. A maximum capacitance (452.25 F g−1) was obtained when the amount of MoS2 was 10% (MoS2/PANI-10/FCC). When the amount of MoS2 increased to 15% and reduced to 5%, the capacitances of the MoS2/PANI-15/FCC and MoS2/PANI-5/FCC were calculated to be 428.6 F g−1 and 392.3 F g−1, respectively. However, when the amount of MoS2 was 38% and 2%, and the capacitance of MoS2/PANI-38/FCC and MoS2/PANI-2/FCC reduced to 189.7 F g−1 and 252.6 F g; this could be because MoS2/PANI-10/FCC had a higher electronic conductivity than other components due to the uniform dispersion of PANI on the surface of the MoS2 sheet, which enhanced the charge transfer and facilitated the redox reactivity of PANI.
Fig. 5C shows the CVs of MoS2/PANI-10/FCC at different scan rates. From Fig. 5C, a couple of obvious redox peaks can be observed, and the redox peak currents of MoS2/PANI-10/FCC increased significantly and maintained the peak shape of CV with the increase in the scan rate from 5 mV s−1 to 100 mV s−1, indicating extraordinary fast charge–discharge property. Moreover, it was noted that the anodic and cathodic peak potentials of MoS2/PANI-10/FCC shifted positively and negatively with the increase in the scan rate from 5 mV s−1 to 100 mV s−1, respectively, which showed that MoS2/PANI-10/FCC possessed high-rate charge or discharge properties. The specific capacitance values of MoS2/PANI-10/FCC decreased with the increase in the scan rates by calculation. This may be because the migration of ions in the electrolyte was limited at high scan rates.
Furthermore, the GCD curves of MoS2/PANI-10/FCC (Fig. 5D) displayed a pair of charge and discharge plateaus due to the synergistic effects between PANI and MoS2 to the total capacitance of composites. MoS2/PANI-10/FCC showed the specific capacitances of 452.3, 409.4, 393.8, 382, 374, 355.5 F g−1 at current densities of 0.2, 0.5, 1.0, 1.5, 2.0, 4.0 A g−1, respectively, indicating an excellent rate capability.
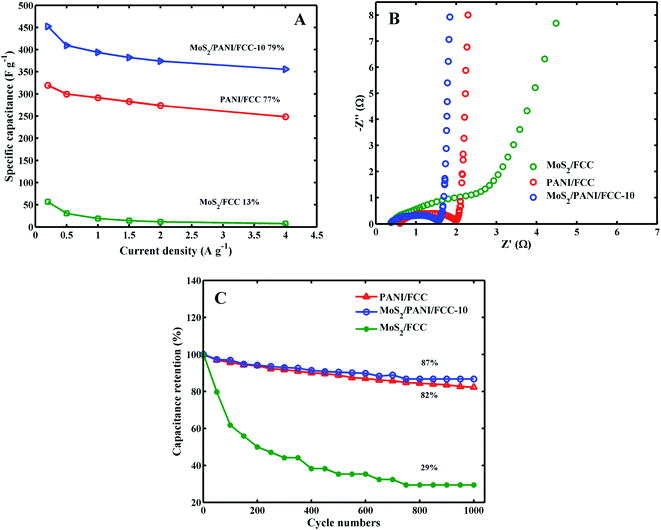
The corresponding specific capacitances for MoS2/CC, PANI/CC and MoS2/PANI-10/FCC at current densities of 0.2, 0.5, 1.0, 1.5, 2.0, 4.0 A g−1 are plotted in Fig. 6A. It can be seen that the specific capacitances for MoS2/PANI-10/FCC varied from 452.25 to 355.5 F g−1 at current densities from 0.2 to 4 A g−1, which are higher than those of MoS2/CC (from 56.53 to 7.5 F g−1) and pure PANI/CC (319.5 to 248.5 F g−1), respectively. Moreover, when the current densities were varied from 0.2 to 4.0 A g−1, the capacitance retention of MoS2/PANI-10/FCC was 79%, which was also better than that of MoS2 (13%) and PANI (77%). These results indicate that MoS2/PANI-10/FCC possessed an excellent rate capability compared with pure MoS2/FCC and PANI/FCC. The remarkable rate performance could be mainly because the layer MoS2 not only acted as an active electrode material in the electrochemical reaction but also as a framework to provide more paths for the insertion and extraction of ions within PANI.
The Nyquist plots for MoS2/FCC, PANI/FCC and MoS2/PANI-10/FCC are shown in Fig. 6B, and the plots are composed of a straight line at the lower frequency region and a semicircle at the higher frequency region. In general, the electron-transfer resistance (Ret) corresponds to the semicircular portion at higher frequencies, and its diameter is equal to the Ret. The Rets for MoS2/FCC, PANI/FCC and MoS2/PANI-10/FCC were calculated to be 2.02 Ω, 1.42 Ω and 1.19 Ω, respectively, indicating that MoS2/PANI-10/FCC had good conductivity, which endowed MoS2/PANI-10/CC with remarkable rate performance and high capacitance behavior.
Fig. 6C shows the cycle performance of MoS2/FCC, PANI/FCC and MoS2/PANI-10/FCC over 1000 charge–discharge cycles under 5.0 A g−1. It was found that MoS2/FCC maintained a bad charge–discharge performance, and the capacitance retention is 29% after 1000 cycles, and the capacity retention of 82% was obtained after 1000 cycles at the PANI/FCC. Furthermore, MoS2/PANI-10/FCC delivers a high capacitance retention of 87% after 1000 cycles. The improved stability was mainly ascribed to a gradual access of electrolyte ions to the active sites of the electrode surface due to the layer structure, in which the layer structure provides a space between PANI and effectively accommodate the mechanical deformation caused by the shrinking of the nano-structures during the long-term charge–discharge processes. MoS2/PANI-10/FCC showed excellent electrochemical properties, and the results compared with others is shown in Table 1.32–35
| Electrode materials | Cs | Cyclic stability | Ref. |
|---|---|---|---|
| MoS2/TiN nanotube | 353.2 F g−1 (0.6 A g−1) | 63% (700 cycles) | 32 |
| MoS2/activated carbon | 333.5 F g−1 (1 A g−1) | 81.8% (7000 cycles) | 33 |
| PANI/MoS2 | 400 F g−1 (0.8 A g−1) | 84% (500 cycles) | 34 |
| MoS2/PANI | 390 F g−1 (0.8 A g−1) | 86% (1000 cycles) | 35 |
| MoS2/PANI-10/FCC | 393.8 F g−1 (1.0 A g−1) | 87% (1000 cycles) | This work |
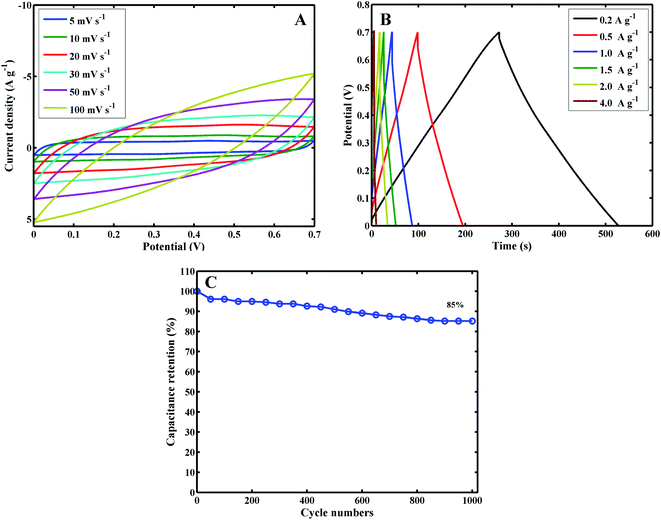
To further investigate the capacitive performance of MoS2/PANI-10/FCC, it is employed to assemble a symmetric SC with 1 M H2SO4 as the electrolyte over a voltage window of 0–0.7 V. Fig. 7 shows a series of supercapacitive measuring techniques. As expected, the redox peaks of CV profiles are maintained over a wide range of scan rates (Fig. 7A). Moreover, the charge–discharge curves keep the same shape, and their discharge counterparts show no obvious IR drops even at high current densities (Fig. 7B), demonstrating the excellent rate performance of the device. The specific capacitance based on the total mass of the two electrodes is 73 F g−1 at a current density of 0.2 A g−1, corresponding to 292 F g−1 for a single electrode when multiplying by a coefficient of 4, which complies with the test method as described by Ruoff et al. 36 Moreover, the cycle performance of the MoS2/PANI-10/FCC-based symmetric SC is tested by a charge–discharge technique at a current density of 1.5 A g−1, and the capacitance retention is 85% after 1000 cycles (Fig. 7C).
4. Conclusions
In this study, MoS2 nanosheet and PANI were synthesized by a liquid-phase method, and an MoS2/PANI nanocomposite was prepared via in situ polymerization. The MoS2/PANI nanocomposite possessed excellent physicochemical properties, such as large specific surface area, excellent conductivity and pseudocapacitive characteristic. Based on these, CC with a rich carbon element was functionalized and was used as the collecting fluid. Then, the MoS2/PANI/FCC electrode was constructed to investigate its electrochemical properties. MoS2/PANI-10/FCC showed specific capacitances of 452.3, 409.4, 393.8, 382, 374, 355.5 F g−1 at current densities of 0.2, 0.5, 1.0, 1.5, 2.0, 4.0 A g−1, respectively. Moreover, the stability of the composite electrode reached 87% after 1000 cycles. This study indicates that MoS2/PANI-10/FCC was an excellent electrochemical energy storage material, and can be applied in the field of energy storage devices.Conflicts of interest
Xiaoyun Lin declares that he has no conflict of interest. Yangfang Wang declares that she has no conflict of interest. Xinrong Lv declares that she has no conflict of interest. Yongnian Ni declares that he has no conflict of interest.Acknowledgements
The authors gratefully acknowledge the financial support of this study by the National Natural Science Foundation of China (NSFC-31860468) and the Science and Technology Innovation Platform Project of Jiangxi Province (No. 20192BCD40001).References
- C. Zhong, Y. D. Deng, W. B. Hu, J. L. Qiao, L. Zhang and J. J. Zhang, Chem. Soc. Rev., 2015, 44, 7484–7539 RSC.
- C. Z. Wu, X. L. Lu, L. L. Peng, K. Xu, X. Peng, J. L. Huang, G. H. Yu and Y. Xie, Nat. Commun., 2013, 4, 2431–2437 CrossRef PubMed.
- K. Y. Xie and B. Q. Wei, Adv. Mater., 2014, 26, 3592–3617 CrossRef CAS PubMed.
- A. Ehsani, A. A. Heidari and H. M. Shiri, Chem. Rec., 2019, 19, 908–926 CrossRef CAS PubMed.
- L. Liu, H. P. Zhao and Y. Lei, Small Methods, 2019, 3, 1800341 CrossRef.
- J. M. Goncalves, M. L. da Silva, H. E. Toma, L. Angnes, P. R. Martins and K. Araki, J. Mater. Chem. A, 2020, 8, 10534–10570 RSC.
- Y. L. Li, J. J. Zhou, M. K. Wu, C. Chen, K. Tao, F. Y. Yi and L. Han, Inorg. Chem., 2018, 57, 6202–6205 CrossRef CAS PubMed.
- W. J. Ma, S. H. Chen, S. Y. Yang, W. P. Chen, W. Weng, Y. H. Cheng and M. F. Zhu, Carbon, 2017, 113, 151–158 CrossRef CAS.
- L. L. Chai, L. J. Zhang, X. Wang, Z. J. Ma, T. T. Li, H. Li, Y. Hu, J. J. Qian and S. M. Huang, Electrochim. Acta, 2019, 321, 134680 CrossRef CAS.
- H. W. Li, T. T. Li, J. J. Qian, Y. Mei and Y. Q. Zheng, Int. J. Hydrogen Energy, 2020, 45, 14640–14647 CrossRef CAS.
- B. Ding and X. L. Wu, J. Alloys Compd., 2020, 842, 155838 CrossRef CAS.
- R. Holze, Polymers, 2020, 12, 1835 CrossRef CAS PubMed.
- H. J. Tang, J. Y. Wang, H. J. Yin, H. J. Zhao, D. Wang and Z. Y. Tang, Adv. Mater., 2015, 27, 1117–1123 CrossRef CAS.
- S. Liu, J. Zhang, R. Dong, P. Gordiichuk, T. Zhang, X. Zhang, Y. Mai, F. Liu, A. Herrmann and X. Feng, Angew. Chem., Int. Ed., 2016, 55, 12516–12521 CrossRef CAS PubMed.
- S. H. Liu, P. Gordiichuk, Z. S. Wu, Z. Y. Liu, W. Wei, M. Wagner, N. Mohamed-Noriega, D. Q. Wu, Y. Y. Mai, A. Herrmann, K. Müllen and X. L. Feng, Nat. Commun., 2015, 6, 8817–8826 CrossRef CAS PubMed.
- L. J. Ren, G. N. Zhang, J. Lei, D. W. Hu, S. M. Dou, H. X. Gu, H. Q. Li and X. B. Zhang, J. Alloys Compd., 2019, 798, 227–234 CrossRef CAS.
- Q. Wang, J. Yan, Z. J. Fan, T. Wei, M. L. Zhang and X. Y. Jing, J. Power Sources, 2014, 247, 197–203 CrossRef CAS.
- G. Anjli, S. Silki, D. Jasvir, L. Sushma, S. M. Anup, T. Rahul, P. Rajesh, S. Kuldeep and O. Anil, ACS Appl. Energy Mater., 2020, 3, 6434–6446 CrossRef.
- C. C. Wang, Y. Yang, R. J. Li, D. T. Wu, Y. Qin and Y. Kong, Chem. Commun., 2020, 56, 4003–4006 RSC.
- W. J. Luo, L. Zhang, W. Q. Wang, L. H. Ouyang and X. Xue, Energy Technol., 2019, 7, 1900522 CrossRef CAS.
- L. J. Cao, S. B. Yang and W. Gao, Small, 2013, 9, 2905–2910 CrossRef CAS PubMed.
- A. Castellanos-Gomez, R. Van Leeuwen, M. Buscema, H. S. J. van der Zant, C. A. Steele and W. J. Venstra, Adv. Mater., 2013, 25, 6719–6723 CrossRef CAS PubMed.
- Y. Mei, T. T. Li, J. J. Qian, H. W. Li, M. Wu and Y. Q. Zheng, Chem. Commun., 2020, 56, 13393–13396 RSC.
- R. Zeng, Z. C. Li, L. B. Li, Y. Z. Li, J. Huang, Y. B. Xiao, K. Yuan and Y. W. Chen, ACS Sustainable Chem. Eng., 2019, 7, 11540–11549 CrossRef CAS.
- J. Chao, L. C. Yang, H. Y. Zhang, J. W. Liu, R. Z. Hu and M. Zhu, J. Power Sources, 2020, 450, 227680 CrossRef CAS.
- L. J. Ren, G. N. Zhang, Z. Yan, L. P. Kang, H. Xu, F. Shi, Z. B. Lei and Z. H. Liu, ACS Appl. Mater. Interfaces, 2015, 7, 28294–28302 CrossRef CAS PubMed.
- K. Wang, X. Zhang, C. Li, H. Zhang, X. Sun, N. Xu and Y. Ma, J. Mater. Chem. A, 2014, 2, 19726–19732 RSC.
- L. J. Ren, G. N. Zhang, D. W. Hu, S. M. Dou, H. X. Gu, H. Q. Li and X. B. Zhang, J. Alloys Compd., 2019, 798, 227–234 CrossRef CAS.
- H. Ma, Z. G. Shen and S. Ben, J. Colloid Interface Sci., 2018, 517, 204–212 CrossRef CAS PubMed.
- W. L. Zhang, D. G. Jiang, X. X. Wang, B. N. Hao, Y. D. Liu and J. Q. Liu, J. Phys. Chem. C, 2017, 121, 4989–4998 CrossRef CAS.
- G. E. Wnek, Synth. Met., 1986, 15, 213–218 CrossRef CAS.
- J. Y. Li, R. Wu and X. C. Yang, Phys. E, 2020, 118, 113951 CrossRef CAS.
- F. P. Wang, J. Ma and K. L. Zhou, Mater. Chem. Phys., 2020, 244, 122215 CrossRef CAS.
- M. Kim, Y. K. Kim, J. Kim, S. Cho, G. Lee and J. Jang, RSC Adv., 2016, 6, 27460–27465 RSC.
- J. Wang, Z. C. Wu and K. H. Hu, J. Alloys Compd., 2015, 619, 38–43 CrossRef CAS.
- M. D. Stoller and R. S. Ruoff, Energy Environ. Sci., 2010, 3, 1294–1301 RSC.
| This journal is © The Royal Society of Chemistry 2021 |


