 Open Access Article
Oxide modified aluminum for removal of methyl orange and methyl blue in aqueous solution†
Song Xie ab,
Yang Yangab,
Wei-Zhuo Gai
 c and
Zhen-Yan Deng*abd
aEnergy Materials & Physics Group, Department of Physics, Shanghai University, Shanghai 200444, China. E-mail: zydeng@shu.edu.cn; Tel: +86-21-66134334
bInstitute of Low-Dimensional Carbon and Device Physics, Shanghai University, Shanghai 200444, China
cCollege of Physics and Electronic Information, Henan Key Laboratory of Electromagnetic Transformation and Detection, Luoyang Normal University, Luoyang 471934, China
dShanghai Key Laboratory of High Temperature Superconductors, Shanghai University, 99 Shangda Road, Shanghai 200444, China
First published on 4th January 2021
Abstract
In this work, pristine aluminum (Al) powder was soaked in deionized water for a time period and then it was dried and heat-treated at 400 °C such that a layer of fine Al2O3 grains covered the Al particle surfaces, forming oxide modified Al powder (OM-Al). It was found that OM-Al greatly enhanced the efficiency in removing methyl orange (M-orange) and methyl blue (M-blue) in aqueous solution. The time to completely degrade M-orange and M-blue by OM-Al is about one third of that by pristine Al powder, and decreases with increasing dosage of OM-Al. The enhancement in dye removal rate by oxide modification is much better than that with ultrasonic assistance, especially for M-blue. LC/MS spectrum analyses revealed that large dye molecules are broken into small biodegradable organic molecules after reaction with OM-Al. It is deduced that the promotion of fine Al2O3 on the hydration process of Al surface passive oxide film is the main mechanism responsible for the enhancement of dye removal by OM-Al. Furthermore, OM-Al has a good recyclability and 80% of M-orange and M-blue can be removed even when it was reused for up to three cycles. These results indicate that oxide modification is an effective way to activate Al for the removal of organic dyes.
1. Introduction
With the development of economics and society, environmental pollution is a global issue and has received much attention.1–3 A variety of pollutants such as heavy metals, organic pollutants and nutrients are discharged from industrial activities, leading to a poor quality of surface water.4–11 Every year, large amounts of organic dyes are consumed in textile, printing, leather processing and other industries.12,13 Some of them enter into the natural water system, becoming one of the sources of water pollution.14,15 It is recognized that organic dyes are refractory, carcinogenic, coloring and harmful to aquatic organisms.16,17In the past few years, different methods were developed to remove organic dyes from water such as adsorption/precipitation,18–21 biodegradation,22,23 advanced oxidation processes (AOPs),24,25 reduction,26,27 and combinations of the above methods.28 Another way is to pretreat organic dyes and let them transform into small biodegradable organic molecules, e.g. by reduction reaction using active metals, which then are discharged into natural water.29,30
Metal Al is low-cost and abundant on the earth, which has high electron density,31 and strong reduction ability (E0(Al3+/Al0) = −1.662 V), suitable for use in wastewater treatment. It was reported that some organic or inorganic pollutants can be efficiently reduced by zero-valent Al (ZVAl) in aqueous solution such as trichloroethylene,32 acid orange 7,33 hexabromocyclododecane (HBCD),34 Cr(VI),35 and bromate,36 etc. However, the passive oxide film on Al particle surfaces has become the bottleneck restricting its application, because it prevents the direct contact of inner metal Al with outside water.37,38 In order to improve Al reaction activity suppressed by the passive oxide film, different methods are adopted to activate Al such as acid washing,39 alkali washing,40 adding polyoxometalate (POM),41 and mechanical milling,42 etc.
Previous works,37,43,44 showed that oxide modification can improve the activity of Al powder and promote Al–water reaction to generate hydrogen at neutral pH condition. This method is expected to improve the efficiency of Al in removing organic dyes in aqueous solution, because Al is electron donors in both of pollutant removal and Al–water reaction. Azo dye methyl orange (M-orange) and complex aromatic dye methyl blue (M-blue) are two typical anionic dyes, they have stable structures and are not easily degraded. In this work, pristine Al particles were put into water for 14 h and then heat-treated in vacuum at elevated temperature so that a layer of fine Al2O3 covered on Al particle surfaces. The oxide modified Al (OM-Al) was used to remove M-orange and M-blue in aqueous solution. To the best of our knowledge, this is the first report to use OM-Al for dye degradation. The affecting factors45–47 and related physicochemical mechanism are investigated as well.
2. Materials and methods
2.1 Chemicals
High-purity Al powders with the average sizes of 100 nm, 1.32 μm and 7.29 μm were purchased from Shanghai St-nano Sci. & Tech. Co., Ltd. (Shanghai, China), Henan Yuanyang Aluminum Co., Ltd. (Henan, China), and High Purity Chemical Co., Ltd. (Tokyo, Japan), respectively. Organic dyes M-blue (C37H27N3Na2O9S3, CAS: 28983-56-4) and M-orange (C14H14N3NaO3S, CAS: 547-58-0) and anhydrous ethanol were purchased from Sinopharm Chemical Reagent Co., Ltd. (Shanghai, China). All water used in this work was deionized water (resistivity > 18 MΩ cm, pH ≈ 5.8).2.2 Preparation of oxide modified Al (OM-Al)
10 g of pure Al powder (7.29 μm) was put into a suitable amount of deionized water filled in a glass beaker and then agitated by a magnetic bar with a speed of 500 rpm at 25 °C for 14 h. The soaked Al powder was washed with anhydrous ethanol and separated by a centrifugal method for 3 times, then it was dried at 60 °C for 10 h and heat-treated in vacuum at 400 °C for 1 h. OM-Al was finally obtained after sieving the heat-treated Al powder by a 100-mesh sieve.2.3 Batch removal tests
200 mg L−1 stock solution of M-orange or M-blue was pre-prepared, and the desired lower concentration was obtained by diluting the stock solution. In a typical dye removal test, 200 mL of dye solution was put into a 500 mL Teflon beaker agitated with a constant rotating speed of 500 rpm. The reaction temperature was controlled by a thermostat water bath with an accuracy of ±1 °C. All the experiments were conducted without pH adjustment. The main absorption peak of dye solution at a preset-time was measured by UV-visible absorbance detector (UV-Vis, UV-3600, Shimadzu) through extracting and filtering 5 mL of suspension.48,49 The dye concentration and their main absorption peak height (λ ∼ 464 nm for M-orange and ∼314 nm for M-blue solution) have a linear correlation, as shown in Fig. S1.† The dye removal ratio α at time t is defined as
 | (1) |
The total organic carbon (TOC) in aqueous solution was measured by a total organic carbon analyzer (TOC, TOC-LCPN, Shimadzu). The TOC removal ratio β in aqueous solution is written as follows
 | (2) |
2.4 Recycling tests of OM-Al
After the removal test, OM-Al in dye solution was washed with deionized water and anhydrous ethanol for 3 times and collected by a centrifugal method, then it was dried at 60 °C for 1 h and finally used for next dye removal test. The removal test by reused OM-Al is 1 h and 3 h for M-orange and M-blue, respectively.2.5 Analysis methods
The morphologies of Al particles were observed via scanning electron microscope (SEM, SU-5000, JEOL). The element analyses on Al particle surfaces before and after dye removal test were performed by energy dispersive X-ray spectrometer (EDS, INCA Energy 300, Oxford Instruments) equipped on SEM. X-ray diffractometry (XRD, D/max-2200, Rigaku) was used to analyze the phase composition of Al powder. The chemical bonds and functional groups of dye and those on OM-Al before and after reaction were observed by Fourier transform infrared spectrometer (FTIR, AVATAR 370, Thermo Nicolet). The byproducts by the reaction of M-orange and M-blue with Al were identified by a liquid chromatograph fitted with a mass spectrometer (LC/MS, Qstar XL, AB SCIEX) with a Z-spray electrospray ionization (ESI) source in positive and negative mode, respectively.3. Results and discussion
3.1 Characterization
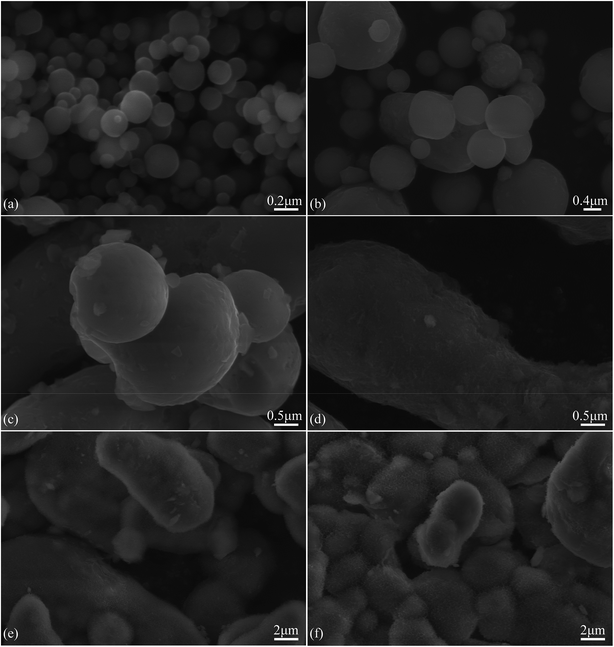
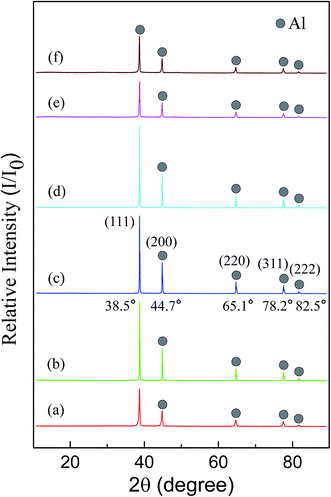
Fig. 1(a)–(c) is the SEM morphologies of three sizes of as-received Al powders used in this work. It can be seen that all pristine Al particles have smooth surfaces and spherical shape, but part of 7.29 μm Al particles are elongated. However, the surfaces of modified Al particles become rough due to the formation of fine Al2O3 grains, as shown in Fig. 1(d). It is deduced that these fine Al2O3 grains should be γ-Al2O3 phases, because the passive oxide films on Al particle surfaces are hydrated and become oxyhydroxide or hydroxide phases when Al particles are soaked in water,43 which would be transformed into γ-Al2O3 phases at the present heat-treatment temperature of 400 °C.50X-ray diffraction patterns of three sizes of as-received Al powders and OM-Al are shown in Fig. 2(a)–(d). The results show that only metal Al phase was detected in both of as-received and OM-Al powders, though fine Al2O3 phases are visible on OM-Al surfaces (Fig. 1(d)). This is because the amount of fine Al2O3 grains is below the level that X-ray diffraction technique can detect.
3.2 Effects of temperature, Al particle size and ultrasonic assistance
Before discussing the removal of organic dyes by OM-Al, we show the effects of temperature, Al particle size and ultrasonic assistance on the reaction. Fig. S2† shows the dependence of M-orange and M-blue removal in aqueous solutions on reaction time at different temperatures using 100 nm as-received Al powder. It can be seen that the removal ratio of both M-orange and M-blue is highly sensitive to temperature and it increases rapidly with the reaction temperature. M-blue is a little bit more difficult to remove than M-orange under the same condition. Meanwhile, it is noted that the removal ratio of M-blue increases fast at the initial stage of ∼10 min regardless of the reaction temperature, then enters a flat stage, and finally increases depending on temperature. It is believed that the fast increase of M-blue removal at the initial stage is due to the adsorption by nanometer Al particles, because M-blue is easier to be adsorbed by oxides than M-orange.49The higher adsorption amount of M-blue is due to its more sulfonic groups (D-SO3−) than M-orange in aqueous solution (see Fig. S3 and S4†), because the adsorption originates from the electrostatic attraction between the sulfonic groups and positive charges on Al particle surfaces. It should be mentioned that pH value in aqueous solution increases with the dye removal reaction, but it is less than 8 in our tests. At pH < 8, the zeta potential of Al particle suspension is positive and Al particle surfaces have positive charges.51 Furthermore, our experiment indicated that M-orange and M-blue are stable in aqueous solution with a pH value of 5.0–8.0 in this work.
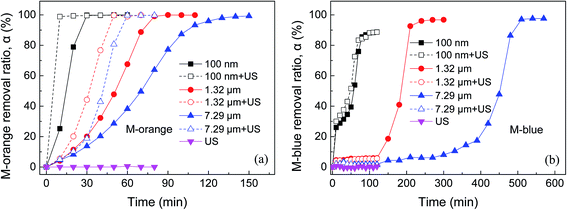
Fig. 3 shows the dependence of M-orange and M-blue removal in aqueous solutions on reaction time using different-sized as-received Al powders with and without ultrasonic assistance, where the ultrasonic assistance was realized in an ultrasonic water bath with a frequency of 40 kHz and power of 150 W. It can be seen that M-orange and M-blue removal is highly dependent on Al particle sizes and their removal rate increases with decreasing Al particle sizes, while generally M-blue is more difficult to remove than M-orange under the same condition. It is noted that there is a longer induction time for the beginning of Al and M-blue reaction, especially for 1.32 μm and 7.29 μm Al powders. The possible reason is that M-blue is easy to adsorb on Al particle surfaces, which inhibits the hydration of Al surface passive oxide films.47,49 It can be also seen that ultrasonic assistance can speed up the reaction of Al and organic dye and promote M-orange and M-blue removal in aqueous solution. However, if without Al powder, ultrasonic waves cannot degrade M-orange and M-blue in aqueous solution. The enhancement in M-orange and M-blue removal by ultrasonic assistance is due to acoustic cavitation and its resultant bubble collapse, which produce intense local heating and high pressure. Meanwhile, bubble collapse would launch micro-jets with a high velocity, which generate giant shear, strain and stress and effectively disperse Al agglomerates in suspension.51
3.3 Effect of oxide modification
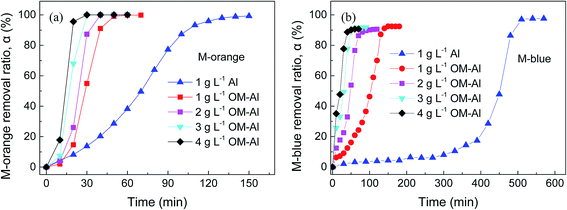
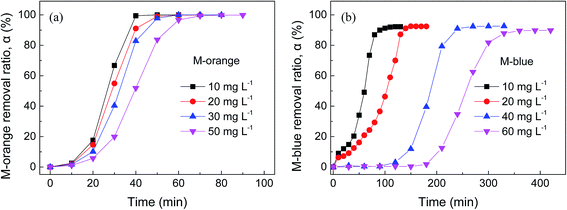
Fig. 4 shows the dependence of M-orange and M-blue removal in aqueous solution on reaction time using as-received and OM-Al powders. It can be seen that compared to pure Al powder, Al oxide modification considerably increases the removal rate of M-orange and M-blue in aqueous solution. The time to completely degrade M-orange and M-blue by OM-Al is about one third of that by pristine Al powder, which decreases with increasing the dosage of OM-Al due to more electron donors for per unit dye provided by OM-Al. Of course, generally M-orange removal rate by OM-Al is faster than that of M-blue under the same condition. The enhancement in M-orange and M-blue removal rate by oxide modification is much better than that by ultrasonic assistance, especially for M-blue (see Fig. 3). In fact, ultrasonic assistance is limited in practical application, while OM-Al can be applied in large-scale production.Fig. 5 shows the dependence of M-orange and M-blue removal in aqueous solutions on reaction time with different initial dye concentrations using OM-Al. It can be seen that the induction time for the beginning of removal reaction increases and M-orange and M-blue removal rates decrease with increasing the initial dye concentrations, leading to a longer total removal time for a higher dye concentration. This is because the increase in dye concentration leads to a decrease in electron donors for per unit dye provided by OM-Al. The same as above, the easier adsorption of M-blue on Al surfaces results in a longer induction time for the beginning of M-blue removal reaction than that of M-orange.49
3.4 Recyclability of OM-Al
As shown in Fig. 6, the removal ratios of M-orange and M-blue almost have no change at the second cycle and then decrease to ∼80% at the third cycle. At the fourth cycle, the ability of reused OM-Al in removing organic dye drops rapidly. The possible reason is that the Al–water reaction byproduct hydroxides on Al particle surfaces increase with the recycling test, as shown in Fig. 1(e) and (f), which inhibit the contact of M-orange and M-blue molecules in aqueous solution with inner Al. Although hydroxides on Al particles were not detected by X-ray diffraction (Fig. 2(e) and (f)), the peak heights decrease in reused OM-Al, confirming the consumption of Al and generation of byproducts.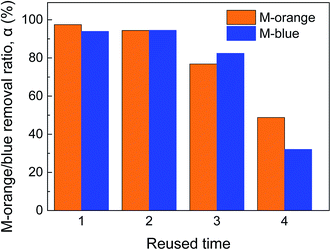 | ||
| Fig. 6 M-orange/M-blue removal using reused oxide modified 7.29 μm Al powder (CM-orange = CM-blue = 20 mg L−1, Al dosage = 1 g L−1, T = 45 °C). | ||
Table 1 gives a comparison of OM-Al with foam Al and other bio-method in degradation of organic dyes, indicating that OM-Al has a competitive efficiency in removal of M-orange and M-blue.
| Material | Reaction condition | Degradation ratio and time | Ref. |
|---|---|---|---|
| Aluminum foam | pH: 7.2, C0: 20 mg L−1, with ultrasound and direct electric current | 100%, 8 h (M-orange) | 56 |
| Periphyton | Dosage: 4 g L−1, pH: 7.0, C0: 50 mg L−1, T: 30 °C | 70%, 168 h (M-orange) | 15 |
| OM-Al | Dosage: 1 g L−1, pH: 5.9, C0: 20 mg L−1, T: 45 °C | 100%, 1 h (M-orange) | This study |
| OM-Al | Dosage: 1 g L−1, pH: 5.7, C0: 20 mg L−1, T: 45 °C | 96%, 2.5 h (M-blue) | This study |
3.5 UV-Vis absorption spectra
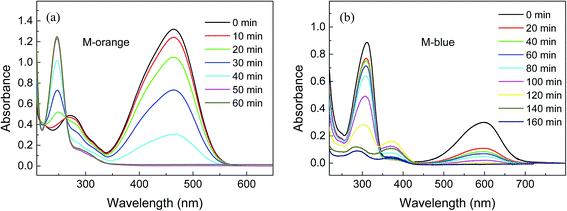
Fig. 7 shows UV-Vis absorption spectra of M-orange and M-blue in aqueous solutions and their dependence on the reaction time with 7.29 μm OM-Al. It is known that the absorption peaks of M-orange at the wavelengths of 464 nm and 275 nm (or 248 nm) in Fig. 7(a) correspond to the structures of –N![[double bond, length as m-dash]](https://www.rsc.org/images/entities/char_e001.gif) N– bond and aromatic ring in M-orange molecules, respectively.52 It can be seen that the absorption peaks of M-orange at 464 nm and 275 nm decrease and that at 248 nm increases with the reaction by OM-Al. These indicate that the chromophoric groups of M-orange molecules (λ ∼ 464 nm) decrease with the reaction time, implying that the azo bonds in M-orange molecular are broken or they are adsorbed by OM-Al.53 Meanwhile, the peak blue shift of 275 nm to 248 nm with the reaction progress is due to the change of the electron absorption transition from π–π* to n–π* in aromatic rings. The above results suggest that large M-orange molecules were decomposed into small organic molecules under the assistance of OM-Al in aqueous solution.
N– bond and aromatic ring in M-orange molecules, respectively.52 It can be seen that the absorption peaks of M-orange at 464 nm and 275 nm decrease and that at 248 nm increases with the reaction by OM-Al. These indicate that the chromophoric groups of M-orange molecules (λ ∼ 464 nm) decrease with the reaction time, implying that the azo bonds in M-orange molecular are broken or they are adsorbed by OM-Al.53 Meanwhile, the peak blue shift of 275 nm to 248 nm with the reaction progress is due to the change of the electron absorption transition from π–π* to n–π* in aromatic rings. The above results suggest that large M-orange molecules were decomposed into small organic molecules under the assistance of OM-Al in aqueous solution.
In Fig. 7(b), the absorption peak at 600 nm corresponds to –C![[double bond, length as m-dash]](https://www.rsc.org/images/entities/char_e001.gif) N– bond, –C
N– bond, –C![[double bond, length as m-dash]](https://www.rsc.org/images/entities/char_e001.gif) C– bond and the whole conjugated structure in M-blue molecules, while the maximum absorption peak at 314 nm results from the aromatic ring of M-blue molecules.54 Both of the peaks at 600 nm and 314 nm decrease with the reaction by OM-Al, especially at the beginning time of 20 min, implying that M-blue molecules were decomposed and their reaction byproduct are adsorbed. It is noted that a new absorption peak at 375 nm appears and rises at the middle stage of the reaction, but it subsequently tends to disappear with the reaction progress. This new peak probably results from the small molecule intermediate products by the reaction of M-blue with OM-Al in aqueous solution, indicating that the reaction process is complicated.
C– bond and the whole conjugated structure in M-blue molecules, while the maximum absorption peak at 314 nm results from the aromatic ring of M-blue molecules.54 Both of the peaks at 600 nm and 314 nm decrease with the reaction by OM-Al, especially at the beginning time of 20 min, implying that M-blue molecules were decomposed and their reaction byproduct are adsorbed. It is noted that a new absorption peak at 375 nm appears and rises at the middle stage of the reaction, but it subsequently tends to disappear with the reaction progress. This new peak probably results from the small molecule intermediate products by the reaction of M-blue with OM-Al in aqueous solution, indicating that the reaction process is complicated.
3.6 LC/MS analyses
LC/MS spectra of M-orange solution in the positive ion mode before and after reaction (Fig. 4(a)) with OM-Al are shown in Fig. S3,† indicating that the molecule structure of M-orange has a substantial change after reaction. The peaks at m/z = 306.11 and 328.09 in Fig. S3(a)† correspond to the cations of pristine M-orange in aqueous solution, which disappeared after reaction with Al. Several new peaks at m/z = 55.01, 121.01, 185.03 and 301.16 appear in the reacted M-orange solution, indicating that M-orange has decomposed into small biodegradable organic molecules,29,55 (Fig. S3(b)†) due to the decrease of –CH3 and –N![[double bond, length as m-dash]](https://www.rsc.org/images/entities/char_e001.gif) N– bonds in them. This implies that azo bonds can be broken efficiently by the reaction of M-orange with Al in aqueous solution, which can be written,56
N– bonds in them. This implies that azo bonds can be broken efficiently by the reaction of M-orange with Al in aqueous solution, which can be written,56| Al0 → Al3+ + 3e− | (3) |
| 2H2O + 2e− → H2↑ + 2OH− | (4) |
 | (5) |
 | (6) |
LC/MS spectra of M-blue solution in the negative ion mode before and after reaction (Fig. 4(b)) with OM-Al are shown in Fig. S4.† The peaks at m/z = 157.12 and 327.31 in Fig. S4(a)† correspond to the characteristic fragment anions of pristine M-blue in aqueous solution, while there are no strong peaks existed after the reaction of M-blue with Al (Fig. S4(b)†), indicating that M-blue has decomposed into other small organic molecules. It is noted that there is a new weak peak at m/z = 982.99 in the reacted M-blue solution, it probably belongs to the aggregates of small organic molecules due to their weak electrostatic attraction.
3.7 TOC and FTIR analyses
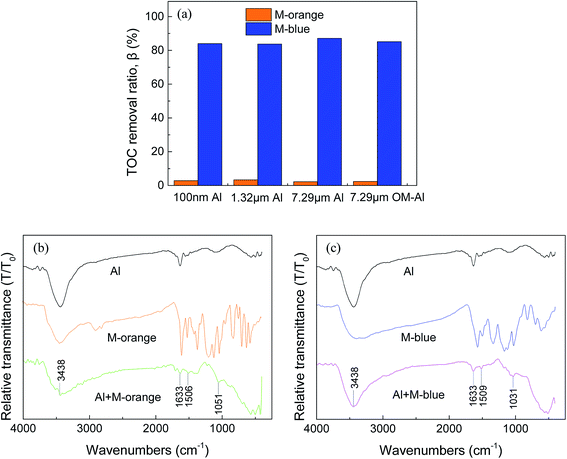
TOC in aqueous solution after M-orange and M-blue removal using different-sized Al powders (Fig. 3 and 4) is shown in Fig. 8(a). It can be seen that TOC removal ratios of M-orange and M-blue in aqueous solution after reaction with Al are very different. TOC removal ratio of M-orange is <5% for different-sized Al powders, but that of M-blue is >80%. The possible reason is that small organic molecules decomposed by M-blue are much easier to adsorb on Al particle surface oxides than those decomposed by M-orange.49,57,58 This can also explain that no strong peaks in LC/MS spectra appear after M-blue reacted with Al shown in Fig. S4(b).†FTIR spectra of organic dye, OM-Al before and after reaction with organic dye in aqueous solution are shown in Fig. 8(b) and (c). The band of 3438 cm−1 corresponds to –OH vibration, the peaks at 1633, 1506 (M-orange) and 1509 cm−1 (M-blue) belongs to the vibrations of aromatic ring skeleton, the band of 1051 cm−1 (M-orange) belongs to C–O vibration,59,60 and the band of 1031 cm−1 (M-blue) belongs to –SO3Na vibration.61,62 It can be seen that there are new peaks existed on OM-Al surfaces after it reacted with organic dye, which are different from those in FTIR spectra of pristine M-orange and M-blue in aqueous solutions. These further confirm that M-orange and M-blue have decomposed into small organic molecules after reacted with Al and these small organic molecules partly adsorbed on Al particle surface oxides.
3.8 Mechanism analyses
It is known that there is a hydration process in the passive oxide film on Al particle surfaces when they are put into water,43 which determines the induction time for the break of the passive oxide film and the contact of inner Al with outside water. After the breakage of Al surface oxide film, the reaction of inner Al with organic dye in aqueous solution begins. As γ-Al2O3 can promote the hydration process in Al passive oxide film,44 the induction time for the beginning of Al-organic dye reaction shortens. This is the main reason why Al modification by fine γ-Al2O3 grains greatly increased its efficiency in removal of M-orange and M-blue in aqueous solution (Fig. 4). Meanwhile, in this work γ-Al2O3 was obtained by the decomposition of the hydrated hydroxides on Al particle surfaces. In this case, the new formed passive oxide film on OM-Al is thinner than that on pristine Al particles, because the thickness of passive oxide film on Al is proportional to its exposure time in air.63 Therefore, the thinner passive oxide film on OM-Al is the second reason leading to its higher M-orange and M-blue removal efficiency. A schematic representation of M-orange and M-blue removal by OM-Al in aqueous solution is shown in Scheme 1.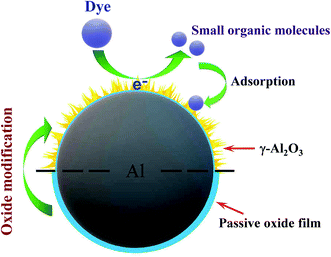 | ||
| Scheme 1 A schematic representation of M-orange and M-blue removal by oxide modified Al in aqueous solution. | ||
In fact, after the breakage of Al surface oxide film, inner Al will react with organic dye and H2O molecules simultaneously, which was confirmed by the element analyses on Al particles before and after reaction shown in Fig. S5.† It can be seen that the surfaces of reacted Al particles have more O element, implying that some aluminum hydroxides were formed by the reaction of Al with water. These mean that the dye removal reaction and Al–water reaction are competitive in consuming electrons from Al. The present results show that OM-Al can provide sufficient electrons for M-orange and M-blue removal.
4. Conclusions
In this work, oxide modified Al powder was obtained by putting Al powder in water and then heat-treating in vacuum. As fine Al2O3 grains can promote the hydration process of passive oxide film on Al particle surfaces, leading to a shorter induction time for the beginning of Al and organic dye reaction. Meanwhile, the new formed passive oxide film on OM-Al is thinner than that on pristine Al particles. Therefore, OM-Al exhibited a higher efficiency in removing M-orange and M-blue in aqueous solution than pristine Al. Furthermore, OM-Al shows a good recyclability and 80% of M-orange and M-blue can be removed when it was reused up to three cycles in the present experimental condition. The results indicate that oxide modification is a promising way to activate Al in removing organic dyes.Conflicts of interest
The authors declare that they have no known competing financial interests or personal relationships that could have appeared to influence the work reported in this paper.Acknowledgements
This work is supported by the National Natural Science Foundation of China (Grant No. 51872181).References
- M. Sillanpää, M. C. Ncibi, A. Matilainen and M. Vepsäläinen, Chemosphere, 2018, 190, 54–71 CrossRef.
- Q. Y. Lian, M. I. Konggidinata, Z. U. Ahmad, D. D. Gang, L. G. Yao, R. Subramaniam, E. Revellame, W. B. Holmes and M. Zappi, J. Hazard. Mater., 2019, 377, 381–390 CrossRef CAS.
- D. Gang, Z. U. Ahmad, Q. Y. Lian, L. G. Yao and M. E. Zappi, Chem. Eng. J., 2021, 403, 126286 CrossRef CAS.
- W. Shou, B. Chao, Z. U. Ahmad and D. D. Gang, J. Appl. Polym. Sci., 2016, 133, 43426 CrossRef.
- Z. U. Ahmad, B. Chao, M. I. Konggidinata, Q. Y. Lian, M. E. Zappi and D. D. Gang, J. Hazard. Mater., 2018, 354, 258–265 CrossRef.
- A. R. Kaveeshwar, P. S. Kumar, E. D. Revellame, D. D. Gang, M. E. Zappi and R. Subramaniam, J. Cleaner Prod., 2018, 193, 1–13 CrossRef CAS.
- A. R. Kaveeshwar, S. K. Ponnusamy, E. D. Revellame, D. D. Gang, M. E. Zappi and R. Subramaniam, Process Saf. Environ. Prot., 2018, 114, 107–122 CrossRef CAS.
- Z. U. Ahmad, Q. Lian, M. E. Zappi, P. R. Buchireddy and D. D. Gang, J. Environ. Sci., 2019, 75, 307–317 CrossRef.
- Z. U. Ahmad, Q. Y. Lian, M. E. Zappi, P. R. Buchireddy and D. D. Gang, Environ. Prog. Sustainable Energy, 2019, 38, S386–S397 CrossRef.
- Q. Y. Lian, L. G. Yao, Z. U. Ahmad, D. D. Gang, M. I. Konggidinata, A. A. Gallo and M. E. Zappi, Environ. Sci. Pollut. Res., 2020, 27, 23616–23630 CrossRef CAS.
- Q. Y. Lian, Z. U. Ahmad, D. D. Gang, M. E. Zappi, D. L. B. Fortela and R. Hernandez, Chemosphere, 2020, 248, 126078 CrossRef CAS.
- Z. U. Ahmad, L. G. Yao, J. Wang, D. D. Gang, F. Islam, Q. Y. Lian and M. E. Zappi, Chem. Eng. J., 2019, 359, 814–826 CrossRef CAS.
- Z. U. Ahmad, L. G. Yao, Q. Y. Lian, F. Islam, M. E. Zappi and D. D. Gang, Chemosphere, 2020, 256, 127081 CrossRef CAS.
- X. L. Hao, H. Liu, G. S. Zhang, H. Zou, Y. B. Zhang, M. M. Zhou and Y. C. Gu, Appl. Clay Sci., 2012, 55, 177–180 CrossRef CAS.
- S. Shabbir, M. Faheem, N. Ali, P. G. Kerr and Y. H. Wu, Chemosphere, 2017, 167, 236–246 CrossRef CAS.
- O. T. Can, M. Bayramoglu and M. Kobya, Ind. Eng. Chem. Res., 2003, 42, 3391–3396 CrossRef CAS.
- V. Katheresan, J. Kansedo and S. Y. Lau, J. Environ. Chem. Eng., 2018, 6, 4676–4697 CrossRef CAS.
- M. X. Zhu, L. Lee, H. H. Wang and Z. Wang, J. Hazard. Mater., 2007, 149, 735–741 CrossRef CAS.
- K. Y. Foo and B. H. Hameed, Chem. Eng. J., 2010, 156, 2–10 CrossRef CAS.
- L. L. Fan, Y. Zhang, C. N. Luo, F. G. Lu, H. M. Qiu and M. Sun, Int. J. Biol. Macromol., 2012, 50, 444–450 CrossRef CAS.
- D. Robati, B. Mirza, M. Rajabi, O. Moradi, I. Tyagi, S. Agarwal and V. K. Gupta, Chem. Eng. J., 2016, 284, 687–697 CrossRef CAS.
- M. Kornaros and G. Lyberatos, J. Hazard. Mater., 2006, 136, 95–102 CrossRef CAS.
- J. García-Montaño, X. Domènech, J. A. García-Hortal, F. Torrades and J. Peral, J. Hazard. Mater., 2008, 154, 484–490 CrossRef.
- W. P. Liu, H. H. Zhang, B. P. Cao, K. D. Lin and J. Gan, Water Res., 2011, 45, 1872–1878 CrossRef CAS.
- Z. Jia, J. Kang, W. C. Zhang, W. M. Wang, C. Yang, H. Sun, D. Habibi and L. C. Zhang, Appl. Catal., B, 2017, 204, 537–547 CrossRef CAS.
- E. Fernando, T. Keshavarz and G. Kyazze, Int. Biodeterior. Biodegrad., 2014, 89, 7–14 CrossRef CAS.
- S. Y. Yang, D. Zheng, T. F. Ren, Y. X. Zhang and J. Xin, Water Res., 2017, 123, 704–714 CrossRef CAS.
- X. J. Lu, B. Yang, J. H. Chen and R. Sun, J. Hazard. Mater., 2009, 161, 241–245 CrossRef CAS.
- Y. B. Zhang, Y. W. Liu, Y. W. Jing, Z. Q. Zhao and X. Quan, J. Environ. Sci., 2012, 24, 720–727 CrossRef CAS.
- M. C. Collivignarelli, A. Abbà, M. C. Miino and S. Damiani, J. Environ. Manage., 2019, 236, 727–745 CrossRef CAS.
- Z. Y. Deng, J. M. F. Ferreira and Y. Sakka, J. Am. Ceram. Soc., 2008, 91, 3825–3834 CrossRef CAS.
- T. F. Ren, S. Y. Yang, Y. T. Jiang, X. R. Sun and Y. X. Zhang, Chem. Eng. J., 2018, 348, 350–360 CrossRef CAS.
- A. Q. Wang, W. L. Guo, F. F. Hao, X. X. Yue and Y. Q. Leng, Ultrason. Sonochem., 2014, 21, 572–575 CrossRef CAS.
- Y. T. Jiang, S. Y. Yang, J. Q. Liu, T. F. Ren, Y. X. Zhang and X. R. Sun, Chemosphere, 2020, 244, 125536 CrossRef CAS.
- Y. X. Zhang, S. Y. Yang, Y. Q. Zhang, S. Wu and J. Xin, Chem. Eng. J., 2018, 353, 760–768 CrossRef CAS.
- K. A. Lin, J. Y. Lin and H. L. Lien, Chemosphere, 2017, 172, 325–332 CrossRef CAS.
- Z. Y. Deng, Y. F. Liu, Y. Tanaka, J. H. Ye and Y. Sakka, J. Am. Ceram. Soc., 2005, 88, 977–979 CrossRef CAS.
- X. N. Huang, T. Gao, X. L. Pan, D. Wei, C. J. Lv, L. S. Qin and Y. X. Huang, J. Power Sources, 2013, 229, 133–140 CrossRef CAS.
- Z. H. Cheng, F. L. Fu, Y. S. Pang, B. Tang and J. W. Lu, Chem. Eng. J., 2015, 260, 284–290 CrossRef CAS.
- G. N. Ambaryan, M. S. Vlaskin, A. O. Dudoladov, E. A. Meshkov, A. Z. Zhuk and E. I. Shkolnikov, Int. J. Hydrogen Energy, 2016, 41, 17216–17224 CrossRef CAS.
- C. C. Wu, L. C. Hus, P. N. Chiang, J. C. Liu, W. H. Kuan, C. C. Chen, Y. M. Tzou, M. K. Wang and C. E. Hwang, Water Res., 2013, 47, 2583–2591 CrossRef CAS.
- A. V. Ilyukhina, A. S. Ilyukhin and E. I. Shkolnikov, Int. J. Hydrogen Energy, 2012, 37, 16382–16387 CrossRef CAS.
- Z. Y. Deng, J. M. F. Ferreira, Y. Tanaka and J. H. Ye, J. Am. Ceram. Soc., 2007, 90, 1521–1526 CrossRef CAS.
- Z. Y. Deng, Y. B. Tang, L. L. Zhu, Y. Sakka and J. H. Ye, Int. J. Hydrogen Energy, 2010, 35, 9561–9568 CrossRef CAS.
- W. Z. Gai, W. H. Liu, Z. Y. Deng and J. G. Zhou, Int. J. Hydrogen Energy, 2012, 37, 13132–13140 CrossRef CAS.
- C. S. Fang, W. Z. Gai and Z. Y. Deng, J. Am. Ceram. Soc., 2014, 97, 44–47 CrossRef CAS.
- W. Z. Gai and Z. Y. Deng, J. Power Sources, 2014, 245, 721–729 CrossRef CAS.
- H. Wu, M. D. Ma, W. Z. Gai, H. X. Yang, J. G. Zhou, Z. X. Cheng, P. G. Xu and Z. Y. Deng, Environ. Sci. Pollut. Res., 2018, 25, 27196–27202 CrossRef CAS.
- Y. L. Ge, Y. F. Zhang, Y. Yang, S. Xie, Y. Liu, T. Maruyama, Z. Y. Deng and X. L. Zhao, Appl. Surf. Sci., 2019, 488, 813–826 CrossRef CAS.
- Z. Y. Deng, T. Fukasawa, M. Ando, G. J. Zhang and T. Ohji, Acta Mater., 2001, 49, 1939–1946 CrossRef CAS.
- Y. Yang, W. Z. Gai, Z. Y. Deng and J. G. Zhou, Int. J. Hydrogen Energy, 2014, 39, 18734–18742 CrossRef CAS.
- W. Zhong, T. Jiang, Y. L. Dang, J. K. He, S. Y. Chen, C. H. Kuo, D. Kriz, Y. T. Meng, A. G. Meguerdichian and S. L. Suib, Appl. Catal., A, 2018, 549, 302–309 CrossRef CAS.
- Y. Y. Sha, I. Mathew, Q. Z. Cui, M. Clay, F. Gao, X. Q. J. Zhang and Z. Y. Gu, Chemosphere, 2016, 144, 1530–1535 CrossRef CAS.
- X. R. Wang, W. Z. Yang, Y. Ji, X. S. Yin, Y. Liu, X. Z. Liu, F. Y. Zhang, B. H. Chen and N. Yang, RSC Adv., 2016, 6, 26155–26162 RSC.
- Y. Choi, B. Park and D. K. Cha, Korean J. Chem. Eng., 2015, 32, 1812–1817 CrossRef CAS.
- C. M. Liu, X. Y. Huang, H. Y. Zhang, J. D. Dai and C. C. Ning, Mater. Res. Express, 2018, 5, 015501 CrossRef.
- H. J. Gao, S. Y. Zhao, X. Y. Cheng, X. D. Wang and L. Q. Zheng, Chem. Eng. J., 2013, 223, 84–90 CrossRef CAS.
- Y. M. Shao, X. Wang, Y. Kang, Y. H. Shu, Q. Q. Sun and L. S. Li, J. Colloid Interface Sci., 2014, 429, 25–33 CrossRef CAS.
- A. Nezamzadeh-Ejhieh and N. Moazzeni, J. Ind. Eng. Chem., 2013, 19, 1433–1442 CrossRef CAS.
- J. Szanyi, J. H. Kwak, R. J. Chimentao and C. H. F. Peden, J. Phys. Chem. C, 2007, 111, 2661–2669 CrossRef CAS.
- R. X. Chen, J. G. Yu and W. Xiao, J. Mater. Chem. A, 2013, 1, 11682–11690 RSC.
- A. V. Ivanov, G. W. Graham and M. Shelef, Appl. Catal., B, 1999, 21, 243–258 CrossRef CAS.
- Y. Q. Wang, W. Z. Gai, X. Y. Zhang, H. Y. Pan, Z. X. Cheng, P. G. Xu and Z. Y. Deng, RSC Adv., 2017, 7, 2103–2109 RSC.
Footnote |
| † Electronic supplementary information (ESI) available. See DOI: 10.1039/d0ra09048d |
| This journal is © The Royal Society of Chemistry 2021 |

