 Open Access Article
Research on the photoluminescence properties of Cu2+-doped perovskite CsPbCl3 quantum dots†
Ronghua Wu a,
Zhongchen Bai
 ab,
Jinguo Jianga,
Heng Yaoa and
Shuijie Qin*a
aGuizhou Province Key Lab. for Photoelectric Technology and Application, Guizhou University, Guiyang City, 550025, People's Republic of China
bCollege of Medicine, Guizhou University, Guiyang City, 550025, People's Republic of China
First published on 24th February 2021
Abstract
CsPbX3 (X = Cl, Br, and I) quantum dots (QDs) and Cu2+-doped CsPbCl3 QDs with different Cu-to-Pb molar ratios were synthesized via a solvent-based thermal synthesis method. The photoluminescence (PL) properties of these Cu2+-doped CsPbCl3 QDs were also investigated in this study. The results showed that with the increase in the Cl− concentration the surface defects of CsPb(Cl/Br)3 QDs increased, which resulted in an increase in the non-radiative recombination of excitons and weakened the PL intensity. Moreover, Cu2+-doped CsPbCl3 QDs maintained the cubic crystal structure of the initial phases. Owing to the doping of Cu2+ ions, the surface defects of CsPbCl3 QDs were effectively eliminated, which facilitated the excitonic recombination via a radiative pathway. The PL quantum yields (PLQYs) of Cu2+-doped CsPbCl3 QDs were increased to 51%, showing great photostability. From the results, it is believed that Cu:CsPbCl3 QDs can be widely used in optoelectronic devices.
1 Introduction
All-inorganic cesium lead halide (CsPbX3, X = Cl, Br, and I) quantum dots (QDs) have outstanding physical and chemical properties, such as an adjustable photoluminescence in the visible light range (400–700 nm), narrow emission line width, high fluorescence quantum yields, tolerant point defects and good grain boundaries.1–7 These characteristics endow the perovskite quantum dots (PQDs) with a promising potential for the applications in optoelectronic devices such as photovoltaics,8–15 light-emitting diodes (LEDs)16–21 and lasers.22–27 Hence, PQDs have aroused widespread research interest. The luminescence color of PQDs can be controlled by either composition or size modulation, and the halogen anion exchange has proven to be an effective strategy to tune the band gap of PQDs instead of destroying the size and crystal structure of its parent nanocrystals.28In addition, the host lattice of CsPbX3 QDs is doped with the transition metal elements to replace a part of the Pb2+ ions, which can improve the optical performance.29–31 However, the practical applications of PQDs in some optoelectronic devices is restricted due to the presence of surface defects, poor stability, and easy oxidation. The elements of Cu and Mn are two representative transition metal elements doped in nanocrystals to improve their optical performance. Mn-doped QDs have stable and high PLQYs (above 50%).32,33 Since the emission of doped QDs is considered to be derived from the 4T1–6A1 transition of Mn2+, the emission wavelength is between 580 nm and 600 nm, and the respective luminous color is orange-yellow, which confines their applications. However, compared with Mn-doping, the emission wavelength of the Cu element can be tuned in the visible–near infrared region according to the composition of the main quantum dots.
Srivastava et al.34 prepared Cu:ZnS/Zn1−xCdxS QDs with PLQYs of 38%. The PLQYs of Cu:ZnInS/ZnS QDs prepared by Yuan et al.35 exceeded 40%. The PLQYs of Cu-doped CdS QDs prepared by Stouwdam et al.36 exceeded 50%. The Cu:SnO2 QDs prepared by Babu et al.37 showed a strong absorption in the visible light region. Bi et al.38 prepared CsPb1−xCuxX3 QDs (X = Br and Br/Cl) by doping Cu ions into CsPbX3 QDs, which improved their optical characteristics and thermal stability. These results illustrate that Cu2+ ions doped into QDs can effectively improve the fluorescence emission efficiency. Herein, we prepared Cu:CsPbCl3 QDs by doping Cu2+ into CsPbCl3 QDs, which eliminated the surface defects. We explained the enhancement mechanism of PLQYs from excitonic recombination via new radiative pathways. The PLQYs of Cu:CsPbCl3 QDs increased to 51%, exhibiting excellent photostability.
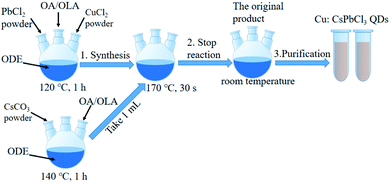
In this study, the synthesis strategy of Cu:CsPbCl3 QDs is depicted in Fig. 1. The rationale is that the metals of CsCO3, PbCl2 and CuCl2 were used as raw materials, which were mixed mechanically at high temperatures. Then, Cu replaced a part of Pb for the synthesis of nanocrystals via a solvent-based, thermal synthesis method.
2 Experimental section
2.1 Materials and chemicals
Cs2CO3 (Macklin, 99%), PbCl2 (Aladdin, 98%), PbBr2 (Macklin, 99%), PbI2 (Aladdin, 99%), 1-octadecene (ODE, Aladdin, 90%), oleic acid (OA, Aladdin, 90%), oleylamine (OLA, Aladdin, 80–90%), CuCl2 (Jinshan, 99%), and n-hexane (Fuyu, 98%) were purchased. All chemicals were used without any further purification.2.2 Preparation of the Cs-oleate solution
2.5 mL OA, 30 mL ODE and Cs2CO3 (0.8 g, 2.5 mmol) powder were put into a 100 mL three-neck flask at 140 °C for 1 h under magnetic stirring until the Cs2CO3 powder completely dissolved and the solution became transparent.2.3 Synthesis of CsPbX3 QDs
1.5 mL OA, 1.5 mL OLA and 15 mL ODE, and 0.15 g, 0.54 mmol PbCl2, 0.2 g, 0.54 mmol PbBr2, 0.25 g, 0.54 mmol PbI2, PbCl2/PbBr2 with specific molar ratios were loaded into a 100 mL three-necked flask and heated at 120 °C for 1 h to obtain CsPbCl3 QDs, CsPbBr3 QDs, CsPbI3 QDs, CsPb(Cl/Br)3 QDs, respectively. After the reaction temperature was increased to 170 °C, the Cs-oleate solution (1 mL) was quickly injected for reacting and after 30 s, the solution was cooled to room temperature in an ice bath.2.4 Synthesis of Cu:CsPbCl3 QDs
We prepared Cu:CsPbCl3 QDs with the molar ratios of CuCl2 and PbCl2 of 0.1![[thin space (1/6-em)]](https://www.rsc.org/images/entities/char_2009.gif) :
:![[thin space (1/6-em)]](https://www.rsc.org/images/entities/char_2009.gif) 1, 0.3
1, 0.3![[thin space (1/6-em)]](https://www.rsc.org/images/entities/char_2009.gif) :
:![[thin space (1/6-em)]](https://www.rsc.org/images/entities/char_2009.gif) 1, 0.5
1, 0.5![[thin space (1/6-em)]](https://www.rsc.org/images/entities/char_2009.gif) :
:![[thin space (1/6-em)]](https://www.rsc.org/images/entities/char_2009.gif) 1, 0.9
1, 0.9![[thin space (1/6-em)]](https://www.rsc.org/images/entities/char_2009.gif) :
:![[thin space (1/6-em)]](https://www.rsc.org/images/entities/char_2009.gif) 1, and 1.7
1, and 1.7![[thin space (1/6-em)]](https://www.rsc.org/images/entities/char_2009.gif) :
:![[thin space (1/6-em)]](https://www.rsc.org/images/entities/char_2009.gif) 1. The typical synthetic procedure of Cu:CsPbCl3 QDs with the Cu-to-Pb molar ratio of 0.9
1. The typical synthetic procedure of Cu:CsPbCl3 QDs with the Cu-to-Pb molar ratio of 0.9![[thin space (1/6-em)]](https://www.rsc.org/images/entities/char_2009.gif) :
:![[thin space (1/6-em)]](https://www.rsc.org/images/entities/char_2009.gif) 1 as follows: 1.5 mL OA, 1.5 mL OLA, 15 mL ODE, PbCl2 (0.097 g, 0.35 mmol) and CuCl2 (0.053 g, 0.31 mmol) powders were loaded in a 100 mL three-neck flask heated to 120 °C for 1 h. The reaction temperature was increased to 170 °C, and the Cs-oleate solution (1 mL) was quickly injected, and after 30 s, the reaction was cooled to room temperature on an ice bath.
1 as follows: 1.5 mL OA, 1.5 mL OLA, 15 mL ODE, PbCl2 (0.097 g, 0.35 mmol) and CuCl2 (0.053 g, 0.31 mmol) powders were loaded in a 100 mL three-neck flask heated to 120 °C for 1 h. The reaction temperature was increased to 170 °C, and the Cs-oleate solution (1 mL) was quickly injected, and after 30 s, the reaction was cooled to room temperature on an ice bath.
2.5 Purification
CsPbX3 and Cu:CsPbCl3 QDs were extracted from the original product via centrifugation at 8000 rpm for 5 min, and the precipitate was taken out. The resulting precipitates were dispersed in n-hexane at room temperature and were centrifuged for 5 min at a speed of 6000 rpm; the supernatant was taken, and this process was repeated twice to get CsPbX3 and Cu:CsPbCl3 QDs. Then, they were kept aside for 24 h in a freezer, and were taken out again for centrifugal purification, obtaining a clear colloidal CsPbX3 and Cu:CsPbCl3 QDs.2.6 Characterization and spectral analysis
PL spectra were obtained on a Cary Eclipse-G9800A Fluorescence Spectrophotometer from Agilent Technologies. UV-Visible (UV-Vis) spectroscopy was performed using a UV-2700 UV-Vis Spectrophotometer from Shimadzu. The doping concentrations of Cu2+ were monitored by an Agilent inductively coupled plasma-optical emission spectrometer 730 (ICP-OES730). Dried powdered samples of QDs were acid-digested and then diluted prior to measurements. The crystal structures were characterized on a Jeol-2100f transmission electron microscope (TEM) at 200 kV. TEM specimens were prepared by directly drying a drop of a dilute n-hexane solution of PQDs on the surface of a carbon-coated copper grid. Energy dispersive X-ray (EDX) measurements were performed using X-max 80 from Oxford Instruments. X-ray photoelectron spectroscopy (XPS) characterizations were conducted on a Thermo Scientific ESCALAB 250Xi spectrometer using a monochromatic Al Kα radiation source (200 W), where the sample were prepared directly by drying a drop of dilute n-hexane solution of PQDs onto an Si wafer. X-ray diffraction (XRD) measurements were performed by a Rigaku SmartLab XG X-ray diffractometer. XRD specimens were prepared by directly drying a drop of the dilute n-hexane solution of PQDs onto a glass slide. The room temperature PLQYs of PQDs were calculated by comparing the integrated emission of the PQD samples in an n-hexane solution with that of rhodamine 6G with the PLQYs of 95% in ethanol with identical optical density. Fourier transform infrared (FTIR) spectrum was obtained using a VERTEX70 Spectrometer from Bruker.3 Results and discussions
3.1 The PL and UV-Vis absorption spectra of CsPbX3 QDs
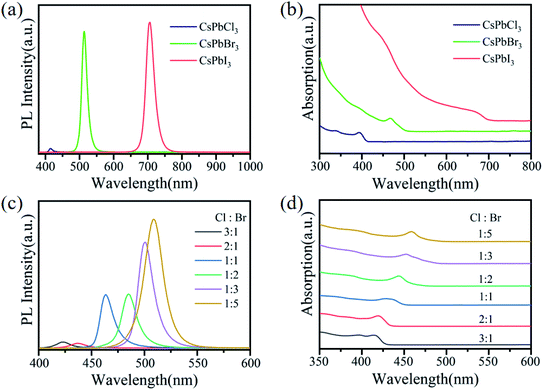
The PL and UV-Vis absorption spectra of CsPbX3 QDs are shown in Fig. 2a and b. The PL intensity of CsPbCl3 QDs was much lower than that of CsPbBr3 and CsPbI3 QDs. Owing to the surface of perovskite CsPbCl3, QDs have a serious local trap states,39 which produced non-radiative recombination and resulted in a weak PL intensity. The peaks of excitonic absorption from CsPbCl3, CsPbBr3 and CsPbI3 QDs were located at 395 nm, 469 nm and 676 nm, respectively. The red shift in the absorption peaks was caused by the weak binding ability of the halogen element.In order to observe the PL spectra of PQDs mixed with halogen elements, we prepared a series of CsPb(Cl/Br)3 QDs mixed with different Cl-to-Br molar ratios. The PL spectra and UV-Vis absorption spectra of these QDs are shown in Fig. 2c and d, respectively. The PL intensity of CsPb(Cl/Br)3 QDs decreased gradually with the increase in the Cl− ion concentrations, and the peaks of exciton emission were blue-shifted. There were Pb–Cl ion vacancies on the surface of CsPbCl3 QDs, which seriously reduced its PL efficiency.32 This illustrated that as the concentration of Cl− ions increased, the number of Pb–Cl ion vacancies on the surface also increased. This led to the non-radiative recombination of QD excitons and reduced the PL intensity of CsPb(Cl/Br)3 QDs. The peak of excitonic absorption was also blue-shifted with the increase in Cl− ion concentrations. The divalent Cu2+ in the transition metal series has a smaller ionic radius (73 pm) and can be used as a good doping element to eliminate the surface defects of the quantum dots.
To eliminate the surface defects of CsPbCl3 QDs for improving its fluorescence emission efficiency and photostability, we further doped the divalent metal Cu2+ ion in the CsPbCl3 QDs to increase the proportion of copper ions.
3.2 TEM images
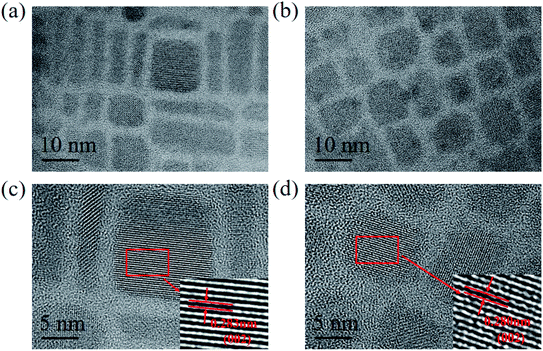
In order to illustrate the effects of Cu2+-doped on the surface structure of CsPbCl3 QDs, the TEM images of undoped and Cu2+-doped CsPbCl3 QDs are shown in Fig. 3a and b. The structural morphologies of Cu2+-doped CsPbCl3 QDs were of cubic crystal structure as CsPbCl3 QDs. These are in line with the crystal phase of PQDs prepared under the conditions of high temperature synthesis and QD surface effects.16,40 Fig. 3c and d show their HRTEM images with clear lattice fringes. As measured from their crystal plane spacings of 0.283 nm and 0.280 nm, it was found that they corresponded to (002) lattice plane of CsPbCl3 QDs. These results indicate that Cu2+-doped CsPbCl3 QDs maintain the crystal structure of the initial phases and shrink the surface lattice spacing, improving the crystallinity of QDs.3.3 XRD, XPS and EDX spectra
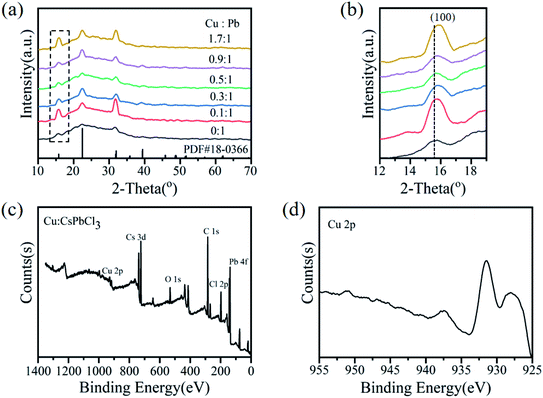
The typical XRD patterns further confirmed that the Cu:CsPbCl3 QDs prepared by different Cu-to-Pb molar ratios retained the same crystalline structure of tetragonal CsPbCl3 QDs, as shown in Fig. 4a. The diffraction characteristic peaks of undoped and Cu2+-doped CsPbCl3 QDs are similar, which correspond to the standard XRD spectra of CsPbCl3 QDs (PDF #18-0366). The peak positions of (100) moved to higher 2-theta degree values (shown in Fig. 4b) with the increase in the Cu2+ ion concentrations, which indicate that the lattice contraction and the lattice parameters became smaller.38 These results show that some of the larger Pb2+ (119 pm) ions in CsPbCl3 QDs were replaced by smaller Cu2+ (73 pm) ions. The doping concentrations of Cu ions were measured via ICP-OES (Table S1†). When Cu2+-doped CsPbCl3 QDs with the Cu-to-Pb molar ratio of 0.9![[thin space (1/6-em)]](https://www.rsc.org/images/entities/char_2009.gif) :
:![[thin space (1/6-em)]](https://www.rsc.org/images/entities/char_2009.gif) 1, its PLQYs reached 51%. Also, the doping concentration of Cu ions relative to Pb ions was 2.32%. The EDX spectrum of Cu2+-doped CsPbCl3 QDs with the Cu-to-Pb molar ratio of 0.9
1, its PLQYs reached 51%. Also, the doping concentration of Cu ions relative to Pb ions was 2.32%. The EDX spectrum of Cu2+-doped CsPbCl3 QDs with the Cu-to-Pb molar ratio of 0.9![[thin space (1/6-em)]](https://www.rsc.org/images/entities/char_2009.gif) :
:![[thin space (1/6-em)]](https://www.rsc.org/images/entities/char_2009.gif) 1 is shown in Fig. S1a,† the presence of Pb, Cs, Cu and Cl elements were observed. The XPS spectrum of Cu:CsPbCl3 QDs with the Cu-to-Pb molar ratio of 0.9
1 is shown in Fig. S1a,† the presence of Pb, Cs, Cu and Cl elements were observed. The XPS spectrum of Cu:CsPbCl3 QDs with the Cu-to-Pb molar ratio of 0.9![[thin space (1/6-em)]](https://www.rsc.org/images/entities/char_2009.gif) :
:![[thin space (1/6-em)]](https://www.rsc.org/images/entities/char_2009.gif) 1 is shown in Fig. 4c, which exhibited XPS peaks of Cu 2p, Cs 3d, Pb 4f, Cl 2p, C 1s and O 1s. Furthermore, the high-resolution XPS spectra (Fig. 4d) reveal that the binding energy (BE) is 931.5 eV for Cu 2p3/2, and the BE peak at 937.5 eV is the characteristic Cu2+ shake-up satellite peak.41 In addition, the BE at 738.4 eV and 724.4 eV are for Cs 3d3/2 and Cs 3d5/2, 143.1 eV and 138.2 eV for Pb 4f5/2 and Pb 4f7/2, 199.4 eV and 197.8 eV for Cl 2p1/2 and Cl 2p3/2, respectively, as shown in Fig. S1b–d.† These results suggest that Cu2+ was successfully doped into CsPbCl3 QDs.
1 is shown in Fig. 4c, which exhibited XPS peaks of Cu 2p, Cs 3d, Pb 4f, Cl 2p, C 1s and O 1s. Furthermore, the high-resolution XPS spectra (Fig. 4d) reveal that the binding energy (BE) is 931.5 eV for Cu 2p3/2, and the BE peak at 937.5 eV is the characteristic Cu2+ shake-up satellite peak.41 In addition, the BE at 738.4 eV and 724.4 eV are for Cs 3d3/2 and Cs 3d5/2, 143.1 eV and 138.2 eV for Pb 4f5/2 and Pb 4f7/2, 199.4 eV and 197.8 eV for Cl 2p1/2 and Cl 2p3/2, respectively, as shown in Fig. S1b–d.† These results suggest that Cu2+ was successfully doped into CsPbCl3 QDs.
3.4 The PL and UV-Vis absorption spectra of Cu:CsPbCl3 QDs
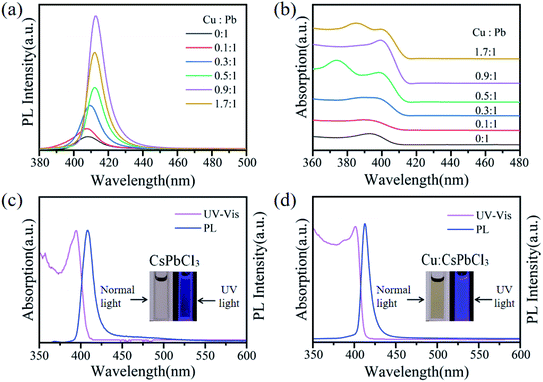
Fig. 5a depicts the PL spectra of Cu2+-doped CsPbCl3 QDs with different Cu-to-Pb molar ratios. It is observed that as the Cu2+ ion concentration increased, the PL intensity of Cu2+-doped CsPbCl3 QDs also increased and then gradually decreased. Their emission peaks display a redshift from 408 nm to 412 nm. When the Cu-to-Pb molar ratio reached 1.7![[thin space (1/6-em)]](https://www.rsc.org/images/entities/char_2009.gif) :
:![[thin space (1/6-em)]](https://www.rsc.org/images/entities/char_2009.gif) 1, the PL intensity of Cu:CsPbCl3 QDs weakened. This indicates that excessive doping of Cu2+ ions form a non-radiative relaxation channel in CsPbCl3 QDs leads to the decrease in the PL intensity. It can be observed from the Urbach tails in the UV-Vis absorption spectra shown in Fig. 5b that the absorption edge of doped Cu2+ ions was steeper than that of undoped QDs, which confirmed that the system was disordered or the defects were reduced.42,43 This is consistent with the enhancement of the PL intensity of excitonic emission. In the case mentioned above, the redshifts of the PL and absorption spectra of Cu2+-doped CsPbCl3 QDs are caused by the recombination of electrons in the conduction band of the host material and holes in the Cu2+ T2 state.34,44,45 These results confirmed that doping Cu2+ with an ionic radius of 73 pm forms Cu–Cl ion pairs to fill the Pb–Cl ion vacancies, effectively eliminating the non-radiative recombination of excitons, which enhanced the PL intensity of CsPbCl3 QDs.
1, the PL intensity of Cu:CsPbCl3 QDs weakened. This indicates that excessive doping of Cu2+ ions form a non-radiative relaxation channel in CsPbCl3 QDs leads to the decrease in the PL intensity. It can be observed from the Urbach tails in the UV-Vis absorption spectra shown in Fig. 5b that the absorption edge of doped Cu2+ ions was steeper than that of undoped QDs, which confirmed that the system was disordered or the defects were reduced.42,43 This is consistent with the enhancement of the PL intensity of excitonic emission. In the case mentioned above, the redshifts of the PL and absorption spectra of Cu2+-doped CsPbCl3 QDs are caused by the recombination of electrons in the conduction band of the host material and holes in the Cu2+ T2 state.34,44,45 These results confirmed that doping Cu2+ with an ionic radius of 73 pm forms Cu–Cl ion pairs to fill the Pb–Cl ion vacancies, effectively eliminating the non-radiative recombination of excitons, which enhanced the PL intensity of CsPbCl3 QDs.
Fig. 5c and d show the UV absorption and PL spectra of undoped and Cu2+-doped CsPbCl3 QDs with the Cu-to-Pb molar ratio of 0.9![[thin space (1/6-em)]](https://www.rsc.org/images/entities/char_2009.gif) :
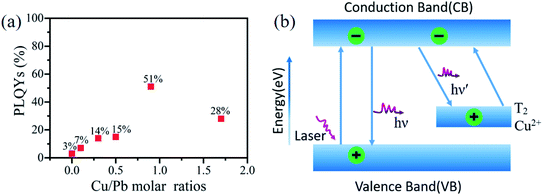
:![[thin space (1/6-em)]](https://www.rsc.org/images/entities/char_2009.gif) 1, respectively. As shown in the both figures, the full width at half maxima (FWHM) of the PL spectra of Cu2+-doped was narrower (12 nm) than that of the undoped CsPbCl3 QDs (16 nm), which illustrated that the size distribution of the PQD nanoparticles and homogeneity of the morphology were improved. From the photographs of these solutions under 365 nm excitation, the blue-violet light emitted by Cu2+-doped under the excitation of the laser was obviously brighter than the undoped CsPbCl3 QDs. Fig. 6a shows the PLQYs of Cu2+-doped CsPbCl3 QDs with numerous molar ratios of Cu-to-Pb (0
1, respectively. As shown in the both figures, the full width at half maxima (FWHM) of the PL spectra of Cu2+-doped was narrower (12 nm) than that of the undoped CsPbCl3 QDs (16 nm), which illustrated that the size distribution of the PQD nanoparticles and homogeneity of the morphology were improved. From the photographs of these solutions under 365 nm excitation, the blue-violet light emitted by Cu2+-doped under the excitation of the laser was obviously brighter than the undoped CsPbCl3 QDs. Fig. 6a shows the PLQYs of Cu2+-doped CsPbCl3 QDs with numerous molar ratios of Cu-to-Pb (0![[thin space (1/6-em)]](https://www.rsc.org/images/entities/char_2009.gif) :
:![[thin space (1/6-em)]](https://www.rsc.org/images/entities/char_2009.gif) 1, 0.1
1, 0.1![[thin space (1/6-em)]](https://www.rsc.org/images/entities/char_2009.gif) :
:![[thin space (1/6-em)]](https://www.rsc.org/images/entities/char_2009.gif) 1, 0.3
1, 0.3![[thin space (1/6-em)]](https://www.rsc.org/images/entities/char_2009.gif) :
:![[thin space (1/6-em)]](https://www.rsc.org/images/entities/char_2009.gif) 1, 0.5
1, 0.5![[thin space (1/6-em)]](https://www.rsc.org/images/entities/char_2009.gif) :
:![[thin space (1/6-em)]](https://www.rsc.org/images/entities/char_2009.gif) 1, 0.9
1, 0.9![[thin space (1/6-em)]](https://www.rsc.org/images/entities/char_2009.gif) :
:![[thin space (1/6-em)]](https://www.rsc.org/images/entities/char_2009.gif) 1 and 1.7
1 and 1.7![[thin space (1/6-em)]](https://www.rsc.org/images/entities/char_2009.gif) :
:![[thin space (1/6-em)]](https://www.rsc.org/images/entities/char_2009.gif) 1), increasing from 3% to 51%.
1), increasing from 3% to 51%.
3.5 The mechanism model of enhanced PL
According to the above-mentioned results, the mechanism model of enhanced PL of Cu:CsPbCl3 QDs is shown in Fig. 6b. Under the excitation of 365 nm laser, the CsPbCl3 QD host absorbs energy and emits a 408 nm blue-violet light via the radiative recombination of excitons between the valence band (VB) and the conduction band (CB). Due to the presence of defect trap states, the non-radiative recombination pathway of excitons leads to energy loss. Hence, Cu2+ is introduced to recombine the excitons with a new radiation pathway. A part of the electrons in the conduction band of the CsPbCl3 host are transferred to the Cu2+ T2 state and recombined with the holes in this energy state, forming a new excitonic recombination pathway.46,47 It leads to the red-shift in the PL emission peak. Furthermore, the Cu2+ T2 states absorb energy and then pump the electrons to transition to the conduction band of the host. The energy transfer of the photoinduced excitons from the CsPbCl3 QD host to the Cu2+ T2 state, which promotes the recombination of excitons via the radiative pathway, reduces energy loss, and enhances the PL intensity.3.6 FTIR analysis
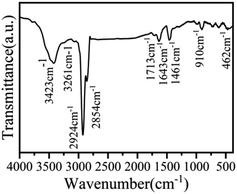
Chemical components of Cu:CsPbCl3 QDs were also analyzed. Some chemical elements can be observed in the FTIR spectrum, as shown in Fig. 7. The peaks at 3423 cm−1 and 1713 cm−1 are the stretching vibration peaks of the O–H and C![[double bond, length as m-dash]](https://www.rsc.org/images/entities/char_e001.gif) O bonds, which confirm that the ligand shell of PQDs contains oleic acid molecules. The peaks at 2924 cm−1 and 2854 cm−1 and 910 cm−1 are the vibration peaks of the olefin C–H bond. A weak stretching vibration peak of the N–H bond was observed at 3261 cm−1, which illustrates that the ligand shell of PQDs contains oleylamine molecules. The peak at 1643 cm−1 is the stretching vibration peak of the C
O bonds, which confirm that the ligand shell of PQDs contains oleic acid molecules. The peaks at 2924 cm−1 and 2854 cm−1 and 910 cm−1 are the vibration peaks of the olefin C–H bond. A weak stretching vibration peak of the N–H bond was observed at 3261 cm−1, which illustrates that the ligand shell of PQDs contains oleylamine molecules. The peak at 1643 cm−1 is the stretching vibration peak of the C![[double bond, length as m-dash]](https://www.rsc.org/images/entities/char_e001.gif) C bond, while the peak at 462 cm−1 is the vibration peak of the Pb–O bond, which is due to the carboxyl combines with the Pb2+ ions. These results show that Cu:CsPbCl3 QDs are packaged by OA and OLA, which can combine with other materials via adsorption or chemical bonds.48–50 This is significant for the preparation of highly conductive quantum dot films for photovoltaics and LED applications. In addition, the peak at 1461 cm−1 is the bending vibrations of the alkane C–H bond, which is because Cu:CsPbCl3 QDs were dispersed in n-hexane.
C bond, while the peak at 462 cm−1 is the vibration peak of the Pb–O bond, which is due to the carboxyl combines with the Pb2+ ions. These results show that Cu:CsPbCl3 QDs are packaged by OA and OLA, which can combine with other materials via adsorption or chemical bonds.48–50 This is significant for the preparation of highly conductive quantum dot films for photovoltaics and LED applications. In addition, the peak at 1461 cm−1 is the bending vibrations of the alkane C–H bond, which is because Cu:CsPbCl3 QDs were dispersed in n-hexane.
3.7 Photostability
We further explored the photostability of Cu:CsPbCl3 QDs, and the PL spectra of the sample with a Cu-to-Pb molar ratio of 0.9![[thin space (1/6-em)]](https://www.rsc.org/images/entities/char_2009.gif) :
:![[thin space (1/6-em)]](https://www.rsc.org/images/entities/char_2009.gif) 1 were measured for two consecutive weeks. In Fig. 8a, the Cu:CsPbCl3 QD PL emission slightly redshifted by 2 nm with the increase in time (days). Also, the fitting curve of the PL intensity over time is shown in Fig. 8b. It can be seen that the PL intensity increases over time and still remains relatively stable, which proved that the Cu2+-doped CsPbCl3 QDs have a good photostability.
1 were measured for two consecutive weeks. In Fig. 8a, the Cu:CsPbCl3 QD PL emission slightly redshifted by 2 nm with the increase in time (days). Also, the fitting curve of the PL intensity over time is shown in Fig. 8b. It can be seen that the PL intensity increases over time and still remains relatively stable, which proved that the Cu2+-doped CsPbCl3 QDs have a good photostability.
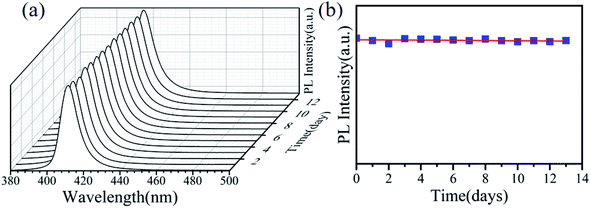 | ||
Fig. 8 PL spectra of Cu:CsPbCl3 QDs with the Cu-to-Pb molar ratio of 0.9![[thin space (1/6-em)]](https://www.rsc.org/images/entities/char_2009.gif) : :![[thin space (1/6-em)]](https://www.rsc.org/images/entities/char_2009.gif) 1 over time (days): (a) the PL spectra and (b) fitting of the PL intensity. 1 over time (days): (a) the PL spectra and (b) fitting of the PL intensity. | ||
4 Conclusions
In summary, we have successfully synthesized CsPbX3 and Cu2+-doped CsPbCl3 QDs via a the solvent-based thermal synthesis method. The results clearly show that the PL intensity of blue-violet light-emitting CsPbX3 QDs was much lower than that of green and red light-emitting. With the increase in the concentration of Cl− ions, the number of surface defects of CsPb(Cl/Br)3 QDs increased, which facilitated the non-radiative recombination of excitons and weakened the PL intensity of QDs. Cu2+-doped facilitated the exciton recombination via a radiative pathway that effectively enhanced the PLQYs of CsPbCl3 QDs from 3% to 51%, while maintaining the cubic crystal structure surface morphology. Moreover, the full width at half maxima of the PL spectra of Cu2+-doped CsPbCl3 QDs was narrower than that of the undoped CsPbCl3 QDs, which further proved that Cu2+-doped improves the crystallinity of CsPbCl3 QDs and reduces surface defects. We further tested the photostability of Cu:CsPbCl3 QDs. The sample QDs showed relatively stable PL intensity for two consecutive weeks. These results show that Cu:CsPbCl3 QDs can be widely used in the field of optoelectronic devices.Conflicts of interest
The authors have declared that no conflicting interests exist.Acknowledgements
This works were supported by National Natural Science Foundation of China (NSFC) (61865002 and 62065002); Project of outstanding young scientific and technological talents of Guizhou Province (QKEPTRC[2019]5650); Guizhou Province Science and Technology Project (QKHZ [2017]2887); Central Government of China Guiding Local Science and Technology Development Plan (QKZYD[2017]4004).References
- Y. Wei, X. R. Deng, Z. X. Xie, X. C. Cai, S. S. Liang, P. Ma, Z. Y. Hou, Z. Y. Cheng and J. Lin, Adv. Funct. Mater., 2017, 27(39), 1703535 CrossRef.
- J. Pan, S. P. Sarmah, B. Murali, I. Dursun, W. Peng, M. R. Parida, J. Liu, L. Sinatra, N. Alyami, C. Zhao, E. Alarousu, T. K. Ng, B. S. Ooi, O. M. Bakr and O. F. Mohammed, J. Phys. Chem. Lett., 2015, 6(24), 5027–5033 CrossRef CAS.
- N. S. Makarov, S. Guo, O. Isaienko, W. Liu, I. Robel and V. I. Klimov, Nano Lett., 2016, 16, 2349–2362 CrossRef CAS.
- C. C. Lin, K. Y. Xu, D. Wang and A. Meijerink, Sci. Rep., 2017, 7(1), 45906 CrossRef CAS.
- H. Wang, N. Sui, X. Bai, Y. Zhang, Q. Rice, F. J. Seo, Q. B. Zhang, V. L. Colvin and W. W. Yu, J. Phys. Chem. Lett., 2018, 9(15), 4166–4173 CrossRef CAS.
- L. Protesescu, S. Yakunin, M. I. Bodnarchuk, F. Krieg, R. Caputo, C. H. Hendon, R. X. Yang, A. Walsh and M. V. Kovalenko, Nano Lett., 2015, 15(6), 3692–3696 CrossRef CAS.
- M. Shekhirev, J. Goza, J. D. Teeter, A. Lipatov and A. Sinitskii, J. Chem. Educ., 2017, 94(8), 1150–1156 CrossRef CAS.
- S. S. Mali and C. K. Hong, Nanoscale, 2016, 8, 10528–10540 RSC.
- D. L. Zhou, D. L. Liu, G. C. Pan, X. Chen, D. Y. Li, W. Xu, X. Bai and H. W. Song, Adv. Mater., 2017, 29, 1704149 CrossRef.
- U. Rau, Phys. Rev. B: Condens. Matter Mater. Phys., 2007, 76(8), 85303 CrossRef.
- Y. Li, Z. W. Wang, D. Ren, Y. H. Liu, A. B. Zheng, S. M. Zakeeruddin, X. D. Dong, A. Hagfeldt, M. Gratzel and P. Wang, ACS Appl. Energy Mater., 2019, 2(5), 3822–3829 CrossRef CAS.
- W. Ahmad, J. Khan, G. Niu and J. Tang, Sol. RRL, 2017, 1(7), 1700048 CrossRef.
- E. Bi, H. Chen, F. Xie, Y. Wu, W. Chen, Y. Su, A. Islam, M. GraTzel, X. Yang and L. Han, Nat. Commun., 2017, 8(1), 15330 CrossRef CAS.
- J. Wang, J. Zhang, Y. Zhou, H. Liu and A. K. Y. Jen, Nat. Commun., 2020, 11(1), 177 CrossRef CAS.
- E. M. Sanehira, A. R. Marshall, J. A. Christians, S. P. Harvey and J. M. Luther, Sci. Adv., 2017, 3(10), eaao4204 CrossRef.
- A. Swarnkar, A. R. Marshall, E. M. Sanehira, B. D. Chernomordik and D. T. Moore, Science, 2016, 354(6308), 92–95 CrossRef CAS.
- J. Z. Song, J. H. Li, X. Ming, L. M. Xu, Y. H. Dong and H. B. Zeng, Adv. Mater., 2015, 27(44), 7162–7167 CrossRef CAS.
- X. X. Di, Z. Hu, J. T. Jiang, M. L. He, L. Zhou, W. D. Xiang and X. J. Liang, Chem. Commun., 2017, 53(80), 11068–11071 RSC.
- T. Matsushima, F. Bencheikh, T. Komino, M. R. Leyden, A. S. D. Sandanayaka, C. Qin and C. Adachi, Nature, 2019, 572, 502–506 CrossRef CAS.
- K. Sim, T. Jun, J. Bang, H. Kamioka and H. Hosono, Appl. Phys. Rev., 2019, 6(3), 031402 Search PubMed.
- K. B. Lin, J. Xing and L. N. Quan, et al., Nature, 2018, 562(7726), 245–248 CrossRef CAS.
- X. J. Huang, Q. Y. Guo, D. D. Yang, X. D. Xiao and G. P. Dong, et al., Nat. Photonics, 2020, 14(2), 82–88 CrossRef CAS.
- J. Chen, Y. Wu, X. M. Li, F. Cao, Y. Gu, K. Liu, X. H. Liu, Y. H. Dong, J. P. Ji and H. B. Zeng, Adv. Mater. Technol., 2017, 2(10), 1700132 CrossRef.
- C. Y. Huang, C. Zou, C. Y. Mao, K. L. Corp, Y. C. Yao, Y. J. Lee, C. W. Schlenker, K. Y. Jen and L. Y. Lin, ACS Photonics, 2017, 4(9), 2281–2289 CrossRef CAS.
- J. Z. Li, H. X. Dong, B. Xu, S. F. Zhang, Z. P. Cai, J. Wang and L. Zhang, Photonics Res., 2017, 5(5), 457–460 CrossRef CAS.
- X. S. Tang, Z. P. Hu, W. W. Chen, X. Xing and L. Q. Mai, et al., Nano Energy, 2016, 28, 462–468 CrossRef CAS.
- Y. Wang, X. M. Li, J. Z. Song, L. Xiao, H. B. Zeng and H. D. Sun, Adv. Mater., 2015, 27(44), 7101–7108 CrossRef CAS.
- G. Nedelcu, L. Protesescu, S. Yakunin, M. I. Bodnarchuk, M. J. Grotevent and M. V. Kovalenko, Nano Lett., 2015, 15(8), 5635–5640 CrossRef CAS.
- H. Chung, S. I. Jung, H. J. Kim, W. Cha, E. Sim, D. Kim, W. K. Koh and J. Kim, Angew. Chem., Int. Ed. Engl., 2017, 56(15), 4160 CrossRef CAS.
- D. Q. Chen, G. L. Fang and X. Chen, ACS Appl. Mater. Interfaces, 2017, 9(46), 40477–40487 CrossRef CAS.
- W. J. Mir, Y. Mahor, A. Lohar, M. Jagadeeswararao, S. Das, S. Mahamuni and A. Nag, Chem. Mater., 2018, 30(20), 8170–8178 CrossRef CAS.
- H. W. Liu, Z. N. Wu, J. R. Shao, D. Yao, H. Gao, Y. Liu, W. L. Yu, H. Zhang and B. Yang, ACS Nano, 2017, 11(2), 2239–2247 CrossRef CAS.
- D. Parobek, B. J. Roman, Y. T. Dong, H. Jin, E. Lee, M. Sheldon and D. H. Son, Nano Lett., 2016, 16(12), 7376–7380 CrossRef CAS.
- B. B. Srivastava, S. Jana and N. Pradhan, J. Am. Chem. Soc., 2011, 133(4), 1007–1015 CrossRef CAS.
- X. Yuan, J. Hua, R. S. Zeng, D. H. Zhu, W. Y. Ji, P. T. Jing, X. D. Meng, J. L. Zhao and H. B. Li, Nanotechnology, 2014, 25(43), 435202 CrossRef.
- J. W. Stouwdam and R. A. J. Janssen, Adv. Mater., 2009, 21(28), 2916–2920 CrossRef CAS.
- B. Babu, A. N. Kadam, R. V. S. S. N. Ravikumar and C. Byon, J. Alloys Compd., 2017, 703, 330–336 CrossRef CAS.
- C. H. Bi, S. X. Wang, Q. Li, S. V. Kershaw, J. J. Tian and A. L. Rogach, J. Phys. Chem. Lett., 2019, 10(5), 943–952 CrossRef CAS.
- G. H. Ahmed, J. K. El-Demellawi, Y. Jun, P. Jun, V. D. Velusamy, M. N. Hedhili, E. Alarousu, O. M. Bakr, H. N. Alshareef and O. F. Mohammed, ACS Energy Lett., 2018, 3(10), 2301–2307 CrossRef CAS.
- Q. A. Akkerman, S. G. Motti, A. R. S. Kandada, E. Mosconi, V. D'Innocenzo, G. Bertoni, S. Marras, B. A. Kamino, L. Miranda, F. De Angelis, A. Petrozza, M. Prato and L. Manna, J. Am. Chem. Soc., 2016, 138(3), 1010–1016 CrossRef CAS.
- P. Liu and E. J. M. Hensen, J. Am. Chem. Soc., 2013, 135(38), 14032–14035 CrossRef CAS.
- P. Guyot-Sionnest, E. Lhuillier and H. Liu, J. Chem. Phys., 2012, 137(15), 154704 CrossRef.
- J. Pal, A. Bhunia, S. Chakraborty, S. Manna, S. Das, A. Diwan, S. Datta and A. Nag, J. Phys. Chem. C, 2018, 22(19), 10643–10649 CrossRef.
- S. Cao, W. Y. Ji, J. L. Zhao, W. Y. Yang, C. M. Li and J. J. Zheng, J. Mater. Chem. C, 2016, 4(3), 581–588 RSC.
- W. J. Zhang, Q. Lou, W. Y. Ji, J. L. Zhao and X. H. Zhong, Chem. Mater., 2014, 26(2), 1204–1212 CrossRef CAS.
- G. K. Grandhi and R. Viswanatha, J. Phys. Chem. Lett., 2013, 4(3), 409–415 CrossRef CAS.
- A. M. Jawaid, S. Chattopadhyay, D. J. Wink, L. E. Page and P. T. Snee, ACS Nano, 2013, 7(4), 3190–3197 CrossRef CAS.
- Z. C. Bai, J. Zhou, M. Peng, Z. P. Zhang and S. J. Qin, J. Opt. Soc. Am. B, 2019, 36(6), 1420–1428 CrossRef CAS.
- Z. L. Liu, C. Chang, W. J. Zhang, M. Yang and Q. Zhang, IOP Conf. Ser.: Mater. Sci. Eng., 2019, 562, 012067 CrossRef CAS.
- B. Fritzinger, R. K. Capek, K. Lambert, J. C. Martins and Z. Hens, J. Am. Chem. Soc., 2010, 132(29), 10195–10201 CrossRef CAS.
Footnote |
| † Electronic supplementary information (ESI) available. See DOI: 10.1039/d0ra09043c |
| This journal is © The Royal Society of Chemistry 2021 |

