
 Open Access Article
 This Open Access Article is licensed under a Creative Commons Attribution-Non Commercial 3.0 Unported Licence
UIO-66-NH2-derived mesoporous carbon used as a high-performance anode for the potassium-ion battery†
Yanchen Liu,
Bin Huang,
Long Zheng,
Muyuan Shen,
Zonghua Pu,
Yijia Shao,
Xiuhua Li and
Shijun Liao *
*
The Key Laboratory of Fuel Cell Technology of Guangdong Province, The Key Laboratory of New Energy, School of Chemistry and Chemical Engineering, South China University of Technology, Guangzhou 510641, China. E-mail: chsjliao@scut.edu.cn
First published on 4th January 2021
Abstract
As potassium is abundant and has an electronic potential similar to lithium's, potassium-ion batteries (KIBs) are considered as prospective alternatives to lithium-ion batteries (LIBs). However, the much larger radius of the K ion poses challenges for the potassiation and depotassiation processes when the typical graphite-based anode is used, resulting in poor electrochemical performance. Thus, there is an urgent need to develop novel anode materials that are suitable for K ions. Herein, we develop a porous carbon material with high surface area derived from UIO-66-NH2 metal–organic frameworks as an anode material instead of a graphite-based anode. The material is prepared using a double-solvent diffusion-pyrolysis method, which increased mesopore volume and average pore size, and to a certain extent, slightly improved the nitrogen content of the production. The material exhibits a high capacity as well as excellent rate performance and cycling stability. A potassium battery with our porous carbon as the anode delivers a high reversible capacity of 346 mA h g−1 at 100 mA g−1 (compared to 279 mA h g−1 with a graphite-based anode), and 214 mA h g−1 at a discharge rate of up to 2 A g−1. After 800 cycles, the capacity is still 187 mA h g−1 at 0.1 A g−1. Qualitative and quantitative kinetics analyses demonstrated that the battery's high K storage performance was principally dominated by a surface-driven capacitive mechanism, and the potassiation and depotassiation processes may have occurred on the surface of the porous carbon instead of in the interlayer space, as is the case with a graphite anode. This work may provide a basis for developing other carbonaceous materials to use in KIBs.
1. Introduction
In recent years, due to the rapid development of portable electronic devices and electric vehicles,1 lithium-ion batteries (LIBs) have been the dominant power sources for these applications.2 However, lithium's scarcity (0.0017 wt%) and consequent rising cost mean that demand for its use in widespread, large-scale energy storage systems cannot be met.3 Thus, it is a priority to develop alternative metal-ion batteries composed of earth-abundant elements such as potassium, aluminum, sodium, and so on. Potassium-ion batteries (KIBs) that possess similar electrochemistry to LIBs are beginning to receive greater attention. First in the KIB's favor is that potassium is abundant in the Earth's crust (2.09 wt%) and evenly distributed, leading to lower production costs.4 Second, the lower Lewis acidity and smaller desolvation energy of the K ion guarantee faster ion diffusion kinetics.5 Third, as K/K+ has lower redox potential than Na/Na+ (−2.93 V vs. −2.71 V),6 KIBs can offer a higher working voltage and energy density.7 Collectively, these advantages make KIBs outstandingly promising alternatives to LIBs. However, the larger size of K+ (1.38 Å) compared with Li+ (0.76 Å) and Na+ (1.02 Å) poses challenges for the potassiation and depotassiation processes on a graphite-based anode, resulting in poor electrochemical performance. Tremendous effort has thus been devoted to exploring appropriate electrode materials with stable structures and excellent performance.8Currently, the low cost and environmental benignity of carbonaceous materials make them the first choice as potential anode materials for KIBs. A graphite anode in a KIB can generally give a capacity of 279 mA h g−1, resulting from the formation of a K-graphite intercalation compound at stage I.9 This limited specific capacity is far from satisfactory for commercial requirements. Worse still, graphite anode material with confined interlayer spacing also exhibited poor rate performance and cycling stability. Clearly, finding new anode materials for KIBs remains an urgent issue.10
To overcome the obstacles of using graphitic materials in KIBs, a few researchers have investigated the application of porous carbon materials with special structures and high surface area, and they have verified this to be an efficient strategy.11–13 Ci et al.14 synthesized hierarchically nitrogen-doped porous carbon via a facile self-template method and found that the highly developed pore structure resulted in a high reversible capacity that yielded an outstanding rate capability of 185 mA h g−1 at 10.0 A g−1. Feng et al.15 selected a metal–organic framework (MOF; MIL-125 (Ti)) as an electrode material for KIBs because of its high porosity and found it could deliver a capacity of 208 mA h g−1 at a current density of 10 mA g−1. A highly developed pore structure and high porosity are beneficial characteristics to facilitate ion/electron transport and alleviate volume expansion during the potassiation/depotassiation processes.
Nitrogen doping is another approach to enhance K storage performance, as it can regulate electronic structure and increase reactivity.16,17 Generally, both soft and hard templates can yield mesoporous carbon materials, but it is complicated to synthesize and remove the template. Thanks to their tunable pore metrics and controllable chemical compositions, MOFs are promising precursors for preparing porous carbon materials for energy storage. However, carbon directly derived from MOFs is usually microporous and thus unable to accommodate reversible K+ insertion/extraction, resulting in low performance in KIBs, especially poor rate capacity and cycle ability. Therefore, a mesoporous carbon material with a controllable pore structure is highly sought after to boost KIB performance.18
UIO-66-NH2 is a new type of MOFs material with larger pore size (0.8–1.1 nm) and higher surface area than typical MOFs, and its banded NH3 molecules are beneficial for nitrogen doping.19 Therefore, we prepared a N-doped porous carbon (N-PC) material using a double-solvent diffusion-pyrolysis method with UIO-66-NH2 adsorbed NH4Cl as the precursor. On the basis of UIO-66-NH2 directly derived carbon material, the N-PC obtained by the method of secondary nitridation used by NH4Cl. It not only inherited the regular nano-octahedral morphology from the UIO-66-NH2 precursor, but also increased mesoporosity and average pore size. As expected, the N-PC exhibited outstanding electrochemical reaction kinetics and electrochemical performance as the anode in KIBs. It delivered 346 mA h g−1 at a current density of 100 mA g−1, and at a high discharge rate of 500 mA g−1, its capacity still reached 308 mA h g−1. Even at a very high discharge rate of 2.0 A g−1, its capacity was 214 mA h g−1. After 500 cycles at a current density of 500 mA g−1, the capacity was 240 mA h g−1. We also studied the pseudocapacitance effect driven by the surface process, a valid method to enhance K storage ability, and the potassium ion diffusion kinetics.20
2. Experimental section
2.1 Materials synthesis
![[thin space (1/6-em)]](https://www.rsc.org/images/entities/char_2009.gif) :1) solvent) was added dropwise over a period of 30 min with constant vigorous stirring. The resulting suspension/solution system was continuously stirred for another 30 min so that the ammonium chloride could become well diffused in the UIO-66-NH2 channels. The solid settled to the bottom of the flask after stirring ceased. Then the sample, which we denote as N@UIO-66-NH2, was isolated from the supernatant by decanting and dried under vacuum at 80 °C for 12 h.
:1) solvent) was added dropwise over a period of 30 min with constant vigorous stirring. The resulting suspension/solution system was continuously stirred for another 30 min so that the ammonium chloride could become well diffused in the UIO-66-NH2 channels. The solid settled to the bottom of the flask after stirring ceased. Then the sample, which we denote as N@UIO-66-NH2, was isolated from the supernatant by decanting and dried under vacuum at 80 °C for 12 h.Pyrolysis of N@UIO-66-NH2 was performed at 800 °C in a temperature-programmed furnace under an Ar atmosphere. After the sample was cooled down to room temperature, it was immersed in 20 wt% HF for 24 h, washed with distilled water, and dried at 80 °C under vacuum overnight. Finally, the sample was heat-treated at 900 °C again under Ar flow for 1 h.
The comparative sample, PC, which was directly derived from UIO-66-NH2, was synthesized following the same procedures but without adding NH4Cl to the precursors.
2.2 Materials characterization
X-ray powder diffraction (XRD) of all the synthesized samples was performed on a TD-3500 powder diffractometer (Tongda, China) using Cu-Kα radiation (λ = 1.54178 Å) and operating at 30 kV and 20 mA. Scanning electron microscopy (SEM) was done with a Merlin field-emission SEM (Carl Zeiss). Transmission electron microscopy (TEM) and energy-dispersives spectroscopy (EDS) were performed with a JEM-2100 transmission electron microscope (JEOL, Japan). X-ray photoelectron spectroscopy (XPS) was conducted using a VG ESCALAB MK2 X-ray photoelectron spectrometer (VG Corporation, UK) with an Al-Kα X-ray source. Raman spectroscopy was done using a LabRAM Aramis Raman spectrometer (HJY, France). Brunauer–Emmett–Teller (BET) measurement was performed on a Tristar II 3020 gas adsorption analyzer (Micromeritics, USA).2.3 Electrochemical measurement
The KIBs used for evaluation were assembled in CR2032 coin cells, with K metal foil as the cathode (acting as the counter/reference electrode in the measurements), our prepared material coated on Cu foil as the anode, a glass microfiber filter (Whatman, Grade GF/D) as the separator, and a solution of 0.8 mol L−1 KPF6 in a mixture of ethylene carbonate (EC) and diethyl carbonate (DEC) (1:1 in volume) as the electrolyte. Cell assembly was completed in a pure Ar-filled glove box (Mikrouna, Germany).
The anode was prepared as follows. The as-prepared active material, acetylene black, and polyvinylidene fluoride (PVDF) were dispersed in N-methyl-2-pyrrolidone (NMP) in a weight ratio of 70:15:15, followed by ultra-sonication to obtain a uniform slurry, coating on Cu foil, and drying in a vacuum oven. The areal active material loading was 1 mg cm−2 for the tested electrodes.
Battery performance measurements were carried out on a Neware battery testing system (Shenzhen, China) at room temperature within the voltage range of 0.01–3 V (vs. K/K+). All cyclic voltammetry (CV) measurements and electrochemical impedance spectroscopy (EIS) were recorded on an Autolab PGSTAT302N electrochemical station.
3. Results and discussion
Fig. 1 schematically illustrates the synthesis procedure for N-PC. Worthwhile, to achieve higher storage capacity and faster K+ diffusion, it is vital to design a carbonaceous material with mesopores, heteroatom dopants, and high surface area. For this reason, we employed DSDPM to draw NH4Cl into the interior of the Zr-based MOF UIO-66-NH2 to synthesize mesoporous carbon. UIO-66-NH2 was obtained by coordinating Zr4+ and 2-aminoterephthalic acid.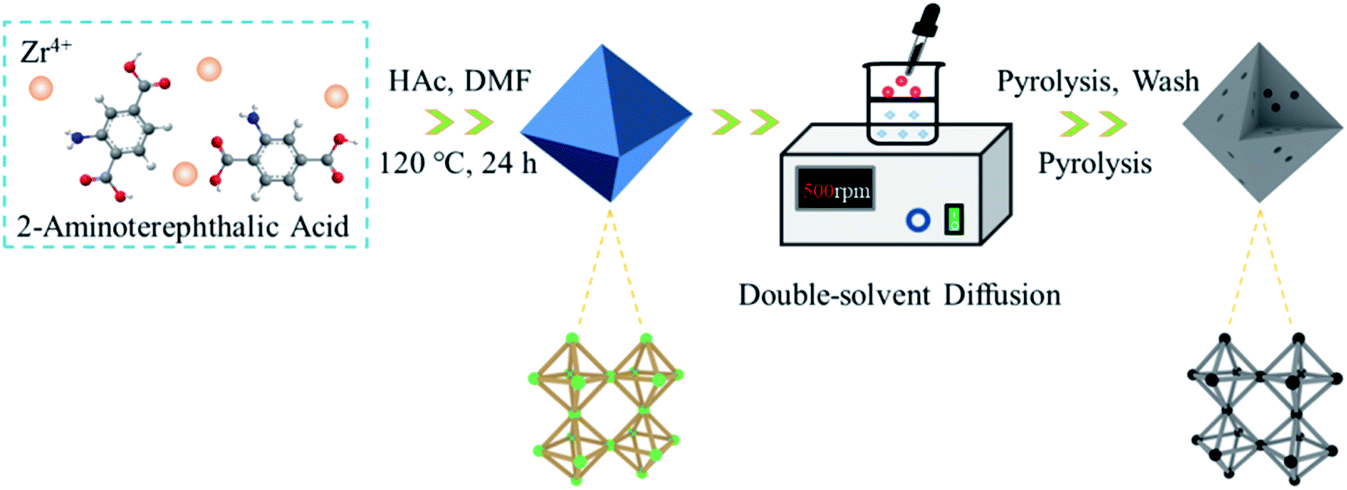 | ||
| Fig. 1 Schematic illustration of the synthesis process for N-PC. | ||
The SEM image of UIO-66-NH2 in Fig. 2a clearly shows its uniform particle size and smooth external surface. After double-solvent diffusion, the material's smooth nano-octahedral morphology was perfectly preserved, with no obvious observable changes (Fig. 2b). Fig. 2c shows an image of the porous carbon material after pyrolysis, HF corrosion, and secondary pyrolysis, in turn. Remarkably, the nano-octahedral morphology was well retained by the final prepared material, but because the transformation of the UIO-66-NH2 micropores to mesopores occurred during the pyrolysis process, the surface of the nano-octahedral particles became much rougher. Fig. 2d and S1 (ESI†) show the TEM image of the N-PC sample.
 | ||
| Fig. 2 SEM images of (a) UIO-66-NH2 and (b) N@UIO-66-NH2; (c) SEM image and (d) TEM image of N-PC; (e and f) TEM elemental mappings of N-PC. | ||
Energy-dispersive spectroscopy (EDS) mappings (Fig. 2e and f) were used to confirm the existence of elemental C, N, and O, and they clearly demonstrated a uniform distribution of all three over the entire octahedron. Nitrogen doping in the carbon skeleton efficiently altered its electronic structure and further improved the material's reactivity.23
Fig. 3a shows the XRD patterns of UIO-66-NH2 and N@UIO-66-NH2, which clearly reveal that the crystal structure of UIO-66-NH2 did not change after the introduction of NH4Cl. However, the strength of the peaks weakened.
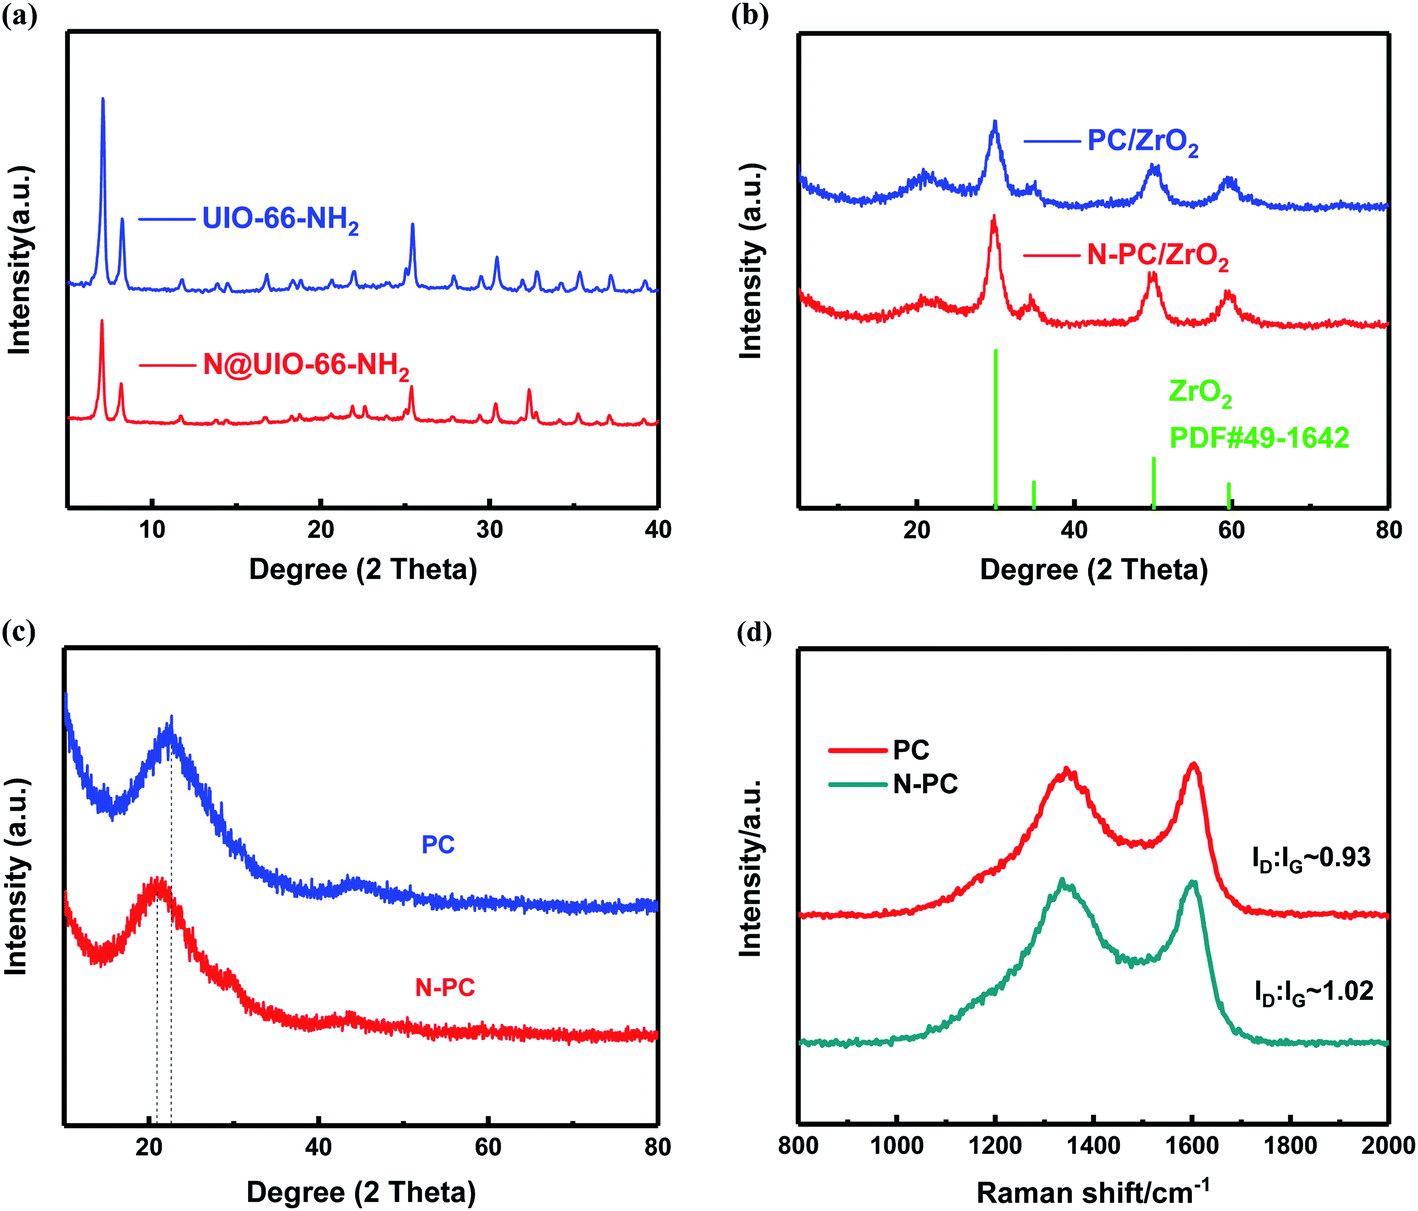 | ||
| Fig. 3 (a) XRD patterns of UIO-66-NH2 and N@UIO-66-NH2; (b) XRD patterns of PC/ZrO2 and N-PC/ZrO2 after the first pyrolysis without acid corrosion; (c) XRD patterns and (d) Raman spectra of PC and N-PC. | ||
After pyrolysis the peaks associated with UIO-66-NH2 disappeared, while the diffraction peaks of ZrO2 for the two samples emerged (Fig. 3b). Further, after being leached with HF solution and annealed again at 900 °C, all the peaks associated with ZrO2 disappeared, indicating that almost all of the zirconia oxide had dissolved in the hydrofluoric acid. As shown in Fig. 3c, two broad diffraction peaks near 22° and 43° were observed for the two final prepared materials, which were assigned to the (002) and (100) planes of carbon, respectively.24 It is worth noting that the diffraction peaks of N-PC were weaker than those of PC, and the (002) peak of N-PC shifted to 20.9°, suggesting that the interlayer spacing (d002) became larger with the addition of ammonium chloride.25 This larger interlayer distance turned out to be beneficial for the reversibility of potassiation/depotassiation and resulted in better performance.
To further investigate the structure of carbon, we employed Raman spectra. Two broad peaks appeared around 1341 cm−1 (D-band) and 1604 cm−1 (G-band), as can be observed in Fig. 3d, corresponding to the k-point phonons of the A1g symmetry of sp3-hybridized carbon and the E2g vibration of sp2-hybridized carbon, respectively.26 ID/IG, the intensity ratio of the D-band and G-band, was used to evaluate the carbon's defects and degree of disorder.27 It was obvious that the ID/IG ratio of N-PC (1.02) was higher than that of PC (0.93), revealing that N-PC had a higher degree of disorder and more defects than PC, which was in accordance with the XRD results.
XPS measurements were also performed to determine the surface elemental composition and chemical state of the prepared anode materials. The full survey spectra (Fig. 4a and b) proved that both of the samples contained C, N, and O, which was consistent with the observations from TEM elemental mapping. The N contents in both samples are 10.90 at% and 6.69 at%, respectively, the N content of N-PC is only a little bit higher than PC, however, N-PC possesses much high active N content than PC. Fig. 4c and d show the high resolution XPS spectra and their deconvolution results of PC and N-PC samples. Generally, the deconvolution peaks located at 398.01, 399.96, 401.05, and 402.66 eV can be signed to pyridinic-N, pyrrolic-N, graphitic-N, and oxidized-N, respectively,28 the integrated/calculated results of each peak’ fraction were presented in Fig. 4e, f and Table S2 (ESI†). Clearly, N-PC sample exhibited much lower inactive N fraction and much higher active N fraction than PC sample. The fraction of oxidized-N of PC is higher up to 21.37%, and only 10.32% for sample N-PC. It is important that the doping with ammonia chloride significantly increased the fraction of active pyridinic-N. It is widely recognized that pyridinic-N plays an important role in enhancing the electrochemical performance,29 due to its lone-pair electrons, which may have induced additional defects and generated more active sites. Pyridinic-N would adsorb more K+, leading to better reversibility. Further, pyridinic-N and graphitic-N are both regarded as having sp2 hybridization, which contributed to enhancing the electronic conductivity of the N-PC electrode, resulting in fast reaction kinetics.30
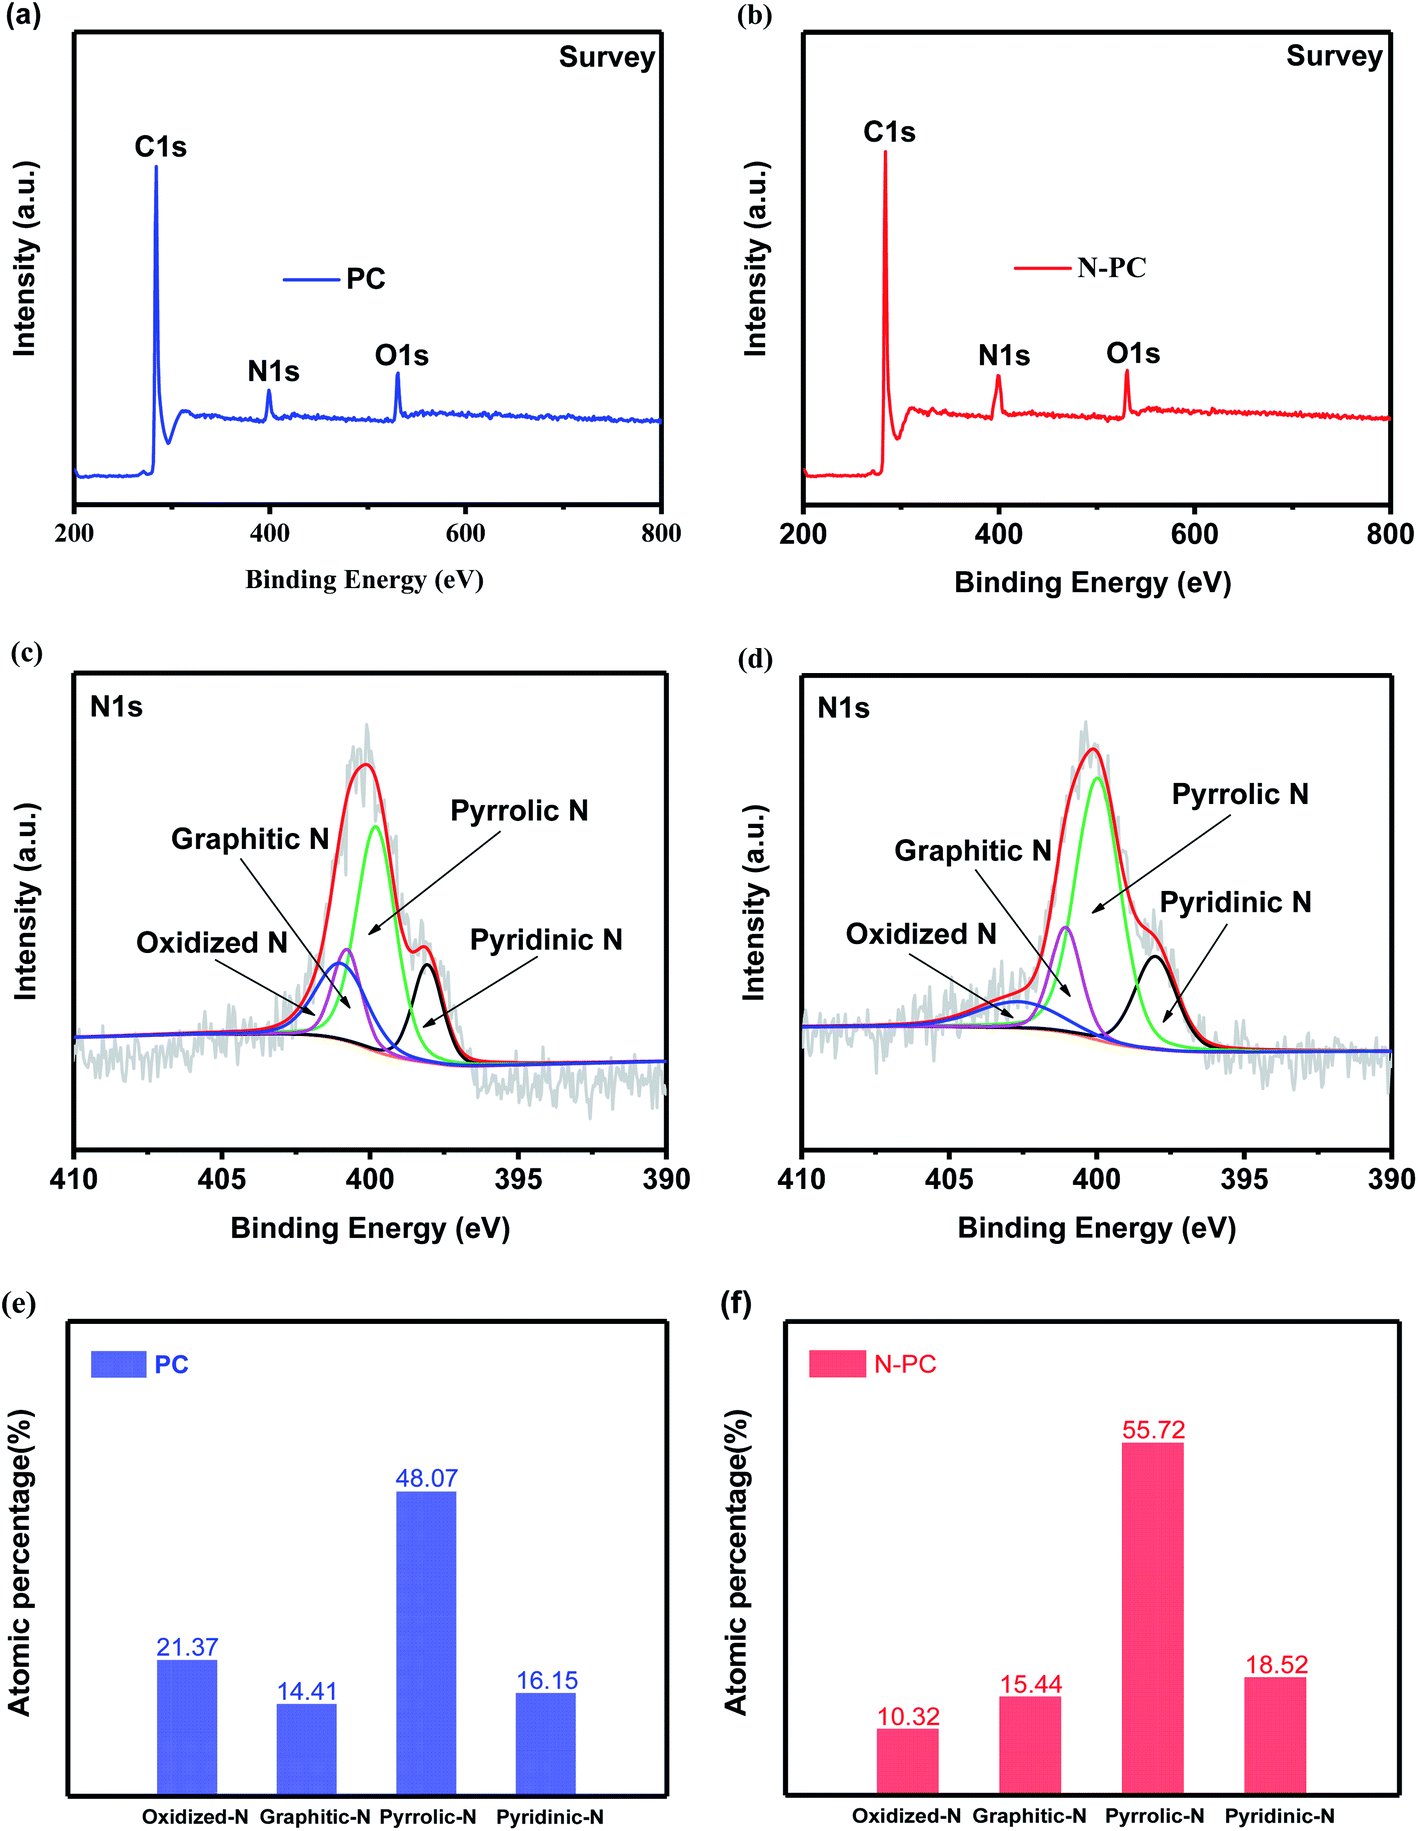 | ||
| Fig. 4 Survey XPS spectra of (a) PC and (b) N-PC; N 1s XPS spectra of (c) PC and (d) N-PC; distribution of various N species of (e) PC and (f) N-PC. | ||
Fig. 5a shows the nitrogen adsorption isotherms of UIO-66-NH2 and N@UIO-66-NH2. Both were typical type I isotherms; the former had a higher surface area (1109 m2 g−1) than the latter (627 m2 g−1) (Table S3†), implying that the ammonium chloride may have occupied the pores of UIO-66-NH2. Furthermore, the nitrogen adsorption–desorption curves of PC and N-PC are presented in Fig. 5b. N-PC exhibited a clear type-IV curve with a hysteresis loop, while the nitrogen sorption isotherm of PC was type I. It is exciting that the BET surface area of N-PC was as high as 1857 m2 g−1 with a pore volume of 1.732 cm3 g−1 (Fig. 5b, S2b and Table S4†), compared with 1694 m2 g−1 and 1.367 cm3 g−1 for the PC sample. Notably, micropores dominated in the PC material, whereas mesopores were dominant in the N-PC (Fig. S2a†). Obviously, the strategy of N-doping using DSDPM had tremendous effects on pore size and pore structure. In other words, tuning of the pore structure was realized by introducing ammonium chloride into the channels of the UIO-66-NH2. In view of this, we inferred that during the carbonization process, N@UIO-66-NH2 released a great deal of NH3 gas and HCl gas, which led to the bigger surface area, mesopore volume, and average pore size by etching organic ligands or the derived carbon of N@UIO-66-NH2. Furthermore, those unique pore structures would have facilitated electrolyte transport and accelerated ion diffusion in the potassiation/depotassiation process, thereby promoting K storage.
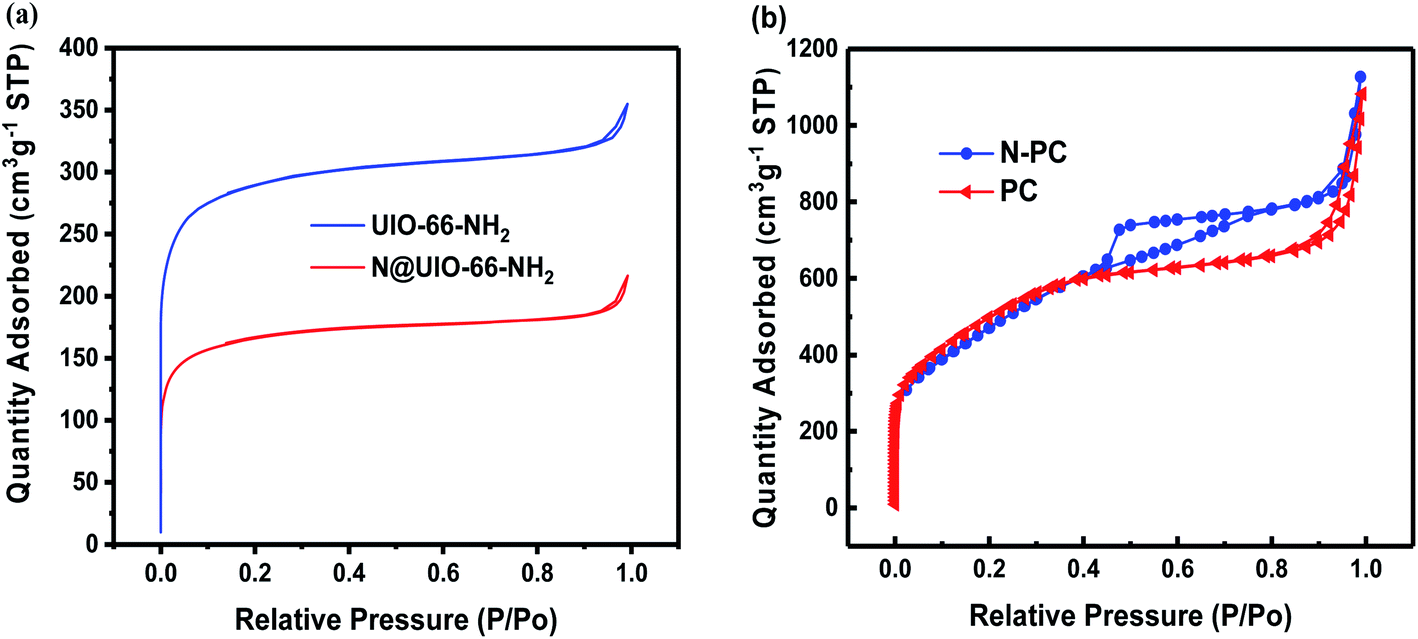 | ||
| Fig. 5 (a) N2 adsorption–desorption isotherms of UIO-66-NH2 and N@UIO-66-NH2; (b) N2 adsorption–desorption isotherms of PC and N-PC. | ||
We tested the electrochemical performance of PC and N-PC in KIBs. Fig. 6a displays the CV of N-PC for the first three cycles in a voltage window of 0.01–3.0 V (vs. K/K+). In the first cathodic scan, a peak near 0.55 V could be found, but it vanished in the following scans due to the decomposition of the electrolyte and the generation of a solid electrolyte interface (SEI) on the electrode surface.31 The sharp peak around 0.01 V was derived from the formation of KC8 (potassiation). Accordingly, during the anodic scan, the measured peak at nearly 0.26 V was assigned to the extraction of potassium ions from the N-PC anode (depotassiation).32 The CV curves were highly reversible and overlapped well in the subsequent scans, which revealed the excellent reversibility of the insertion/extraction of K+ into/from the N-PC anode.33 In addition, the overall shape of the CV curves exhibited typical characteristics of a double-layer capacitor, indicating a surface-driven process (capacitive effect).
 | ||
| Fig. 6 (a) CV curves of N-PC electrode at a scan rate of 0.1 mV s−1; (b) the comparison of N-PC with other carbon-based anode materials; (c) rate performance of two samples, with rates ranging from 0.2 to 1 A g−1; (d) cycling performance of N-PC and PC at 100 mA g−1; (e) cycling performance of N-PC at a current density of 500 mA g−1. | ||
The first three galvanostatic charge–discharge curves of the N-PC electrode at 100 mA g−1 are displayed in Fig. S4a (ESI†). The initial discharge capacity was up to 1753 mA h g−1, while the initial charge capacity was only 346 mA h g−1 at the end charging voltage of 3.0 V, resulting in a low coulombic efficiency of 19.7%. According to the literature, the highly irreversible capacity was mainly ascribable to the formation of SEI film in the first cathodic process, which was in accordance with the CV observations.34
As shown in Fig. 6c, N-PC exhibited much better rate performance than PC, delivering specific capacities of 324, 292, 272, 253, 246, and 214 mA h g−1 at 0.2, 0.4, 0.6, 0.8, 1, and 2 A g−1, respectively, almost 30% higher than those of PC at each rate. Moreover, the specific capacity at the end of the rate cycle was 286 mA h g−1, compared with 324 mA h g−1 at the start, indicating a capacity loss of only 11.7%, compared with 22.7% for PC. The charge–discharge curves at different rates are presented in Fig. S3a and b (ESI†). The linear characteristics of the charge–discharge curves became more remarkable as the charge–discharge rate increased, suggesting a surface-driven capacitance behavior.24
Fig. 6d presents the cycling performance of N-PC and PC at 100 mA g−1. N-PC exhibited a charge capacity of 346 mA h g−1 in the initial cycle, which was significantly higher than PC (265 mA h g−1). After 100 cycles, the reversible specific capacity of N-PC was 283 mA h g−1, a capacity retention of 82%, compared with only 161 mA h g−1 (60.7%) for PC. Furthermore, PC displayed unsteady coulombic efficiency, reflecting its irreversibility.
The excellent potassium storage performance of N-PC was further evidenced by cycling at high current densities. After 500 charge–discharge cycles at a current density of 500 mA g−1, N-PC still delivered a high specific capacity of 240 mA h g−1, with a superior coulombic efficiency of 98% (Fig. 6e). Even at 1 A g−1, N-PC retained a stable reversible capacity of 187 mA h g−1 after 800 cycles, a capacity decay of only 0.01% per cycle, and its coulombic efficiency was up to 100%, as can be observed from Fig. S3c (ESI†).
As clearly exhibited in Fig. 6b, the specific capacity of N-PC as anode for KIBs also was studied and compared with that of other reported carbon-based anode materials.
To further understand the electrochemical kinetics of the material, CV measurement was carried out at various scan rates ranging from 0.1 to 0.9 mV s−1 (Fig. 7a and b). As the scan rate increased, the CV curves changed regularly, and the anodic peak shifted toward a higher potential as a result of increased polarization at a higher scan rate. Using the equation i = avb, which presents the relationship between peak current (i) and scan rate (v), we can study the contribution ratio of the two reaction mechanisms: surface-driven capacitive process and diffusion-controlled process.35 Generally, a b-value of 0.5 means a completely diffusion-controlled process, whereas a value of 1 represents a totally surface-driven process.36 The b-value can be extracted from the slope of the log(v) − log(i) plots.37 In this work, the b-values were calculated to be 0.86 for PC and 0.79 for N-PC (Fig. 7c), suggesting that the surface-driven capacitive process had a dominant effect on potassium storage.
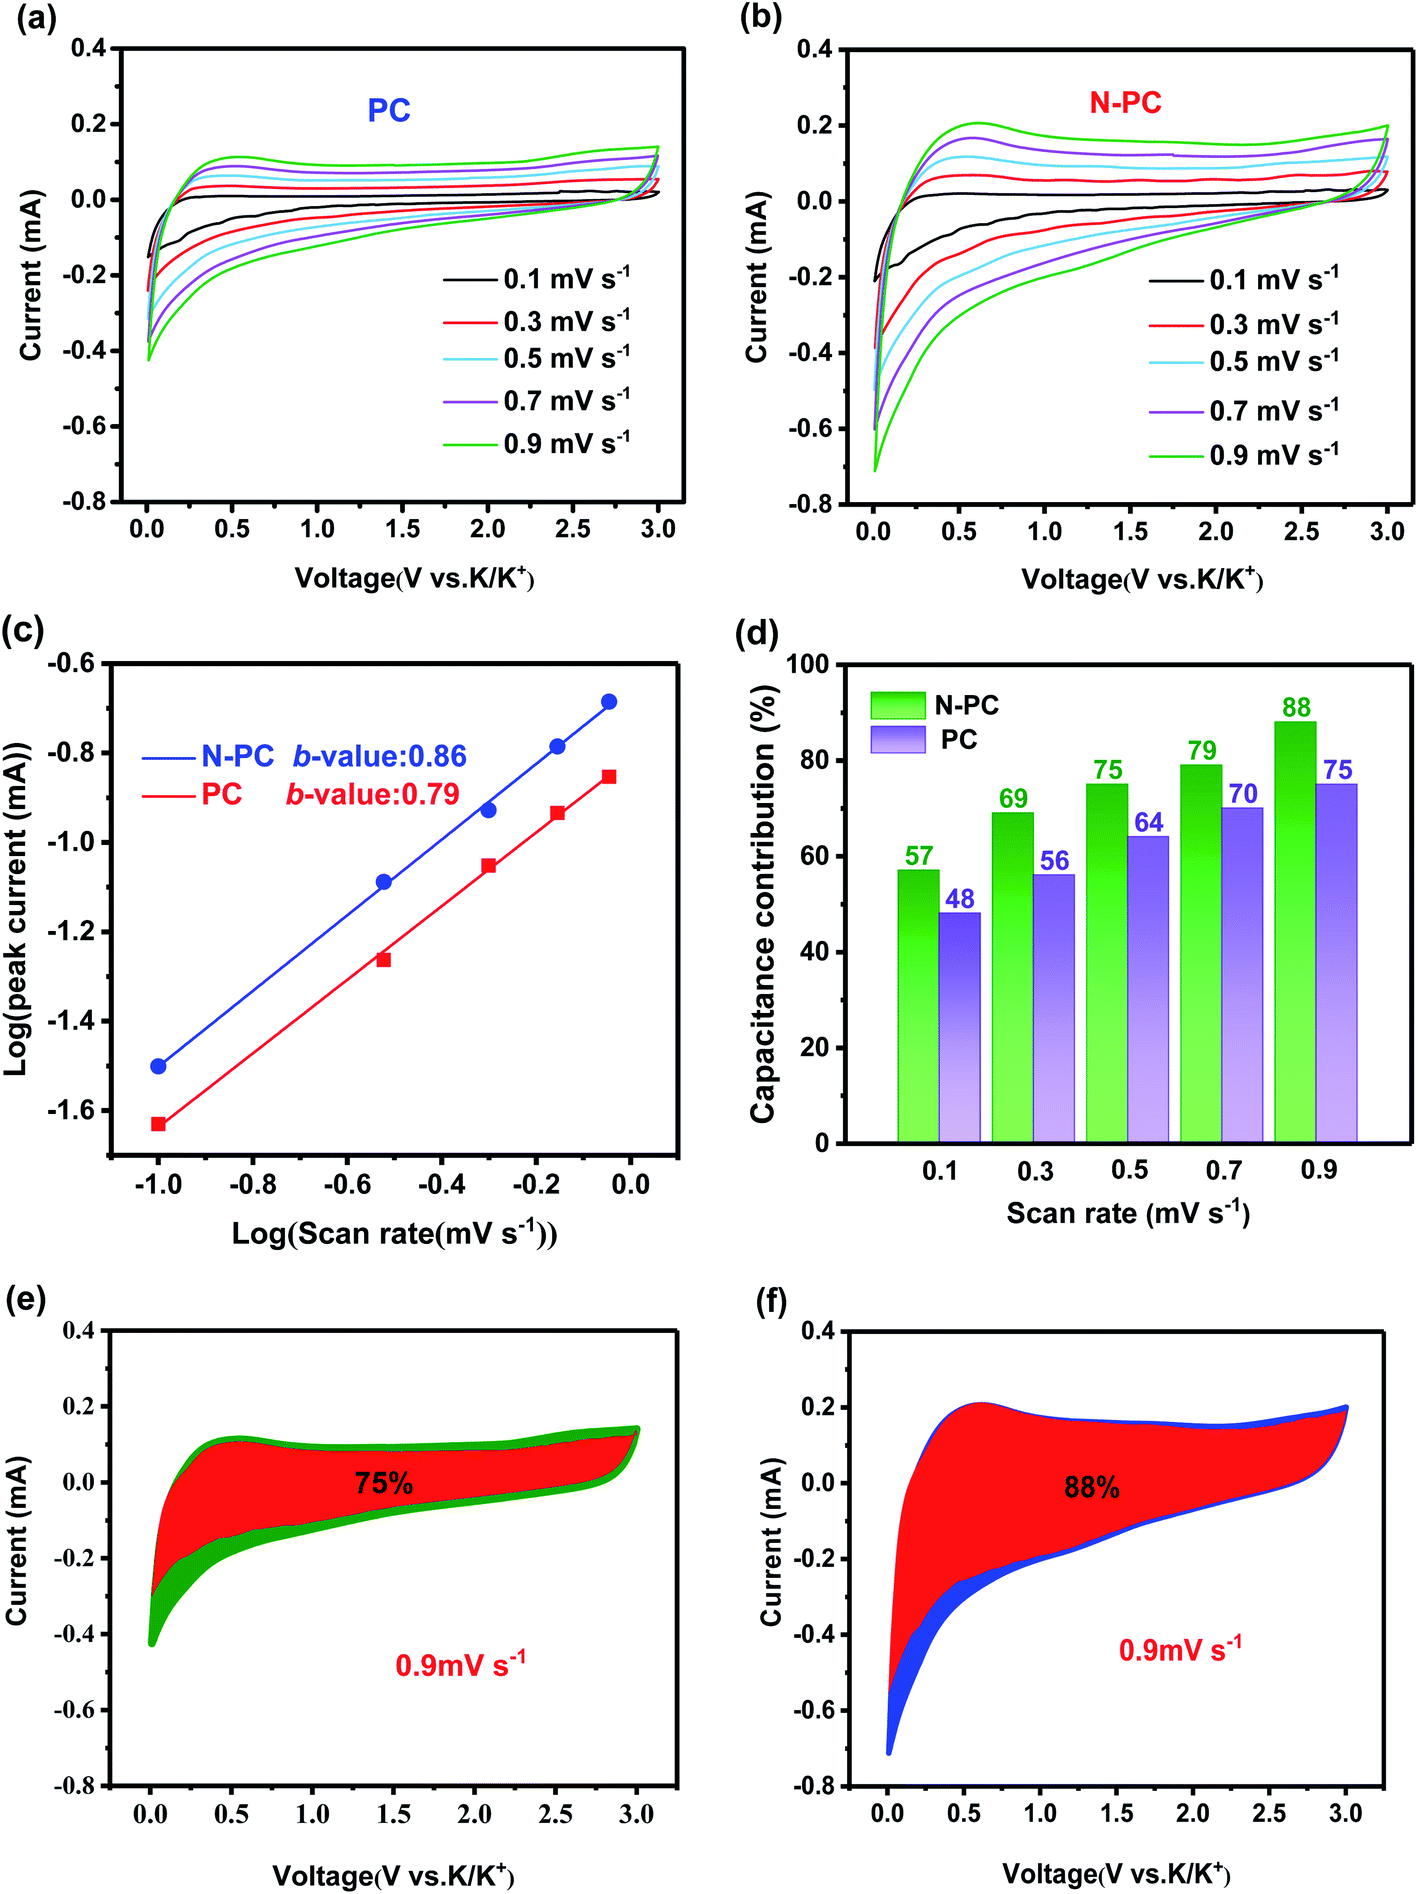 | ||
| Fig. 7 CV curves of (a) PC and (b) N-PC at various scan rates of 0.1 to 0.9 mV s−1; (c) b-values of PC and N-PC; (d) contribution of the capacitive and diffusion-controlled capacities at different scan rates; contribution of the surface process at a scan rate of 0.9 mV s−1 in (e) PC and (f) N-PC. | ||
The capacitive contribution could be further quantitatively separated using the equation i = k1v + k2v0.5, in which k1v and k2v0.5 are the capacitive and diffusion-controlled contributions, respectively.38 According to the equation i/v1/2 = k1v1/2 + k2, the k1 and k2 can be simulated via plotting i(V)/v1/2 versus v1/2. The relative contribution of the capacitive and diffusion-controlled processes at different scan rates could be calculated (Fig. 7d). Specifically, at a scan rate of 0.9 mV s−1, the quantification of the capacitive contribution was 76% for PC and 80% for N-PC (Fig. 7e and f). The enhancement of the capacitive contribution is ascribed to the increase indefects and pyridinic-N in N-PC, both of which would have provided more active sites for accommodating K ions and accelerating the transmission of K+.30 Consequently, we can conclude that the capacitance process was responsible for the excellent electrochemical performance in KIBs with N-PC as the anode.
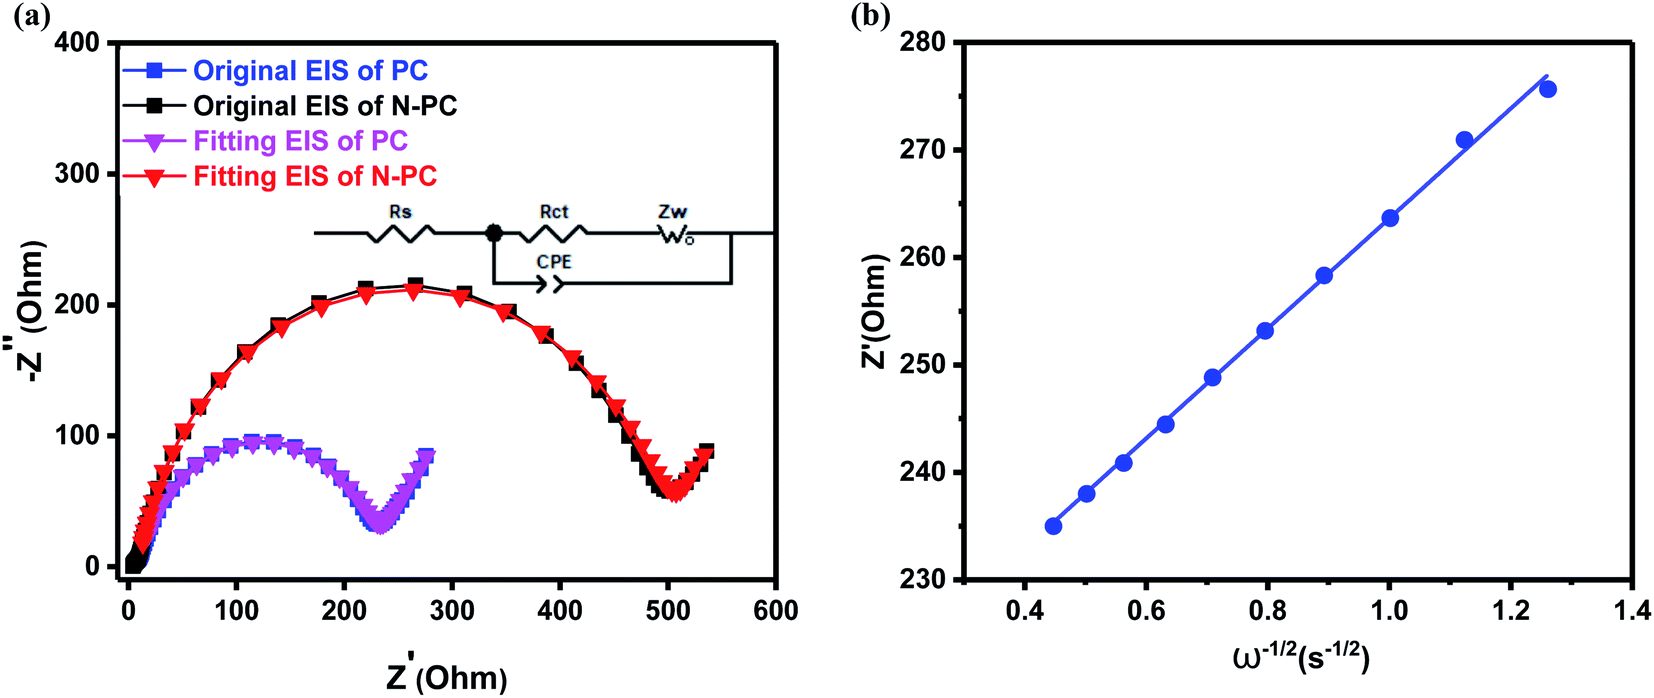
Fig. 8a shows the ex situ EIS spectra of the batteries with N-PC and PC as anode, which were collected before cycles. Two batteries exhibited identical Nyquist spectrum: a depressed semicircle in the high-frequency region and a slash in the low-frequency region.39 It is interesting that the EIS spectra were well overlapped with the fitting results. The inset of Fig. 8a shows the equivalent circuit which is fitted with the EIS curve. From the EIS curves, we can see that both materials have almost same ohmic resistance (Rs), but the battery with N-PC as anode exhibited much lower charge-transfer resistance/impedance (Rct). For PC material, its Rct is up to 500.85 Ω, over two times of that of N-PC (232.19 Ω), clearly, the N doping significantly accelerated electron transmission at the interface, resulting the better battery performance of N-PC material.
 | ||
| Fig. 8 (a) Nyquist plots of PC and N-PC; (b) the linear relationship between ω−1/2 and Z′ in the low-frequency region for N-PC. | ||
The slash of the spectrum is ascribed to Warburg impedance (Ws) during the diffusion of K+ in the electrodes. The diffusion coefficient of K+ (DK+) can be calculated via the formula:
 500C mol−1), C is the molar concentration of K+ in the electrode, and σ is the Warburg coefficient that can be calculated from the slope of line of Z′ versus ω−1/2.
Fig. 8b and S4b (ESI†) show the lines of Z′ versus ω−1/2 for both samples, the calculated slope values (σ) are 51.18 Ω s−1/2 for N-PC and 60.46 Ω s−1/2 for PC. Finally, we calculated the value of the K-ion diffusion coefficient (DK+) for the N-PC electrode is 3.47 × 10⁻¹¹ cm2 s−1, which is 40% higher than that of the PC electrode (2.48 × 10⁻¹¹ cm2 s−1). The increase in DK+ further accounted for the excellent rate performance of N-PC.
As shown in Fig. 9, experiments with N-PC using various first pyrolysis temperatures (700 °C, 800 °C, and 900 °C, respectively) demonstrated that 800 °C was the optimal pyrolysis temperatures for the sake of the best potassium storage ability.
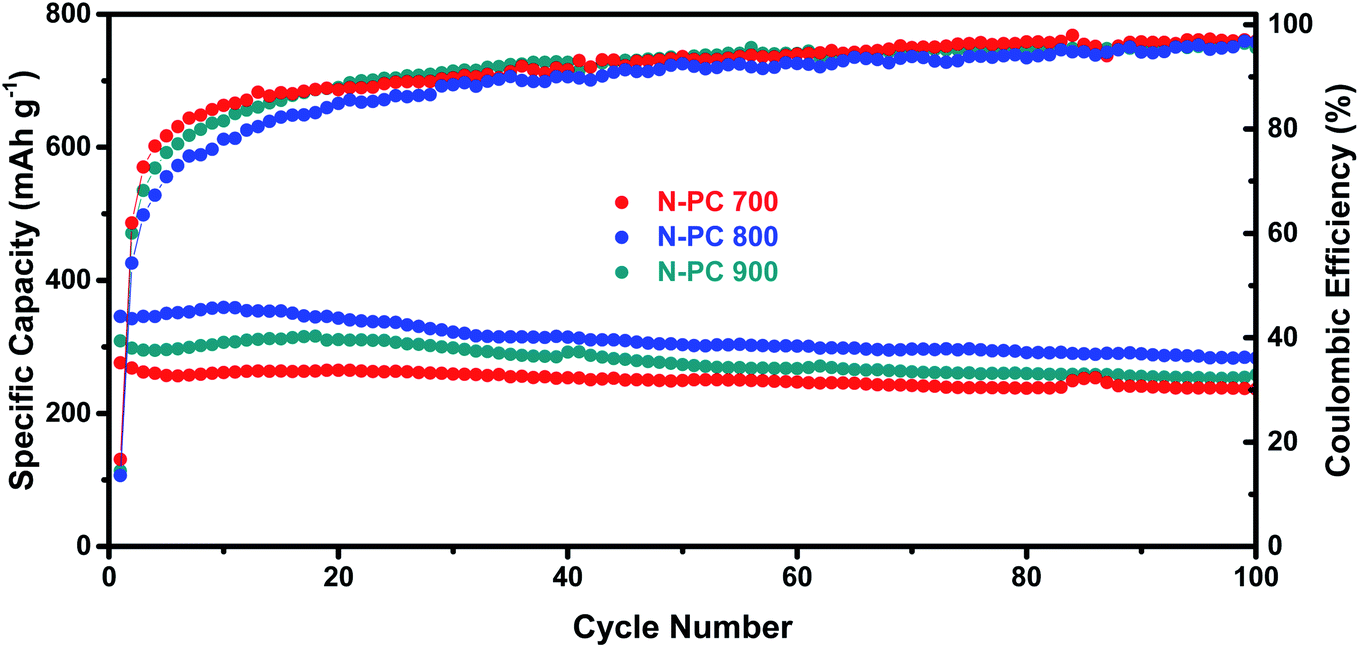 | ||
| Fig. 9 Cycling performance and coulombic efficiency of N-PC (700, 800, and 900 °C) at a current density of 0.1 A g−1. | ||
4. Conclusion
In summary, we successfully prepared a new type of nitrogen-doped mesoporous carbon material with a nano-octahedral morphology and a high surface area for use as the anode in a potassium ion battery instead of a conventional graphite-based anode. The material was prepared by a double-solvent diffusion-pyrolysis method and employed UIO-66-NH2 as the precursor. Our prepared material N-PC possessed high specific surface area and a well-defined mesoporous structure. It showed an impressive specific capacity of 309 mA h g−1 at 500 mA g−1, a stable long-term cycling performance at 0.1 A g−1 over 800 cycles, and a remarkable rate capability of 213 mA h g−1 at 2 A g−1. Quantitative analysis and theoretical simulations verified that surface-driven capacitance may be the dominant process for the excellent potassium storage performance. N-doping significantly altered the electronic structure and thus improved electrical conductivity and decreased the charge transfer resistance. This work may provide a reference for developing new types of carbon materials for KIBs instead of graphite materials, in which the interlayer space is too small to ensure the easy intercalation/deintercalation of potassium ions.Conflicts of interest
The submission of this manuscript has been approved by all the authors and explicitly by the responsible authorities where the work was carried out. The manuscript has not previously been published in any form, nor submitted for reviews to any other journals currently, and it will not submit it elsewhere until a decision has been made by this journal. If accepted, it will not be published elsewhere in the same form, in English or in any other language, without the written consent of your journal. Therefore, there will be no any conflict of interest for this manuscript.Acknowledgements
This work was supported by the National Key Research and Development Program of China (Project no. 2017YFB0102900, 2016YFB0101201), the National Natural Science Foundation of China (NSFC Project no. 51971094, 21476088, 21776104), and the Guangdong Provincial Department of Science and Technology (Project no. 2015A030312007).References
- A. Eftekhari, Z. Jian and X. Ji, Potassium Secondary Batteries, ACS Appl. Mater. Interfaces, 2017, 9, 4404–4419 CrossRef CAS.
- H. Kim, J. C. Kim, M. Bianchini, D. H. Seo, J. Rodriguez-Garcia and G. Ceder, Recent Progress and Perspective in Electrode Materials for K-Ion Batteries, Adv. Energy Mater., 2018, 8, 19 Search PubMed.
- P. X. Xiong, P. X. Bai, S. B. Tu, M. R. Cheng, J. F. Zhang, J. Sun and Y. H. Xu, Red Phosphorus Nanoparticle@3D Interconnected Carbon Nanosheet Framework Composite for Potassium-Ion Battery Anodes, Small, 2018, 14, 9 Search PubMed.
- X. X. Zou, P. X. Xiong, J. Zhao, J. M. Hu, Z. T. Liu and Y. H. Xu, Recent research progress in non-aqueous potassium-ion batteries, Phys. Chem. Chem. Phys., 2017, 19, 26495–26506 RSC.
- Q. J. Deng, J. F. Pei, C. Fan, J. Ma, B. Cao, C. Li, Y. D. Jin, L. P. Wang and J. Z. Li, Potassium salts of para-aromatic dicarboxylates as the highly efficient organic anodes for low-cost K-ion batteries, Nano Energy, 2017, 33, 350–355 CrossRef CAS.
- B. Huang, Y. Shao, Y. Liu, Z. Lu, X. Lu and S. Liao, Improving Potassium-ion Batteries by Optimizing the Composition of Prussian Blue Cathode, ACS Appl. Energy Mater., 2019, 9, 6528–6535 CrossRef.
- K. X. Lei, F. J. Li, C. N. Mu, J. B. Wang, Q. Zhao, C. C. Chen and J. Chen, High K-storage performance based on the synergy of dipotassium terephthalate and ether-based electrolytes, Energy Environ. Sci., 2017, 10, 552–557 RSC.
- D. S. Bin, X. J. Lin, Y. G. Sun, Y. S. Xu, K. Zhang, A. M. Cao and L. J. Wan, Engineering Hollow Carbon Architecture for High-Performance K-Ion Battery Anode, J. Am. Chem. Soc., 2018, 140, 7127–7134 CrossRef CAS.
- W. Luo, J. Y. Wan, B. Ozdemir, W. Z. Bao, Y. N. Chen, J. Q. Dai, H. Lin, Y. Xu, F. Gu, V. Barone and L. B. Hu, Potassium Ion Batteries with Graphitic Materials, Nano Lett., 2015, 15, 7671–7677 CrossRef CAS.
- Z. L. Jian, S. Hwang, Z. F. Li, A. S. Hernandez, X. F. Wang, Z. Y. Xing, D. Su and X. L. Ji, Hard-Soft Composite Carbon as a Long-Cycling and High-Rate Anode for Potassium-Ion Batteries, Adv. Funct. Mater., 2017, 27, 6 Search PubMed.
- Y. H. Feng, S. H. Chen, J. Wang and B. H. Lu, Carbon foam with microporous structure for high performance symmetric potassium dual-ion capacitor, J. Energy Chem., 2019, 43, 129–138 CrossRef.
- H. B. Ding, J. Wang, L. Fan, Z. M. Liu and B. H. Lu, Sn–Sb compounds with novel structure for stable potassium storage, Chem. Eng. J., 2020, 395, 125–147 CrossRef.
- Z. M. Liu, J. Wang and B. H. Lu, Plum pudding model inspired KVPO4F@3DC as high-voltage and hyperstable cathode for potassium ion batteries, Sci. Bull., 2020, 65, 1242–1251 CrossRef CAS.
- D. P. Li, X. H. Ren, Q. Ai, Q. Sun, L. Zhu, Y. Liu, Z. Liang, R. Q. Peng, P. C. Si, J. Lou, J. K. Feng and L. J. Ci, Facile Fabrication of Nitrogen-Doped Porous Carbon as Superior Anode Material for Potassium-Ion Batteries, Adv. Energy Mater., 2018, 8, 9 Search PubMed.
- Y. L. An, H. F. Fei, Z. Zhang, L. J. Ci, S. L. Xiong and J. K. Feng, Hyperporous Sponge Interconnected by Hierarchical Carbon Nanotubes as a High-Performance Potassium-Ion Battery Anode, Chem. Commun., 2017, 53, 8360–8363 RSC.
- M. H. Chen, C. Hu, X. F. Luo, A. J. Hong and C. L. Yuan, Ferromagnetic behaviors in monolayer MoS2 introduced by nitrogen-doping, Appl. Phys. Lett., 2020, 116, 7 Search PubMed.
- C. Hu, C. L. Yuan, A. J. Hong, M. M. Guo, T. Yu and X. F. Luo, Work function variation of monolayer MoS2 by nitrogen-doping, Appl. Phys. Lett., 2018, 113, 4 Search PubMed.
- Y. S. Wang, Z. P. Wang, Y. J. Chen, H. Zhang, M. Yousaf, H. S. Wu, M. C. Zou, A. Y. Cao and R. P. S. Han, A titanium-based metal–organic framework as an ultralong cycle-life anode for PIBs, Adv. Mater., 2018, 30, 10 Search PubMed.
- J. H. Cavka, S. Jakobsen, U. Olsbye, N. Guillou, C. Lamberti, S. Bordiga and K. P. Lillerud, A New Zirconium Inorganic Building Brick Forming Metal Organic Frameworks with Exceptional Stability, J. Am. Chem. Soc., 2008, 130, 13850–13851 CrossRef.
- J. L. Yang, Z. C. Ju, Y. Jiang, Z. Xing, B. J. Xi, J. K. Feng and S. L. Xiong, Enhanced Capacity and Rate Capability of Nitrogen/Oxygen Dual-Doped Hard Carbon in Capacitive Potassium-Ion Storage, Adv. Mater., 2018, 30, 11 Search PubMed.
- J. Yang, F. J. Zhang, X. Wang, D. S. He, G. Wu, Q. H. Yang, X. Hong, Y. Wu and Y. D. Li, Porous Molybdenum Phosphide Nano-Octahedrons Derived from Confined Phosphorization in UIO-66 for Efficient Hydrogen Evolution, Angew. Chem., Int. Ed., 2016, 55, 12854–12858 CrossRef CAS.
- L. Zheng, Y. Y. Dong, B. Chi, Z. M. Cui, Y. J. Deng, X. D. Shi, L. Du and S. J. Liao, UIO-66-NH2-Derived Mesoporous Carbon Catalyst Co-Doped with Fe/N/S as Highly Efficient Cathode Catalyst for PEMFCs, Small, 2019, 15, 11 Search PubMed.
- K. Share, A. P. Cohn, R. Carter, B. Rogers and C. L. Pint, Role of Nitrogen-Doped Graphene for Improved High-Capacity Potassium Ion Battery Anodes, ACS Nano, 2016, 10, 9738–9744 CrossRef CAS.
- G. L. Xia, C. L. Wang, P. Jiang, J. Lu, J. F. Diao and Q. W. Chen, Nitrogen/oxygen co-doped mesoporous carbon octahedrons for high-performance potassium-ion batteries, J. Mater. Chem. A, 2019, 7, 12317–12324 RSC.
- Y. Xu, C. L. Zhang, M. Zhou, Q. Fu, C. X. Zhao, M. H. Wu and Y. Lei, Highly nitrogen doped carbon nanofibers with superior rate capability and cyclability for potassium ion batteries, Nat. Commun., 2018, 9, 11 CrossRef.
- Z. F. Li, C. Bommier, Z. Sen Chong, Z. L. Jian, T. W. Surta, X. F. Wang, Z. Y. Xing, J. C. Neuefeind, W. F. Stickle, M. Dolgos, P. A. Greaney and X. L. Ji, Mechanism of Na-Ion Storage in Hard Carbon Anodes Revealed by Heteroatom Doping, Adv. Energy Mater., 2017, 7, 10 Search PubMed.
- Y. Deng, Y. Dong, G. Wang, K. Sun, X. Shi, L. Zheng, X. Li and S. Liao, Well-Defined ZIF-Derived Fe–N Codoped Carbon Nanoframes as Efficient Oxygen Reduction Catalysts, ACS Appl. Mater. Interfaces, 2017, 9, 9699–9709 CrossRef CAS.
- C. X. Li, S. H. Dong, R. Tang, X. L. Ge, Z. W. Zhang, C. X. Wang, Y. P. Lu and L. W. Yin, Heteroatomic interface engineering in MOF-derived carbon heterostructures with built-in electric-field effects for high performance Al-ion batteries, Energy Environ. Sci., 2018, 11, 3201–3211 RSC.
- Y. H. Xie, Y. Chen, L. Liu, P. Tao, M. P. Fan, N. Xu, X. W. Shen and C. L. Yan, Ultra-High Pyridinic N-Doped Porous Carbon Monolith Enabling High-Capacity K-Ion Battery Anodes for Both Half-Cell and Full-Cell Applications, Adv. Mater., 2017, 29, 9 Search PubMed.
- Y. P. Li, C. H. Yang, F. H. Zheng, X. Ou, Q. C. Pan, Y. Z. Liu and G. Wang, High pyridine N-doped porous carbon derived from metal–organic frameworks for boosting potassium-ion storage, J. Mater. Chem. A, 2018, 6, 17959–17966 RSC.
- A. Centrone, Y. Yang, S. Speakman, L. Bromberg, G. C. Rutledge and T. A. Hatton, Growth of Metal–Organic Frameworks on Polymer Surfaces, J. Am. Chem. Soc., 2010, 132, 15687–15691 CrossRef CAS.
- P. X. Xiong, X. X. Zhao and Y. H. Xu, Nitrogen-Doped Carbon Nanotubes Derived from Metal–Organic Frameworks for Potassium-Ion Battery Anodes, ChemSusChem, 2018, 11, 202–208 CrossRef CAS.
- Y. L. An, H. F. Fei, G. F. Zeng, L. J. Ci, B. J. Xi, S. L. Xiong and J. K. Feng, Commercial expanded graphite as a low cost, long-cycling life anode for potassium-ion batteries with conventional carbonate electrolyte, J. Power Sources, 2018, 378, 66–72 CrossRef CAS.
- J. Wang, D. Wang, K. Dong, AiminHao, S. Luo, Y. Liu, Q. Wang, Y. Zhang and Z. Wang, Fabrication of Porous Carbon with Controllable Nitrogen Doping as Anode for High-Performance Potassium-Ion Batteries, ChemElectroChem, 2019, 6, 3699–3707 CrossRef CAS.
- B. Cao, Q. Zhang, H. Liu, B. Xu, S. Zhang, T. Zhou, J. Mao, W. K. Pang, Z. Guo, A. Li, J. Zhou, X. Chen and H. Song, Graphitic Carbon Nanocage as a Stable and High Power Anode for Potassium-Ion Batteries, Adv. Energy Mater., 2018, 8, 1801149 CrossRef.
- P. Simon, Y. Gogotsi and B. Dunn, Where Do Batteries End and Supercapacitors Begin, Science, 2014, 343, 1210–1211 CrossRef CAS.
- C. L. Yan, X. Gu, L. Zhang, Y. Wang, L. T. Yan, D. D. Liu, L. J. Li, P. C. Dai and X. B. Zhao, Highly dispersed Zn nanoparticles confined in a nanoporous carbon network: promising anode materials for sodium and potassium ion batteries, J. Mater. Chem. A, 2018, 6, 17371–17377 RSC.
- L. D. Shi, D. Z. Li, J. L. Yu, H. C. Liu, Y. Zhao, H. L. Xin, Y. M. Lin, C. D. Lin, C. H. Li and C. Z. Zhu, Uniform core–shell nanobiscuits of Fe7S8@C for lithium-ion and sodium-ion batteries with excellent performance, J. Mater. Chem. A, 2018, 6, 7967–7976 RSC.
- W. Wang, J. H. Zhou, Z. P. Wang, L. Y. Zhao, P. H. Li, Y. Yang, C. Yang, H. X. Huang and S. J. Guo, Short-Range Order in Mesoporous Carbon Boosts Potassium-Ion Battery Performance, Adv. Energy Mater., 2018, 8, 8 Search PubMed.
Footnote |
| † Electronic supplementary information (ESI) available. See DOI: 10.1039/d0ra08808k |
| This journal is © The Royal Society of Chemistry 2021 |