
 Open Access Article
 This Open Access Article is licensed under a
 Creative Commons Attribution 3.0 Unported Licence
A label-free fluorescent peptide probe for sensitive and selective determination of copper and sulfide ions in aqueous systems†
Yadan Zhanga,
Yunhui Caia,
Yonghui He b,
Qinlu Lina,
Jiali Rena,
Dongsheng Caoc and
Lin Zhang*a
b,
Qinlu Lina,
Jiali Rena,
Dongsheng Caoc and
Lin Zhang*a
aNational Engineering Laboratory for Rice and Byproduct Deep Processing, Hunan Key Laboratory of Processed Food for Special Medical Purpose, Hunan Key Laboratory of Forestry Edible Resources Safety and Processing, School of Food Science and Engineering, Central South University of Forestry and Technology, Changsha 410004, P. R. China. E-mail: zhanglin840514@126.com
bKey Laboratory of Chemistry in Ethnic Medicinal Resources, State Ethnic Affairs Commission & Ministry of Education, Yunnan Minzu University, Kunming, Yunnan 650500, P. R. China
cXiangya School of Pharmaceutical Science, Central South University, Changsha 410083, P. R. China
First published on 17th February 2021
Abstract
A label free fluorescent peptide probe (HDSGWEVHH) was used for Cu2+ and S2− determination in aqueous solution. Our results demonstrated that HDSGWEVHH is highly selective and sensitive for monitoring free Cu2+ concentration via quenching of the probe fluorescence upon Cu2+ binding. The mechanism of the complexation is investigated with Cyclic Voltammetry (CV), 1H nuclear magnetic resonance (NMR), electron paramagnetic resonance (EPR) spectroscopy and computational techniques. Theoretical calculation results indicated the binding ratio of the probe to Cu2+ is 2![[thin space (1/6-em)]](https://www.rsc.org/images/entities/char_2009.gif) :1 and the binding constant was obtained as 1.72 × 10 8 M−1. Cu2+ concentration can be detected with the detection limit of 16 nM. Free Cu2+ concentration released from the metallothionein–Cu complex at different pH values was detected. Cu2+ concentration in real water and tea samples was also detected, and the results were consistent with the ones monitored by atomic absorption spectrometer. Because of the exceedingly small Ksp value of CuS (1.27 × 10−36), S2− can sequester Cu2+ from HDSGWEVHH to restore the tryptophan (W) fluorescence. Thus the HDSGWEVHH–Cu2+ complex can also be used for S2− detection. The S2− concentrations can be monitored with a detection limit of 19 nM. The assay is also amenable to measurement of S2− concentration in pure water samples. Thus the probe designed herein is sensitive, label free, low cost, and environmentally friendly for Cu2+ and S2− determination in aqueous solutions.
:1 and the binding constant was obtained as 1.72 × 10 8 M−1. Cu2+ concentration can be detected with the detection limit of 16 nM. Free Cu2+ concentration released from the metallothionein–Cu complex at different pH values was detected. Cu2+ concentration in real water and tea samples was also detected, and the results were consistent with the ones monitored by atomic absorption spectrometer. Because of the exceedingly small Ksp value of CuS (1.27 × 10−36), S2− can sequester Cu2+ from HDSGWEVHH to restore the tryptophan (W) fluorescence. Thus the HDSGWEVHH–Cu2+ complex can also be used for S2− detection. The S2− concentrations can be monitored with a detection limit of 19 nM. The assay is also amenable to measurement of S2− concentration in pure water samples. Thus the probe designed herein is sensitive, label free, low cost, and environmentally friendly for Cu2+ and S2− determination in aqueous solutions.
Introduction
Copper (Cu) is an essential metal for the human body at trace level but its accumulation has been linked to several copper-transport diseases (e.g., Wilson's disease and several neurological disorders).1 In cellular milieu, copper is tightly regulated by a variety of proteins (e.g. metallothioneins), as free Cu2+ can lead to production of reactive oxygen species (through the Fenton-like reaction) and oxidative stress, which could induce damage of cells and human health.2 The excess free copper uptake could be from drinking water and foods. Thus the maximum concentrations of copper in drinking water are limited to 1.3 mg kg−1 (∼20 μM) and 1.0 mg kg−1 (∼15 μM) by the U.S. Environmental Protection Agency (EPA) and China, respectively.3 The maximum concentrations in tea are limited to 150 mg kg−1 and 60 mg kg−1 in the U.S.A. and China, respectively.4 Thus monitoring free Cu2+ in water or Cu2+ released from metallothionein (MT) are important for food safety and biological studies.Recent studies have suggested that H2S is an endogenously produced gaseous signaling compound (gasotransmitter) with importance comparable to that of the other two known endogenous gasotransmitters, nitric oxide (NO) and carbon monoxide (CO).5,6 H2S contributes to a diverse array of physiological processes, including vasodilation, angiogenesis, oxygen sensing, apoptosis, inflammation, and neuromodulation.7–9 But, excessive sulfide (S2−) are related with diseases ranging from Alzheimer's disease and Down's syndrome to diabetes and liver cirrhosis.10–13 Moreover, S2− as a member of the active sulfur species is an environmental pollutant, which is emitted from the leather industry, pulp removal and refinery.14 The excessive S2− could influence the food safety and human health, thus the maximum concentration of S2− in drinking water is limited to 0.48 mg kg−1 (∼15 uM) (World Health Organization, WHO).15
Recently, a number of different analytical techniques (e.g. atomic absorption spectroscopy, inductively coupled plasma atomic emission spectrometry, and electrochemical technique) have been used for determination of copper and sulfide.16–22 Nevertheless, the methods generally require time-consuming procedures and the use of expensive, sophisticated instruments. In contrast, some spectroscopic methods were developed.23–25 Among them, fluorescence spectroscopy is attractive owing to its simplicity, and high sensitivity. Wu and coworkers synthesized 4-dimethylamino-benzoic acid (2-imidazole formaldehyde)-hydrazide for Cu2+ and S2− determination.15 The detection limits for Cu2+ and S2− determination are 15 nM and 0.12 μM, respectively. Nagano and coworkers reported a Cu2+ and S2− determination probe (HSip-1), which consists of a cyclen macrocycle attached to fluorescein.26 The detection limits of the HSip-1 method for Cu2+ and S2− are both around 10−6 M. However, as other organic fluorescent probes, most of the Cu2+ coordination compounds need complex synthesis process, and some of them have poor solubility in aqueous solutions and are toxic to cells and human. Thus peptide fluorescence probe were designed for Cu2+ and S2− determination. Tang and coworkers developed the dansyl groups labeled tetra-peptide fluorescence probe for detecting Cu2+ and S2− in aqueous solutions. The detection limits for Cu2+ and S2− are 88 nM and 75 nM, respectively.27 A dansyl group labeled peptide fluorescent chemosensor was synthesized for Cu2+, Zn2+ and S2− determination by the same group. And the detection limits for Cu2+ and Zn2+ are 78 nM and 82 nM, respectively.28 Among these peptide based fluorescent probes for Cu2+ and S2− determination, most of them were fluorophore labelled.29–32 In our previously work, a label free tetra-peptide was designed for Cu2+ detection. The detection limit for Cu2+ is 8 nM.33 But the binding model and S2− determination characters have not been studied.
To develop a water soluble and label free fluorescent probe for both Cu2+ and S2− determination, a mutant amyloid beta (Aβ) peptide (HDSGWEVHH) which is innocuous to cells have been used in the present work as a peptide based fluorescent probe for both Cu2+ and S2− detection in aqueous solutions. Aβ peptides are known to interact strongly with Cu2+ with a quite large binding constant (Ka ∼1011 M−1),34 which could result in the high selective binding to Cu2+. The fluorescence of the peptide (HDSGWEVHH) could be quenched by Cu2+ binding and be recovered by S2−. According the fluorescence changes, free Cu2+ concentration released from the MT–Cu complex at different pH and Cu2+ concentrations in drinking water and tea samples were detected. S2− concentrations in real water samples have also been investigated.
Experimental
Chemicals and reagents
HDSGWEVHH was designed and synthesized in our lab with an automatic peptide synthesizer (Symphony Quartet, Tucson, AZ, USA). MT–Zn7, isolated form rabbit liver, was purchased from Hunan Lugu Biotechnology Co. (Changsha, China). Sodium sulfide, sodium hydroxide, sulfuric acid, copper sulfate, 5,5′-dithio-bis-(2-nitrobenzoate) (DTNB), 4-(2-hydroxyethyl)-1-piperazinee-thanesulfonic acid (HEPES), and other chemicals were acquired from Sigma Chemicals (St. Louis, MO, USA). Bama tea was purchased from supermarket (Changsha, China). All of the aqueous solutions were prepared using water purified by a Simplicity Water Purification System (Millipore, Billerica, MA, USA) to a resistivity of 18 MΩ cm.Peptide synthesis
HDSGWEVHH was synthesized via solid-phase Fmoc chemistry on a Symphony Quartet peptide synthesizer (Protein Technologies, Tucson, AZ, USA). The Fmoc groups were deprotected with 20% piperidine in dimethylformamide (v/v) after the coupling reaction had proceeded for 30 min. Upon dehydration on a freeze dryer (VirTis Benchtop K, Warminster, PA, USA), the crude product was purified by semipreparative reversed phase (RP) HPLC (Shimadzu 6AD, Columbia, MO, USA) using a column (Jupiter-10-C18-300, 10 mm i.d. × 250 mm) from Phenomenex (Torrance, CA, USA). The eluents were 0.1% trifluoroacetic acid in water (v/v, mobile phase A) and 0.1% trifluoroacetic acid in acetonitrile (v/v, mobile phase B). At a flow rate of 4.75 mL min−1, a purification of HDSGWEVHH was accomplished with a linear gradient of 10–65% phase B for 13 min. The purity of the synthesized peptides was verified by HPLC and electrospray-mass spectrometry (ESI-MS) (Fig. S1 and S2†) (Fig. 1). | ||
| Fig. 1 Structure of HDSGWEVHH. | ||
Sample preparation
HDSGWEVHH stock solutions (1–2 mM) were prepared by directly dissolving the lyophilized solid samples in 10 mM NaOH. They were then diluted with 10 mM HEPES buffer (pH 7.4) to desired concentration. All concentrations of the peptide solutions were based on UV-vis measurements.The Cu2+ stock solution was prepared by dissolving 1 mM CuSO4 in 1 mM H2SO4 solution. For cation selectivity studies, 1 mM stock solutions of various metal ions were prepared by dissolving FeCl3, CaCl2, ZnSO4, MgCl2, MnCl2, CoCl2, FeCl2, Cs2SO4, NaCl and KCl in 10 mM H2SO4. Stocks of CrCl3, AlCl3, CdCl2, BaCl2 and NiCl2 solution (50 μM) were freshly prepared with 50 μM HCl solutions. Stocks of Pb(NO3)2 and Hg(NO3)2 solution (50 μM) were freshly prepared with 50 μM HNO3 solutions. For anion selectivity studies, 0.1 mM stock solutions of various anions were freshly prepared by dissolving Na2S2O3, Na2SO4, Na2SO3, NaHSO3, Na3PO4, NaHCO3, NaNO2, NaOAC, NaF, NaCl, NaBr, and NaI in water. Stock solution of Na2S was freshly prepared with deionized (DI) water (Na2S was used as a sulfide source in all experiments). All the stock solutions were diluted with 10 mM HEPES buffer (pH 7.4) to desired concentration.
To prepare the MT–Cu solution, the commercial lyophilized powder of MT–Zn7 was first dissolved in HCl (pH 2) to a final concentration of 1 mg mL−1. The resulting solution was incubated at 4 °C for 12 h, and then centrifuged with the 3000 Da cutoff (YM-3) Millipore membrane (Millipore Billerica, MA, USA) at 13000 rpm while incubating at 4 °C for 30 min. The supernatant was used as the apo–MT solution. Complete removal of Zn2+ from MT–Zn7 was confirmed by the disappearance of the characteristic absorption of MT–Zn7 at 250 nm.35 When the apo–MT was obtained, CuSO4 (1 mM) was added into the apo–MT containing solution. The final concentrations of MT and Cu2+ both were 100 μM, pH is around 6. Owing to the equal amount of MT and Cu2+, the MT–Cu was formed as the final complex. All the aqueous solutions for MT–Cu preparation were prepared using DI water, and purged with nitrogen gas to prevent oxidation of free thiol groups on apo–MT.
UV-visible spectroscopy
UV-vis measurements were performed using a UV-2450 spectrometer (Shimadzu, Japan). The concentration of soluble peptides were determined according to absorbance at 280 nm and using extinction coefficients of tryptophan (ε279 = 5400 cm M−1) and tyrosine (ε276 = 1410 cm M−1) for HDSGWEVHH and Aβ(1–16), respectively.36 The apo–MT concentration was determined by assaying thiol groups with Ellman's reagent, DTNB.37Fluorescence spectroscopy
Fluorescence measurements of HDSGWEVHH peptide solutions were carried out at room temperature with a Hitachi F-4600 spectrofluorometer (Hitachi, Japan). An excitation wavelength (λex) of 280 nm was used, and the emission intensity were recorded at 304 nm and 356 nm for Aβ(1–16) and HDSGWEVHH, respectively. The entrance and exit slits both were 10 nm. Fluorescence measurements were performed three times, and the standard deviation was plotted as error bar.The quantum yield (ϕ) of Aβ(1–16) and HDSGWEVHH were determined by the following expression:33
 | (1) |
Electrochemical measurements
Cyclic Voltammetry (CV) experiments were performed with 660D electrochemical analyzer (ChenHua, shanghai, China). The glassy carbon electrode (ChenHua, shanghai, China) was used as the working electrode. Ag/AgCl electrode (ChenHua, shanghai, China) was employed as the reference electrode, and a Pt wire (ChenHua, shanghai, China) was used as the auxiliary electrode. Before performing experiment, the working electrode was polished with 0.3 μM alumina. The scan rate was 0.1 V s−1. The concentration of Cu2+ was 100 μM, and the one of HDSGWEVHH was 200 μM.Measurements of electron paramagnetic resonance
The electron paramagnetic resonance (EPR) spectra were recorded by a EMXPLUS spectrometer (Bruker BioSpin, Switzerland). The microwave power was 2.000 mW, the magnetic field modulation frequency was 100.00 kHz and the modulation amplitude was 4.000 G. All the experiments were performed at liquid nitrogen temperatures.Nuclear magnetic resonance measurements
HDSGWEVHH solution (5.18 μM) was prepared by directly dissolving the lyophilized solid samples in deuterated water (D2O). Then added Cu2+ to get HDSGWEVHH (5.18 μM)–Cu2+ (2.59 μM) complex. The solutions were transferred into Nuclear Magnetic Resonance (NMR) tubes, and the 1H NMR spectra (500 MHz) were recorded by a AVANCE III NMR spectrophotometer (Bruker BioSpin, Switzerland) at room temperature.Theoretical calculations for the coordination modes
Firstly, the model of HDSGWEVHH–Cu2+ for the computational studies were generated by semiempirical theory calculation (pm7) with the ratio 2:1 for the peptide and Cu2+. Then, quantum mechanics/molecular mechanics (QM/MM) geometry optimizations for the binding modes were performed with Cu2+ and three histidine residues in QM region, while the remainder of the model was treated with MM. All geometer optimizations were carried out on a cluster of 2 pentium Xeon nodes employing the Gaussian 16 suite of programs. The theoretical level b3lyp/6-31G(d) was used for the QM calculation. The universal force field (UFF) and the charges equilibration (QEq) approach were used for the MM region.
Determination of dissociation constants
The fluorescence intensity changes upon Cu2+ binding reflects the amount of peptide–Cu2+ complex formed. Thus, dissociation constants, Kd, for peptide–Cu2+ were determined from the fluorescence intensity as a function of total free Cu2+ concentration, [L], using equation:38
 | (2) |
The limit of detection
The limit of detection (LOD) was calculated by the data of fluorescence titration experiments. Formula LOD = 3σ/m, where σ is the standard deviation of this blank measurements, which was obtained by the fluorescence intensity of HDSGWEVHH in the absence of Cu2+, measured ten times. m is the slop of the fluorescence intensity versus the concentration of Cu2+ ion.39 The detection limit of S2− was detected with the same method.Determination of free copper concentration released by MT–Cu
HCl and NaOH solutions were used to adjust the pH of the MT–Cu solutions. MT–Cu solutions (100 μM, 1 μL) whose pH were adjusted to different values were used as samples. The concentration of HDSGWEVHH used for determination was 2 μM. The fluorescence intensities of the solutions were recorded.Determination of copper concentration in tea sample
The tea samples were dried at 80 °C for 6 h, grounded into powder and sifted through a 80-mesh sieve. The tea powder (0.6 g) was weighted and treated with 12.6 mL HNO3 and 1.4 mL HClO4 in a digestion tube for 12 h. Then the mixed solution was digested with graphite oven (SH220N, Manon, JiNan, China) followed the digestion procedure as shown in Table S1.† When the temperature reaches 240 °C, 20 mL DI water was added into the tube to remove excess acid solution. After digestion, solutions were cooled to room temperature and diluted into 25 mL with DI water for detecting the Cu2+ concentration by peptide probe and atomic absorption spectroscopy (AAS) method. Every sample was repeated three times.Determination of copper concentration in water samples
Water samples were filtered with filter (0.45 μm). HDSGWEVHH (10 μL, 200 μM) was added into the HEPES (188 μL, 10 mM, pH 7.4) buffer, and then a filtered real sample (2 μL) was added into the mixture. The fluorescence intensities of the resulting mixtures were recorded. Each experiment was repeated three times.Atomic absorption spectroscopy measurements
To assess the accuracy of the method, the Cu2+ concentrations in real tea and water samples were also analyzed using an atomic absorption spectrometer (AAS, NOVAA350; Analytik Jena AG, Jena, Germany). The lamp current was set at 3.0 mA, and the spectral bandwidth was operated at 1.4 nm. The analytical wavelength was set at 324.8 nm. The working standard solutions were prepared daily through a stepwise dilution of the standard stock solutions with 0.5% (v/v) nitric acid (HNO3). All containers and glassware for the AAS test were cleaned by soaking them in 5 M HNO3 for at least 24 h and rinsing three times with DI water prior to use.Detection of S2− concentration in real sample
Water samples were filtered with filter (0.45 μm). HDSGWEVHH–Cu2+ (40 μL, 10 μM) was added into the HEPES (60 μL, 40 mM, pH 7.4) buffer, and then the filtered sample (100 μL) was added into the mixture. The fluorescence intensities of the resulting mixtures were recorded. Each experiment was repeated three times.Results and discussion
Design and characters of fluorescence peptide probe
Studies on amyloid beta (Aβ) have shown that the three histidine residues provide the coordination sphere to Cu2+.33,40,41 And tyrosine residue at position 10 of Aβ peptides (Y10) does not contribute to Cu2+ binding, but its fluorescence intensity could be decreased when Cu2+ bound with the Aβ peptides.42–45 According the sequence of Aβ (6–14) (HDSGYEVHH),46,47 the modified peptide (HDSGWEVHH) was synthesized for Cu2+ determination. The sequence of Aβ(1–16) and our probe were shown in Table 1. Similar as the other reports,48–51 histidine (H) residues were selected for binding Cu2+ ions and our peptide fluorescence probe (HDSGWEVHH) is organic fluorophore label free and easily synthesized with amino acid residues.| Peptide | Sequence |
|---|---|
| Aβ(1–16) | DAEFRHDSGYEVHHQK |
| Probe | HDSGWEVHH |
As shown in Fig. S3,† the maximum absorption peak of HDSGWEVHH was around 280 nm. Thus 280 nm was chosen in our work as the excitation wavelength (λex) for fluorescence emission determination. As shown in Fig. 2A, the emission wavelength of Aβ(1–16) is at 304 nm (Fig. 2A, line b), while the one of HDSGWEVHH is at 356 nm (Fig. 2A, line a). And the fluorescence intensity of HDSGWEVHH is around 1380, which is around 11 times higher than the one of Aβ(1–16). This is due to the quantum yield (ϕ) value of HDSGWEVHH was 0.21 (cf. ϕ value calculated with eqn (1)), which is much stronger than the one of Aβ(1–16) (0.04) (cf. ϕ value calculated with eqn (1)).
 | ||
| Fig. 2 (A) Fluorescence spectra of HDSGWEVHH and Aβ(1–16) with the same excitation wavelength at 280 nm. (B) Fluorescence spectra of HDSGWEVHH in the absence (curve a) and presence of 0.49 (curve b), 0.74 (curve c) and 1 μM (curve d) Cu2+. The spectra were obtained in 10 mM HEPES buffer (pH 7.4), and the concentrations of Aβ(1–16) and HDSGWEVHH were both at 2 μM. | ||
With the addition of Cu2+, the fluorescence intensity of probe decreases inversely (Fig. 2B). This behavior was highly comparable to the other Cu2+-bound peptides, such as amyloid beta (1–42).52 This is because the nitrogen of the imidazole ring of histidine provides the coordination sphere to Cu2+.33 Tyrosine (in Aβ(1–16)) or tryptophane (in our probe) is not involved in the coordination, but their fluorescence could be quenched by the interaction between peptide and Cu2+. As shown in Fig. 2B, the fluorescence intensity of probe is highly dependent on copper concentration. These results indicated that HDSGWEVHH can be considered as a fluorescent probe for determining the concentration of Cu2+.
To investigate the interference of the environment to the fluorescence intensity of HDSGWEVHH, the fluorescence intensity were detected at different conditions. As shown in Fig. 3A, with 2 h scanning, the fluorescence intensity of the probe kept stably, which indicated the probe has a good stability. This result also suggested that the peptide had not aggregated during the scanning time, which is consistent with the Aβ(1–16) peptide.53 The fluorescence intensity of probe which incubated at different temperature was also recorded (Fig. 3B). At 25 °C, the highest fluorescence intensity was obtained. At the higher temperature (above 25 °C), the lower fluorescence intensity was obtained. This is probably due to that with the increase of temperature, the probability of molecular collision was increased. And the non-radiative transition occurred, which resulted in the decreased fluorescence intensity.54 As shown in Fig. 3C, when the pH value was in the range of 2 to 8, fluorescence intensity of the probe increased with the pH raise. When the pH value was above 8, the fluorescence intensity reached the highest value and kept stable. The influence of pH on the fluorescence intensity is probably due to the alteration of the molecular orbital of the excitable electrons.55 This also could be the consequence of ionization status of the fluorescent molecules at different pH.55 As shown in Fig. 3D, when the pH value was around 7.4 or 8.0, the fluorescent quenching efficiency was reached the highest value (around 45%). One possible explanation was that at pH 7.4 or 8.0, the ionization status of HDSGWEVHH could provide a more stable and tight coordination sphere binding to Cu2+. Owing to the 7.4 is more closer to the neutral pH and the normal human fluid pH, pH 7.4 was selected for the assays.
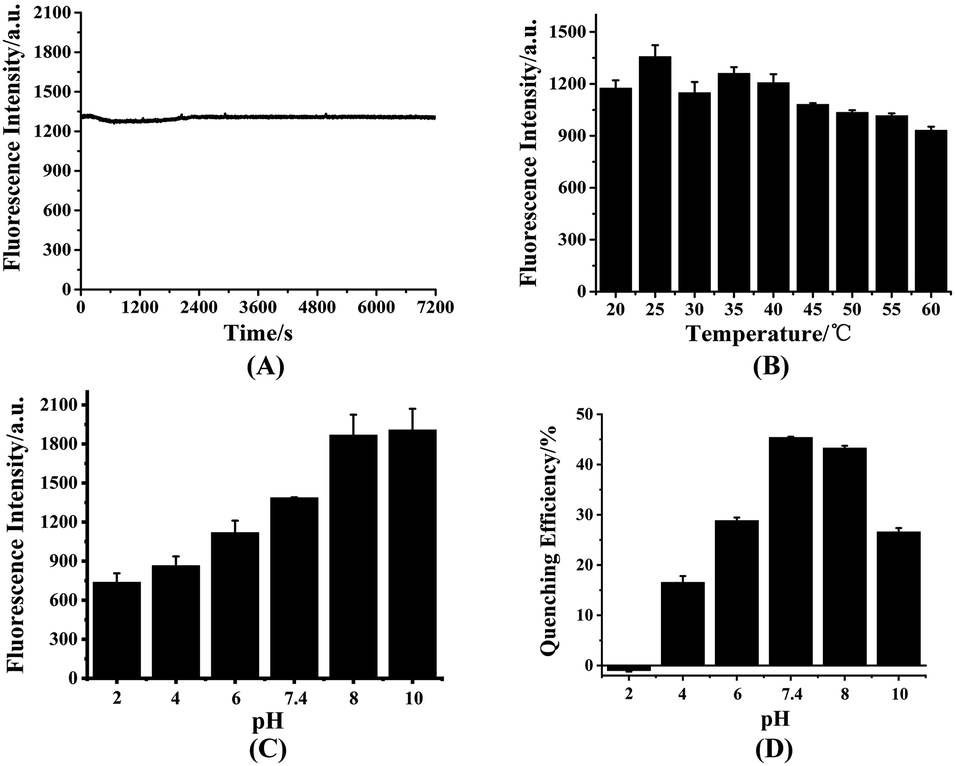 | ||
| Fig. 3 Fluorescence intensity of HDSGWEVHH at different conditions, including different scanning time (A), different temperature (B), different pH (C) and the quenching efficiency of Cu2+ to HDSGWEVHH (D). The concentration of HDSGWEVHH was 2 μM, and the one for Cu2+ was 1 μM. | ||
Complexation mechanism of HDSGWEVHH–Cu2+ complex
To investigate the mechanism of the copper complexation and oxidation state of Cu, 1H NMR, EPR, CV and computational studies were employed.56 As shown in Fig. 4A, Cu2+ in solution shows peaks at 0.098 mV, 0.066 mV and −0.110 mV vs. Ag/AgCl (Fig. 4A-a) It indicated that in the presence of oxygen, the Cu+ reduced from free Cu2+ and consequent Cu+ is further reduced to Cu0.57,58 But the mixture of HDSGWEVHH/Cu2+ shows peaks at 0.300 mV and 0.093 mV vs. Ag/AgCl. CV results indicated the formation of a electrochemically stable complex in HDSGWEVHH/Cu2+ solution, but do not provide any conclusive structural information. Analysis of EPR spectra of frozen solutions obtained that copper exists in +2 oxidation state both in the absence and presence of HDSGWEVHH (Fig. S4†). 1H NMR analysis of HDSGWEVHH solution shows signals that arise at 8.60–6.90 ppm, which were attributed to the protons of the aromatic region. Thus these signals were assigned to the protons of histidine imidazole rings and tryptophone benzpyrole rings.59 With the addition of Cu2+, the peaks at 8.60–6.90 ppm were broadening (Fig. 4B). These results are consistant with other studies that metal binding with the peptide could cause a number of 1H NMR resonances, resulting in broadening signals.60,61 Our results indicated that the protons of histidine imidazole rings and tryptophone benzpyrole rings were influenced by Cu2+ addition. But the coordination mode is also not clear.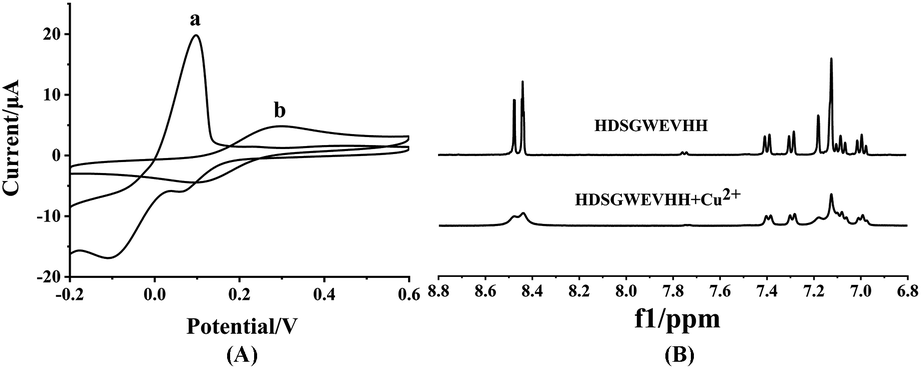 | ||
| Fig. 4 (A) CV spectra of 100 μM Cu2+ solution (a) and 200 μM HDSGWEVHH/100 μM Cu2+ mixture (b). (B) 1H NMR spectra of HDSGWEVHH (5.18 μM) in D2O in the absence of Cu2+ and presence of Cu2+ (2.59 μM). | ||
To investigate the coordination mode of HDSGWEVHH–Cu2+ complex, computational studies were employed for theoretical calculation. As shown in Fig. 5, the molar radio of HDSGWEVHH to Cu2+ in the complex was 2:1, and a T-shaped three-coordinate mode was found by the QM/MM calculation for HDSGWEVHH–Cu2+ complex. In this T-shaped mode, Cu2+ is coordinated by three histidines, of which two are from C-terminate of one HDSGWEVHH chain, and another is from N-terminate of the other HDSGWEVHH chain. This result is consistent with recent researches.62–65
 | ||
| Fig. 5 QM/MM-optimized molecular geometries of HDSGWEVHH–Cu2+. The balls denote the Cu2+ and the ligands included in the QM region. The thin gray wireframe donates the MM region. | ||
Dissociation constant detection of HDSGWEVHH–Cu2+ complex
To calculate the dissociation constant (Kd) of HDSGWEVHH–Cu2+, the fluorescence intensity at 356 nm for HDSGWEVHH in the presence of different concentrations of Cu2+ was obtained. When Cu2+ concentration is greater than 1.0 μM, the HDSGWEVHH fluorescence intensity turned out to be stable (as shown in Fig. 6). It is suggested that the molar ratio of the HDSGWEVHH to Cu2+ in the complex is 2:1 which is consistent with the results of computational calculation results (Fig. 5). Meanwhile, the dissociation (Kd) constant of HDSGWEVHH peptide to Cu2+ was analyzed by a nonlinear-least-squares regression with eqn (2),38 depending on the fluorescence intensity changes of HDSGWEVHH as a function of Cu2+ concentration (Fig. 6). The peptide concentration used for the binding constant measurement was 2 μM, and free Cu2+ concentration was fixed within 0–1 μM. The calculated dissociation (Kd) and binding (Kb) constants of HDSGWEVHH peptide to Cu2+ at pH 7.4 were 5.8 × 10⁻⁸ M and 1.72 ×10⁸ M−1, respectively. The calculated Kb is two order higher than the one of Aβ(1–16) (1 × 10⁶ M−1).38 This is probably due to that comparing with Aβ(1–16),66 the lack of amino acid residues at the N and C terminals, which resulted in the exposing of HDSGWEVHH (His) coordination site directly to copper (Fig. 5). Three histidine residues which from two different HDSGWEVHH molecules provided more tight coordination sphere to Cu2+ than Aβ(1–16).
 | ||
| Fig. 6 Determination of Kd using the quenching of the probe fluorescence by Cu2+ at pH 7.4. The squares are experimental data, and the curve is a nonlinear-least-squares regression fit with eqn (2) with a probe concentration of 2.0 μM (R2 = 0.998). | ||
The selectivity of HDSGWEVHH to Cu2+ was assessed against common metal ions, such as Cr3+, Fe3+, Al3+, Cu2+, Fe2+, Zn2+, Pb2+, Co2+, Ca2+, Mn2+, Mg2+, Ba2+, Cd2+, Hg2+, Ni2+, Cs+, Na+, and K+ (Fig. 7). Among these ions, only Cu2+ displayed noticeable fluorescence quenching. Our results therefore demonstrate that HDSGWEVHH is a viable probe for determining Cu2+ concentrations in water samples.
 | ||
| Fig. 7 Selectivity of HDSGWEVHH probe to Cu2+ with respect to common metal ions. Fluorescence intensity of HDSGWEVHH solution in the absence of metal ions (0) and in the presence of metal ions: Cr3+ (1), Fe3+ (2), Al3+ (3), Cu2+ (4), Fe2+ (5), Zn2+ (6), Pb2+ (7), Co2+ (8), Ca2+ (9), Mn2+ (10), Mg2+ (11), Ba2+ (12), Cd2+ (13), Hg2+ (14), Ni2+ (15), Cs+ (16), Na+ (17), and K+ (18). The concentrations of HDSGWEVHH, Al3+, Ba2+, Cd2+, Hg2+, Ni2+ and Pb2+ were 2 μM, the one of Cu2+ was 1 μM, and the concentrations of other metal ions were 100 μM. The relative standard deviations, shown as error bars, vary from 0.22 to 2.94%. | ||
Selectivity and fluorescence responses of HDSGWEVHH to Cu2+
The dependence of HDSGWEVHH fluorescence intensity on Cu2+ concentration was also investigated. As shown in Fig. 8, when the concentration of HDSGWEVHH was 2 μM, between 50 nM and 1.0 μM, a linear dependence (R2 = 0.9928) was observed. Increase the concentration of the probe from 2 μM to 8 μM, the similar trend was obtained (Fig. S5†). And the linear range of 8 μM probe was from 150 nM to 4.0 μM. It indicated that the linear range of the probe is concentration dependent. The detection limit (3σ/m) of HDSGWEVHH for Cu2+ detection was estimated to be 16 nM (n = 10) when the probe concentration was 2 μM. The lower detection limit is due to the high binding affinity (1.72 × 10 8 M−1) of HDSGWEVHH to Cu2+ (Fig. 6).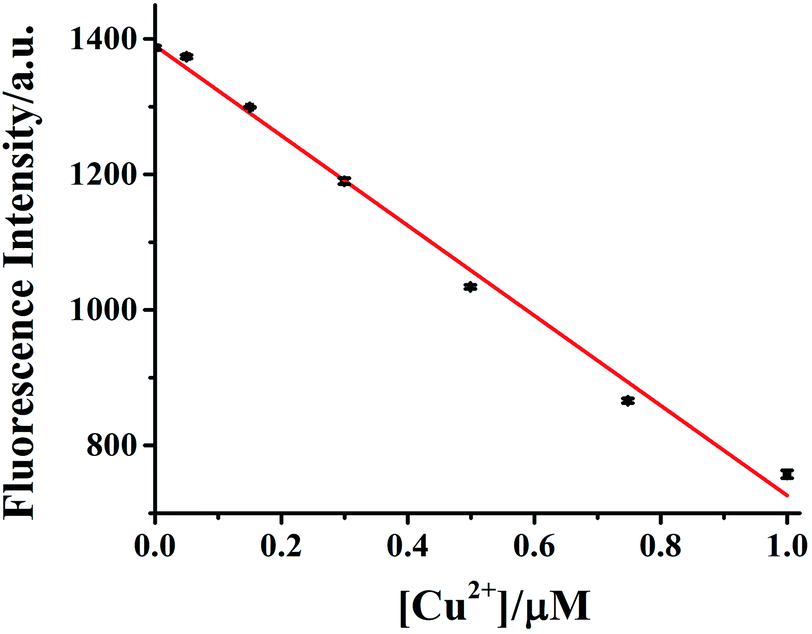 | ||
| Fig. 8 Calibration curve of 2 μM HDSGWEVHH for Cu2+ concentration determination. The linear regression yields y = −663.91[Cu2+] + 1390 (in μM). A HEPES (10 mM, pH 7.4) buffer was used. The error bars were computed from at least three replicates. | ||
Copper determination in real samples
To gauge the ability of HDSGWEVHH probe for real sample analyses, free Cu2+ concentrations released from MT were detected. And Cu2+ concentrations in different water and tea samples were also measured with HDSGWEVHH.MTs are vital for essential metal (e.g. Cu) regulation and heavy metal detoxification in human body. MTs bind tightly with Cu via the thiolate groups of their abundant cysteine residues (∼30% of the total amino acid residues), thereby forming thiolate–Cu+ clusters at natural pH.67
Free Cu2+ concentrations released from the MT–Cu complex at different pH were measured with HDSGWEVHH. As shown in Table 2, at neutral pH, Cu is bound to MT tightly, and no free Cu2+ was detected by HDSGWEVHH. When the pH was adjusted to 0.5, Cu+ was released from the MT–Cu complex and quickly oxidized by O2 in solution to Cu2+. As shown in Table 2 (pH 0.5), free Cu2+ concentration was determined to be 1.00 μM by HDSGWEVHH probe. It indicated that at low pH, Cu+ bound by MT is completely released, which is consistent with other reports.21,68
| pH | 7.4 | 6.0 | 0.5 |
| [Cu2+]/μM | 0.00 | 0.00 | 1.00 ± 0.01 |
The concentrations of Cu2+ in tap water, water in Xiangjiang river and tea were determined as 0.137 mg kg−1, 0.515 mg kg−1, and 15.730 mg kg−1 (Table 3), which were consistent with the concentrations evaluated with AAS, suggesting that the method used in this study was accurate and could be straightforwardly implemented for the assay of free Cu2+ in water and food samples.
| Sample | Cu2+ determined (mg kg−1) | |
|---|---|---|
| AAS | HDSGWEVHH | |
| Tap water | 0.136 ± 0.001 | 0.137 ± 0.002 |
| Xiangjiang river water | 0.512 ± 0.002 | 0.515 ± 0.001 |
| Tea | 15.600 ± 0.007 | 15.730 ± 0.008 |
Sulfide determination by HDSGWEVHH–Cu2+ complex
As shown in Fig. 9, the fluorescence intensity of HDSGWEVHH–Cu2+ mixture increases with the S2− concentration. Owing to the much higher binding affinity of Cu2+ to S2− (Ka = 1.6 × 1037 M−1)55 than to HDSGWEVHH (1.72 × 10⁸ M−1), S2− can deprive Cu2+ from the HDSGWEVHH–Cu2+ complex, and release the HDSGWEVHH into solution, which results in the fluorescence recovery. The results indicated that the HDSGWEVHH–Cu2+ complex could be considered as the determination probe for S2−. Owing to the fast precipitation reaction rate, the fluorescence intensity in HDSGWEVHH–Cu2+ solution was recovered immediately with the addition of S2−. While, some organic fluorescent probes (e.g. benzopyran derivative compounds) for S2− detection need a long reaction time (30–60 minutes) to get the changes of fluorescence.26,47,69 | ||
| Fig. 9 Fluorescence spectra of 2 μM HDSGWEVHH (a) and 2 μM HDSGWEVHH/1 μM Cu2+ mixture in the absence (d) and presence of 0.30 (c) and 0.85 μM (b) S2−. All the spectra was obtained in 10 mM HEPES buffer (pH 7.4). | ||
Selectivity and fluorescence response of HDSGWEVHH–Cu2+ complex to sulfide
The selectivity of HDSGWEVHH–Cu2+ complex to S2− with respect to common anions (Fig. 10) was investigated. The HDSGWEVHH–Cu2+ complex displayed a remarkable selectivity to S2−. When S2− was added to the HDSGWEVHH–Cu2+ solution, the HDSGWEVHH fluorescence was quantitatively recovered. The fluorescence intensity of the HDSGWEVHH–Cu2+/S2−solution was around 1220, which is around 1.6 times than that of HDSGWEVHH–Cu2+ solution. However, the fluorescence intensity of other anions solutions was similar with that of HDSGWEVHH–Cu2+ solution. Notice that the selectivity was not affected by other sulfur-containing anions such as S2O32−, SO42−, SO32−, and HSO3−.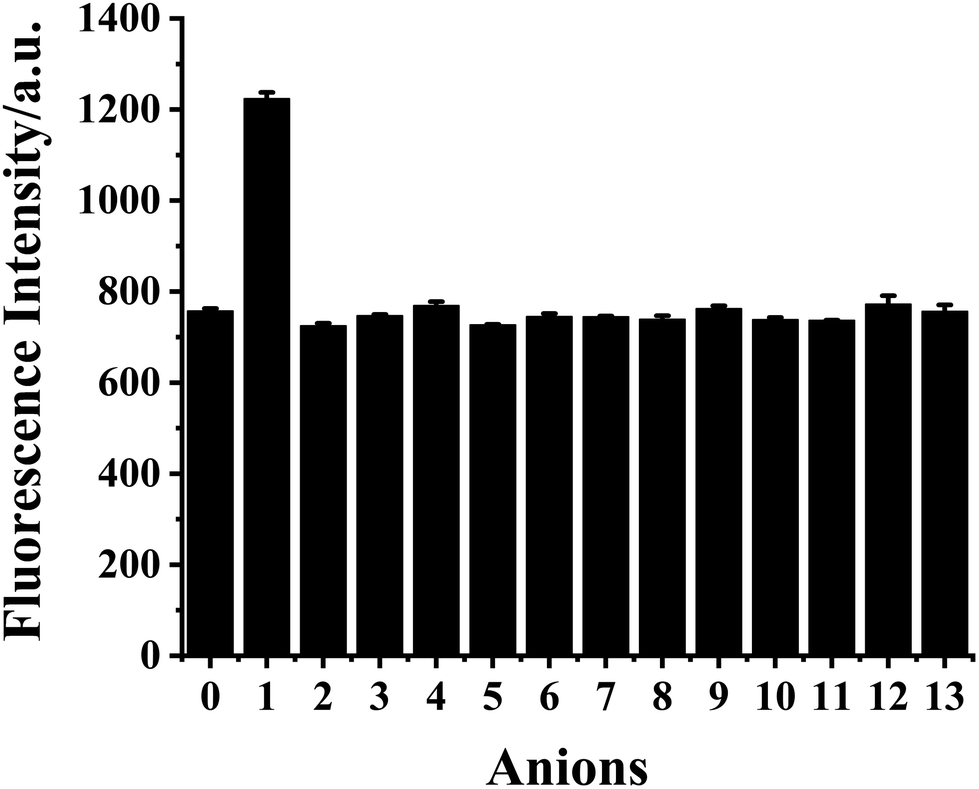 | ||
| Fig. 10 Fluorescence intensity of HDSGWEVHH (2 μM)–Cu2+ (1 μM) complex solution in the absence of anions (0) and in the presence of S2− (1), S2O32− (2), SO42− (3), SO32− (4), HSO3− (5), PO43− (6), HCO3− (7), NO2− (8), OAc− (9), F− (10), Cl− (11), Br− (12), and I− (13). The concentration of anions was 2 μM. The relative standard deviations, shown as error bars, vary from 0.76 to 13.28%. | ||
The dependence of fluorescent changes of HDSGWEVHH–Cu2+ on S2− concentrations was monitored. As shown in Fig. 11, a linear calibration curve was obtained within 50 nM to 1.0 μM of S2− (R2 = 0.9933). When the S2− concentration is higher than that of Cu2+, the plot was found to reach a plateau (data not shown). The plateau suggests that all of the Cu2+ bound by HDSGWEVHH can be extracted by S2− to precipitate as CuS. But there was also little peptide was precipitated with the ions, which resulted in the little decrease of the fluorescence intensity of HDSGWEVHH. The detection limit (3σ/m) of the method for S2− in buffer was estimated to be 19 nM, which was much lower than the maximum allowable level of S2− (15 μM) in drinking water set by the WHO.15
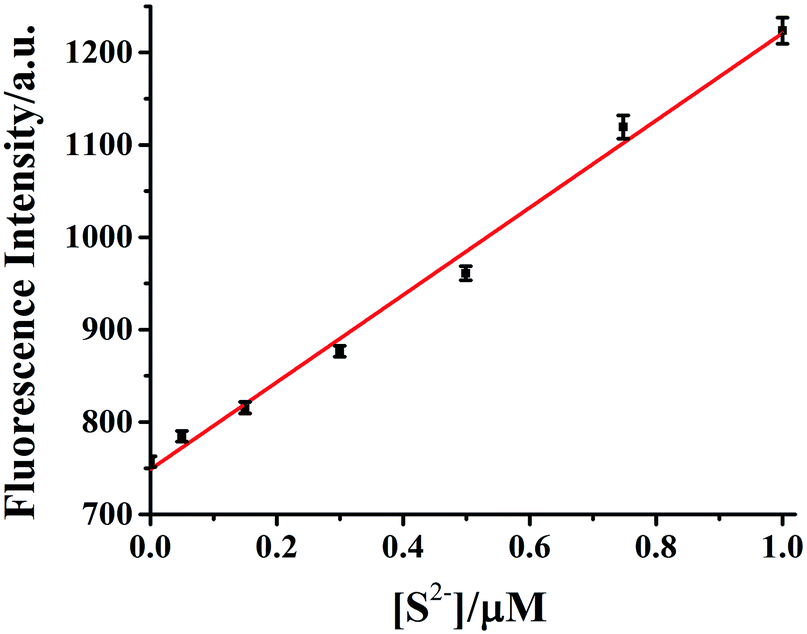 | ||
| Fig. 11 Calibration curve of HDSGWEVHH (2 μM)–Cu2+ (1 μM) for S2− concentration determination. A HEPES (10 mM, pH 7.4) buffer was used and the linear regression yields signal = 748.06 + 472.17 [H2S] (in μM). The error bars were computed from at least three replicates. | ||
Sulfide determination in real water samples
To gauge the ability of HDSGWEVHH–Cu2+ probe for real sample analyses, concentration of S2− in water sample was measured with HDSGWEVHH. The concentrations of S2− in water was determined as 3.3 μM, which was consistent with other reports,70,71 suggesting that the method used in this study was accurate and could be straightforwardly implemented for the S2− concentration determination in water samples.Conclusions
A mutant amyloid peptide, HDSGWEVHH, has been demonstrated as a highly sensitive and selective fluorescent probe to free Cu2+ and S2− present in food and aqueous samples. The concentration of Cu2+ can be detected by monitoring the decreases in the fluorescence intensity of HDSGWEVHH, which were owing to the high affinity (Kb = 1.72 × 10 8 M−1) of the mutant peptide via binding of Cu2+ through the histidine residues. The method is highly sensitive and selective with a detection limit of 16 nM for Cu2+. In addition, the generated HDSGWEVHH–Cu2+ complex ensemble can serve as a S2− sensor because of the quenched fluorescence could be recovered with S2− addition. The recovery of fluorescence intensity was due to the CuS formation, which resulted in HDSGWEVHH released from HDSGWEVHH–Cu2+ complex. With the fluorescence recovery, the S2− concentrations measured with a detection limit of 19 nM. Meanwhile, concentrations of Cu2+ released from MT–Cu complex, concentrations of Cu2+ in food samples and S2− in the real water sample were detected with the HDSGWEVHH probe. Our results demonstrated that peptide based fluorescent probe can serve as a label free, easily synthesized, non-cytotoxicity fluorescence probe for facile and sensitive analyses of Cu2+ and S2− in food and aqueous samples.Conflicts of interest
There are no conflicts to declare.Acknowledgements
This work was supported by the National Natural Science Foundation of China (No. 81501619, 31972173), a program for Science and Technology of Education Department of Hunan Province (20B620), Hunan key research and development plan project (2020NK2020), a program from Hunan Provincial Key Laboratory of Food Safety Monitoring and Early Warning (No. 2020KFJJ03), a program for Science and Technology of Changsha, China (kq1907096), a program for Science & Technology Innovation Platform/Talents of Hunan Province (2019TP1029, 2018XK2006), a program for Science &Technology Innovation Talents of Hunan Province (2017TP1021), a Natural Science Foundation of Hunan Province of China (No. 2018JJ3300), and the project of Chang-Zhu-Tan National Independent Innovation Demonstration Zone (2018XK2007).Notes and references
- A. Pal, Neurotoxicology, 2014, 40, 97–101 CrossRef CAS.
- E. Gaggelli, H. Kozlowski, D. Valensin and G. Valensin, Chem. Rev., 2006, 106, 1995–2044 CrossRef CAS.
- S. Qiu, Y. Wei, T. Tu, J. Xiang, D. Zhang, Q. Chen, L. Luo and Z. Lin, Food Chem., 2020, 317, 126434 CrossRef CAS.
- F. Qin and W. Chen, Bull. Environ. Contam. Toxicol., 2007, 79, 247–250 CrossRef CAS.
- E. Culotta and D. E. Koshland Jr, Science, 1992, 258, 1862–1865 CrossRef CAS.
- W. Zhao, J. Zhang, Y. Lu and R. Wang, EMBO J., 2001, 20, 6008–6016 CrossRef CAS.
- J. W. Elrod, J. W. Calvert, J. Morrison, J. E. Doeller, D. W. Kraus, L. Tao, X. Jiao, R. Scalia, L. Kiss, C. Szabo, H. Kimura, C.-W. Chow and D. J. Lefer, Proc. Natl. Acad. Sci. U. S. A., 2007, 104, 15560–15565 CrossRef CAS.
- P. K. Moore, M. Bhatia and S. Moochhala, Trends Pharmacol. Sci., 2003, 24, 609–611 CrossRef CAS.
- S. Borah, B. P. Das, G. Konwar, S. P. Mahanta and N. Gogoi, RSC Adv., 2015, 5, 75187–75194 RSC.
- P. Kamoun, M.-C. Belardinelli, A. Chabli, K. Lallouchi and B. Chadefaux-Vekemans, Am. J. Med. Genet., Part A, 2003, 116, 310–311 CrossRef.
- K. Eto, T. Asada, K. Arima, T. Makifuchi and H. Kimura, Biochem. Biophys. Res. Commun., 2002, 293, 1485–1488 CrossRef CAS.
- D. J. Lefer, Br. J. Pharmacol., 2008, 155, 617–619 CrossRef CAS.
- S. Fiorucci, E. Antonelli, A. Mencarelli, S. Orlandi, B. Renga, G. Rizzo, E. Distrutti, V. Shah and A. Morelli, Hepatology, 2005, 42, 539–548 CrossRef CAS.
- F. Yu, P. Li, P. Song, B. Wang, J. Zhao and K. Han, Chem. Commun., 2012, 48, 2852–2854 RSC.
- H. Fang, P. C. Huang and F. Y. Wu, Spectrochim. Acta, Part A, 2018, 204, 568–575 CrossRef CAS.
- Y. Xin, Y. Gao, J. Guo, Q. Chen, J. Xiang and F. Zhou, Biosens. Bioelectron., 2008, 24, 369–375 CrossRef CAS.
- M. Dabrio, A. R. Rodriguez, G. Bordin, M. J. Bebianno, M. De Ley, I. Sestakova, M. Vasak and M. Nordberg, J. Inorg. Biochem., 2002, 88, 123–134 CrossRef CAS.
- S. S. Narula, D. R. Winge and I. M. Armitage, Biochemistry, 1993, 32, 6773–6787 CrossRef CAS.
- M. Beltramini and K. Lerch, Biochemistry, 1983, 22, 2043–2048 CrossRef CAS.
- R. Gulaboski, Electrochem. Commun., 2004, 6, 215–218 CrossRef CAS.
- L. Banci, I. Bertini, S. Ciofi-Baffoni, T. Kozyreva, K. Zovo and P. Palumaa, Nature, 2010, 465, 645–648 CrossRef CAS.
- W. Han, Z. Y. Li, M. Li, Y. Y. Gao, X. G. Yang, M. L. Zhang and Y. Sun, RSC Adv., 2018, 8, 8118–8129 RSC.
- H. J. Jang, T. G. Jo and C. Kim, RSC Adv., 2017, 7, 17650–17659 RSC.
- G. Dhaka, N. Kaur and J. Singh, J. Fluoresc., 2017, 27, 1943–1948 CrossRef CAS.
- G. K. Patra, R. Chandra, A. Ghorai and K. K. Shrivas, Inorg. Chim. Acta, 2017, 462, 315–322 CrossRef CAS.
- K. Sasakura, K. Hanaoka, N. Shibuya, Y. Mikami, Y. Kimura, T. Komatsu, T. Ueno, T. Terai, H. Kimura and T. Nagano, J. Am. Chem. Soc., 2011, 133, 18003–18005 CrossRef CAS.
- P. Wang, J. Wu, P. R. Su, C. Xu, Y. S. Ge, D. Liu, W. S. Liu and Y. Tang, Dalton Trans., 2016, 45, 16246–16254 RSC.
- P. Wang, L. Liu, P. Zhou, W. Wu, J. Wu, W. Liu and Y. Tang, Biosens. Bioelectron., 2015, 72, 80–86 CrossRef CAS.
- P. Wang, J. Wu, C. Di, R. Zhou, H. Zhang, P. Su, C. Xu, P. Zhou, Y. Ge, D. Liu, W. Liu and Y. Tang, Biosens. Bioelectron., 2017, 92, 602–609 CrossRef CAS.
- Y. Hao, W. Chen, L. Wang, X. Zhu, Y. Zhang, P. Qu, L. Liu, B. Zhou, Y. N. Liu and M. Xu, Talanta, 2015, 143, 307–314 CrossRef CAS.
- C. Hao, Y. Li, B. Fan, G. Zeng, D. Zhang, Z. Bian and J. Wu, Microchem. J., 2020, 154, 104658 CrossRef CAS.
- Y. Wang, X. H. Hao, L. X. Liang, L. Y. Gao, X. M. Ren, Y. G. Wu and H. C. Zhao, RSC Adv., 2020, 10, 6109–6113 RSC.
- T. Yang, F. Zhu, T. Zhou, J. Cao, Y. Xie, M. Zhang, Y. Wang, D. S. Cao, Q. Lin and L. Zhang, Anal. Sci., 2017, 33, 191–196 CrossRef CAS.
- C. J. Sarell, C. D. Syme, S. E. J. Rigby and J. H. Viles, Biochemistry, 2009, 48, 4388–4402 CrossRef CAS.
- J. H. Kagi and B. L. Valee, Biol. Chem., 1960, 235, 3460–3465 CAS.
- D. Jiang, L. Zhang, G. P. G. Grant, C. G. Dudzik, S. Chen, S. Patel, Y. Hao, G. L. Millhauser and F. Zhou, Biochemistry, 2013, 52, 547–556 CrossRef CAS.
- P. Sadler, H. Li and H. Sun, Chem. Rev., 1999, 185–186, 689–709 CAS.
- N. C. Maiti, D. Jiang, A. J. Wain, S. Patel, K. L. Dinh and F. Zhou, J. Phys. Chem. B, 2008, 112, 8406–8411 CrossRef CAS.
- L. Wang, W. W. Qin, X. L. Tang, W. Dou, W. S. Liu, Q. F. Teng and X. J. Yao, Org. Biomol. Chem., 2010, 8, 3751–3757 RSC.
- J. Shearer, P. E. Callan, T. Tran and V. A. Szalai, Chem. Commun., 2010, 46, 9137–9139 RSC.
- S. Parthasarathy, F. Long, Y. Miller, Y. L. Xiao, D. McElheny, K. Thurber, B. Y. Ma, R. Nussinov and Y. Ishii, J. Am. Chem. Soc., 2011, 133, 3390–3400 CrossRef CAS.
- P. Faller and C. Hureau, Dalton Trans., 2009, 7, 1080–1094 RSC.
- U. Kragh-Hansen, S. O. Brennan, L. Minchiotti and M. Galliano, Biochem. J., 1994, 301(Pt 1), 217–223 CrossRef CAS.
- P. Sengupta, K. Garai, B. Sahoo, Y. Shi, D. J. E. Callaway and S. Maiti, Biochemistry, 2003, 42, 10506–10513 CrossRef CAS.
- N. Lu, J. Li, R. Tian and Y.-Y. Peng, Chem. Res. Toxicol., 2015, 28, 365–372 Search PubMed.
- H. Peng, Y. Cheng, C. Dai, A. L. King, B. L. Predmore, D. J. Lefer and B. Wang, Angew. Chem., Int. Ed., 2011, 50, 9672–9675 CrossRef CAS.
- A. R. Lippert, E. J. New and C. J. Chang, J. Am. Chem. Soc., 2011, 133, 10078–10080 CrossRef CAS.
- Y. Zheng, K. M. Gattas-Asfura, V. Konka and R. M. Leblanc, Chem. Commun., 2002, 20, 2350–2351 RSC.
- Y. Zheng, X. Cao, J. Orbulescu, V. Konka, F. M. Andreopoulos, S. M. Pham and R. M. Leblanc, Anal. Chem., 2003, 75, 1706–1712 CrossRef CAS.
- G. Donadio, R. Di Martino, R. Oliva, L. Petraccone, P. Del Vecchio, B. Di Luccia, E. Ricca, R. Isticato, A. Di Donato and E. Notomista, J. Mater. Chem. B, 2016, 4, 6979–6988 RSC.
- X. Pang, L. Gao, H. Feng, X. Li, J. Kong and L. Li, New J. Chem., 2018, 42, 15770–15777 RSC.
- S.-P. Wu and S.-R. Liu, Sens. Actuators, B, 2009, 141, 187–191 CrossRef CAS.
- S. A. Kozin, S. Zirah, S. Rebuffat, G. H. Hoa and P. Debey, Biochem. Biophys. Res. Commun., 2001, 285, 959–964 CrossRef CAS.
- B. Elmas, S. Senel and A. Tuncel, React. Funct. Polym., 2007, 67, 87–96 CrossRef CAS.
- T. Kato, S. Nakamura and M. Morita, Anal. Sci., 1990, 6, 623–626 CrossRef CAS.
- R. Das, S. P. Bharati, A. Borborah, P. J. Sarma, B. Das, S. Choudhury, G. Chakrabarty and S. P. Mahanta, New J. Chem., 2018, 42, 3758–3764 RSC.
- A. J. Bard and L. R. Faulkner, Electrochemical methods:fundamentals and applications, John Wiley & Sons, Inc, New York, 2001 Search PubMed.
- L. Liu, D. Jiang, A. McDonald, Y. Hao, G. L. Millhauser and F. Zhou, J. Am. Chem. Soc., 2011, 133, 12229–12237 CrossRef CAS.
- M. Murariu, L. Habasescu, C. I. Ciobanu, R. V. Gradinaru, A. Pui, G. Drochioiu and I. Mangalagiu, Int. J. Pept. Res. Ther., 2018, 25, 897–909 CrossRef.
- C. D. Syme and J. H. Viles, Biochim. Biophys. Acta, 2006, 1764, 246–256 CrossRef CAS.
- S. P. Mahanta, R. Das, P. J. Sarma, A. Borborah and S. P. Bharati, New J. Chem., 2019, 43, 3447–3453 RSC.
- P. L. H. W. B. Tolman, J. Am. Chem. Soc., 1999, 121, 7270–7271 CrossRef.
- P. L. H. W. B. Tolman, J. Am. Chem. Soc., 2000, 122, 6331–6332 CrossRef.
- S. Saito, K. Furukawa and A. Osuka, Angew. Chem., Int. Ed., 2009, 48, 8086–8089 CrossRef CAS.
- P. J. Chmielewski, Angew. Chem., Int. Ed., 2010, 49, 1359–1361 CrossRef CAS.
- D. Jiang, L. Men, J. Wang, Y. Zhang, S. Chickenyen, Y. Wang and F. Zhou, Biochemistry, 2007, 46, 9270–9282 CrossRef CAS.
- A. K. Boal and A. C. Rosenzweig, Chem. Rev., 2009, 109, 4760–4779 CrossRef CAS.
- L. A. Finney and T. V. O'Halloran, Science, 2003, 300, 931–936 CrossRef CAS.
- F. Hou, L. Huang, P. Xi, J. Cheng, X. Zhao, G. Xie, Y. Shi, F. Cheng, X. Yao, D. Bai and Z. Zeng, Inorg. Chem., 2012, 51, 2454–2460 CrossRef CAS.
- K.-H. Leung, V. P.-Y. Ma, H.-Z. He, D. S.-H. Chan, H. Yang, C.-H. Leung and D.-L. Ma, RSC Adv., 2012, 2, 8273 RSC.
- E. M. Abdel-Rahman, O. Mutanga, J. Odindi, E. Adam, A. Odindo and R. Ismail, Comput. Electron. Agr., 2017, 132, 21–33 CrossRef.
Footnote |
| † Electronic supplementary information (ESI) available. See DOI: 10.1039/d0ra08788b |
| This journal is © The Royal Society of Chemistry 2021 |