DOI:
10.1039/D0RA08766A
(Paper)
RSC Adv., 2021,
11, 662-670
Facile synthesis of Tb-decorated graphene oxide: electrochemical stability, hydrogen storage, and corrosion inhibition of Mg AZ13 alloy in 3.5% NaCl medium†
Received
15th October 2020
, Accepted 9th December 2020
First published on 24th December 2020
Abstract
Magnesium alloys have been broadly used due to their lightweight and high ductility. However, they are subject to corrosion which deteriorates their properties. To develop a novel corrosion inhibitor coating for Mg alloys, we performed functionalization of a graphene oxide (GO) matrix with Tb(III) to improve the electrochemical behaviour and coating stability of a GO and Tb composite on the metal alloys in corrosive medium. The functionalized terbium GO material was characterized by microscopy, spectroscopy, and XRD techniques to confirm the non-covalent interactions on the active surface of the host material. The corrosion inhibition was found to be ca. 80% and electrochemical stability was observed to be high at a voltage of 900 mV. Computational studies also support the potential anti-corrosion applications of this material.
1. Introduction
Magnesium alloys are extensively used in industries owing to their prominent properties such as light weight and high ductility. However, they are subject to corrosion which deteriorates their properties. Therefore, the design and preparation of a superior corrosion protection coating is still a research challenge and is essential for large-scale practical applications. Numerous studies focusing on anti-corrosion coating of metals and alloys have been reported. In 2008, Mohwald, Shchukin and co-workers carried out a study which employed a silica–zirconia based hybrid film as an anti-corrosion coating deposited on 2024 aluminum alloy.1 In this work, silica nanoparticles covered with layers of polyelectrolyte and inhibitor (benzotriazole) were randomly introduced into the hybrid films. The hybrid films containing the nanocontainers were found to enhance long-term corrosion protection in comparison with the undoped hybrid film. In 2014, Matad et al. evaluated ketosulfone as a green corrosion inhibitor for mild steel in 1 M HCl medium by chemical and electrochemical methods along with quantum chemical calculations.2 It was shown that the inhibition efficiency of ketosulfone increased with an increase in its concentration and with increasing temperatures up to 313 K. Adsorption of the inhibitor on steel surface was shown predominately due to chemisorption and was proven to be spontaneous and strong.
In 2000, Heeg and Klenerman using in situ spectroscopic studies of model corrosion inhibitors showed that methylene blue (MB) is chemisorbed via an intermediate sulfur layer onto the nickel and carbon steel substrates and reported that the removal of MB film did not occur under shear conditions, but rather by the cavitating jet of liquid from the Ni electrode.3 In 2015, Faustin et al. studied the corrosion inhibition by the alkaloids extract (AE) from Geissospermum laeve on C38 steel in 1 M HCl.4 An inhibition efficiency of 92% was reached with 100 mg L−1 of AE at 25 °C. Potentiodynamic polarization showed that the extract behaves as a mixed-type inhibitor. Ren et al. in 2008 tested the corrosion inhibition properties of the terpolymer obtained by grafting copolymerization of both dimethyl diallyl ammonium chloride (DMDAAC) and acrylamide (AM) onto lignin for mild steel.5 The results exhibited the highest corrosion inhibition, over 95% in 10% HCl medium at 25 °C and 80 °C. Synergistic corrosion inhibition was promoted by the Graft's reaction among lignin, AM and DMDAAC. Alkhathlan et al. in 2015 screened for the first time the anticorrosive properties of various extracts (methanolic, aqueous methanolic and water) of Anthemis pseudocotula for mild steel in 1.0 M HCl medium.6 Among the various tested extracts, the methanolic extract of A. pseudocotula was shown to possess the highest corrosion inhibition activity. Roos and co-workers in 2011 investigated the inhibition effect of alkaloids extract from Oxandra asbeckii plant (OAPE) on the corrosion of C38 steel in 1 M HCl solution by potentiodynamic polarization and electrochemical impedance spectroscopy.7 The corrosion inhibition efficiency was found to increase on increasing the concentration of plant extracts. OAPE was found to be a mixed-type inhibitor through cathodic and anodic polarization studies. Also in 2011, Tan and Kassim studied the correlation of the composition of phenolics and corrosion inhibition properties of Rhizophora apiculata bark extracts as affected by nine different solvent systems.8 The authors investigated the inhibitive actions of tannin extracts on mild steel in 1 M HCl solution using potentiodynamic polarization and electrochemical impedance spectroscopy. Oguzie considered the corrosion inhibition of mild steel in 2 M HCl and 1 M H2SO4 using the extracts of selected plants by employing a gasometric technique at 30 °C and 60 °C.9 All the extracts were found to inhibit the corrosion process in both acid medium due to adsorption and inhibition efficiency increased with an increase in the concentration of the extract. The observed results suggested both protonated and molecular species to be responsible for the inhibiting action of the extract.
Recently, graphene oxide (GO) is receiving significant attention as a component of corrosion inhibition/protection composites. In 2017 Zhang, Yang and co-workers reported GO-based sulfonated oligoanilines coatings for marine corrosion protection application.10 3-Aminobenzenesulfonic acid was selected to combine with oligoanilines to fabricate the composite coatings which were covered on the surface of Q235 steel. Different bonds and functional groups of aniline trimer and sulfonated aniline trimer (SAT) were found in the composites. The results of electrochemical measurements performed in 3.5 wt% NaCl solution showed excellent corrosion-protective properties of GO/SAT-coated epoxy resin at a dosage of 10 mg of GO as compared with the pure epoxy resin. The corrosion-protective properties of the modified coatings were shown to improve significantly due to the enhanced corrosion protection of GO and SAT synergistically. Later, Luo et al. reported the fabrication and characterization of a novel cationic reduced graphene oxide (RGO-ID+)-based epoxy coating for corrosion protection.11 RGO-ID+ was obtained by in situ synthesis and salification reaction. The self-aligned RGO-ID+-reinforced epoxy nanocomposite coating (RGO-ID+ coating) at the metal surface was obtained by electrodeposition. The significantly enhanced anti-corrosion performance of RGO-ID+ coating was proved by a series of electrochemical measurements in different concentrated NaCl solutions and salt spray tests. This superior anti-corrosion characteristic was shown to benefit from the self-aligned RGO-ID+ nanosheets and quaternary-N groups in the RGO-ID+ nanocomposite. In 2019, Palaniappan et al. reported a combined experimental and computational study of graphene oxide covalently functionalized with the amino acid leucine as an anti-corrosion coating material for the Mg alloy AZ13.12 The functionalized GO–leucine was characterized by several spectroscopic methods as well as studied using density functional theory (DFT) calculations. The corrosion inhibition efficiency monitored by the electrochemical methods revealed that leucine functionalized GO acts as an excellent barrier layer in salt environments. The functionalized GO sheet was also shown to slow down the anodic and cathodic reaction. Recently, Palaniappan, Cole, and Kuznetsov designed octylamine-functionalized GO materials for energy harvesting and as anti-corrosion coating for the protection of Mg AZ13 alloy in 3.5 wt% NaCl medium.13 The electrochemical stability and corrosion inhibition efficiency of the material were studied by the electrochemical methods. The electrochemical stability was found to increase with an increase in the applied voltage up to 500 mV, and the corrosion inhibition efficiency was shown to be 73%. The coating exhibited long stability in the corrosion medium. Yanfei and co-authors investigated the exfoliation of graphite powder by ball milling technique using ionic liquids as green solvents and observed an increase in ionic conductivities.14
This current study aims to enhance the coating stability and increase the corrosion resistance of composite material on the surface of magnesium alloy. For this, Tb-modified GO composite was designed and studied as a corrosion inhibition barrier layer on the Mg alloy AZ13 in the presence of 3.5 wt% NaCl. The novelty of this study is that the GO composite is a green corrosion inhibition barrier in 3.5 wt% NaCl medium.
2. Materials and methods
Natural graphite (98%), KMnO4 (98%), H2O2 (98%), and Tb(III) nitrate (98%) were purchased from Sigma Aldrich. Graphene oxide was obtained by the modified Hummer's method. Briefly, 2 g of graphite powder was placed into 250 ml round bottom (RB) flask and a mixture of 40 ml H2SO4 and 60 ml H3PO4 was then added to the flask. RB was kept in the ice bath, and then slowly 3 mg of KMnO4 was added. Further, the mixture was kept at 60 °C and refluxed for 12 h and then cooled down to room temperature. Following this, the reaction mixture was poured into 1 litre of ice water, and 30 ml H2O2 was added to stop the reaction. The mixture was centrifuged at 7000 rpm, washed with deionized water until neutral, and then treated with 1 M HCl solution to remove the unreacted products from the solution. The final wash was carried out using ethanol and deionized water. The black colloid was dried at 80 °C for 24 h. 100 mg Tb-functionalized GO was dispersed in deionized water, and then 5 ml 1 M NaOH solution was added. This reaction mixture was stirred continuously for 24 h at 60 °C. Then, it was centrifuged at 7000 rpm to remove the unreacted starting materials. The final composite material was washed with ethanol and deionized water and dried at 80 °C for 24 h.
2.1. Characterization
The functional groups of GO and GO + Tb composite material were confirmed by Spectrum 65 FT-IR using the KBr pellet method, and the crystallinity of the composite material was studied by XRD powder D8 Advance Bruker. Further, the carbonaceous composite materials were studied by vibrational Raman spectroscopy using 532 nm laser and WITec microscope. Microstructures were studied by FESEM (3.0 keV Carl Zeiss microscope equipped with EDX), and TEM (FEI Model Tecnai G2S Twin, 200 kV). Also, the electrochemical studies were carried out using CHI SECM 920D. Further, the wettability of the coated alloy surface was studied before and after immersing in the corrosion medium, and the hydrophobicity of coated alloy surface by the composite material was studied by OCA 15 EC Data Physics.
2.2. Corrosion studies
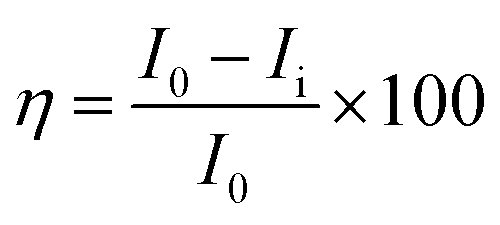
Mg alloy was polished using sandpapers of different sizes from 500 to 1200 and cleaned for 1 h using sonication to remove any of the attached fine particles. Then, the alloy was mounted on one side with cold cure material. Then, the prepared alloys were coated with Tb-decorated graphene oxide and epoxy resin using a brush method with a brush size of 2-microns. The coated alloys were dried under sunlight for 24 h and were used as the working electrode. The counter electrode was a platinum wire with a size of 2 mm, and the reference electrode was Ag/AgCl. The epoxy and GO + Tb coated Mg alloys were immersed in 3.5 wt% NaCl medium for 5 days, and then their corrosion inhibition efficiency was studied. Before subjecting to electrochemical studies, the corrosion system was allowed to stabilize for 10 min. Then, the applied voltage was from OCP ± 250 mV, and the scan rate was 10 mV s−1. The corrosion inhibition efficiency was evaluated by using the following eqn (1).| |
 | (1) |
where I0 and Ii represent corrosion current in epoxy and GO + Tb coated magnesium alloys. Electrochemical stabilities and AC voltammetry were carried out for Tb + GO composite materials. For this, by sonication, 5 mg of GO + Tb composite material was dispersed in 10 ml of an aqueous electrolyte (3 M H2SO4) for 2 h. 5 mg of GO + Tb colloid was used for studying the electrochemical stability. A platinum disk electrode of 2 mm size as the working electrode, Ag/AgCl2 (saturated KCl) as the reference electrode and platinum wire as an auxiliary electrode were used. Cyclic voltammetry was performed at different applied voltages from 2 mV to 700 mV at the scan rates of 10 mV s−1 to examine the high stability of composite materials. LSV (Linear Sweep Voltammetry) was studied at an applied voltage of 400 mV at different scan rates to observe the maximum hydrogen evolution. To find out the maximum hydrogen evolution, Tafel studies were also made at an applied voltage of ± 10 mV and the scan rates of 10 mV s−1. Impedance spectrum was carried out from 10 mHz to 100 MHz. AC voltammetry was conducted at different applied voltages from 1 mV to 90 mV at the scan rates of 10 mV s−1. Chronopotentiometry was performed at an applied voltage of ± 100 mV at the scan rates of 10 mV s−1 and was performed for 20 cycles to find out the maximum stability.
2.3. Computational study
For the computational study, C44H16O6–OTbCl Tb-modified GO with two –CO2H groups, two –OH groups, one ![[double bond, length as m-dash]](https://www.rsc.org/images/entities/char_e001.gif) O group, with one TbCl3-group attached to the surface of graphene oxide through the O-linkage was used as a model. Also, to take into account the effects of the corrosive acidic medium, the same model with the proton attached to the O-linkage was used. The computational studies were performed using the Gaussian 09 software (revision B.01).15 Calculations were made using the hybrid functional by Truhlar and Zhao M062X16 and combined basis set: SDD including Stuttgart/Dresden ECPs (effective core potentials) for Tb,17,18 and full-electron split-valence polarized basis set 6-31G* for all other atoms.19,20 We optimized the structures, calculated frequencies, and performed molecular orbital (MO) and natural bond orbital (NBO) analysis of our models with implicit effects from water were taken into account (dielectric constant, ε = 78.3553) through employing the self-consistent reaction field EF-PCM method21 (the UFF default model used in the Gaussian 09 package, with the electrostatic scaling factor α set to 1.0). For the global reactivity analysis, the electrophilicity χ, global hardness η, global softness σ, and nucleophilicity ω values were calculated based on the following eqn (2)–(6).
O group, with one TbCl3-group attached to the surface of graphene oxide through the O-linkage was used as a model. Also, to take into account the effects of the corrosive acidic medium, the same model with the proton attached to the O-linkage was used. The computational studies were performed using the Gaussian 09 software (revision B.01).15 Calculations were made using the hybrid functional by Truhlar and Zhao M062X16 and combined basis set: SDD including Stuttgart/Dresden ECPs (effective core potentials) for Tb,17,18 and full-electron split-valence polarized basis set 6-31G* for all other atoms.19,20 We optimized the structures, calculated frequencies, and performed molecular orbital (MO) and natural bond orbital (NBO) analysis of our models with implicit effects from water were taken into account (dielectric constant, ε = 78.3553) through employing the self-consistent reaction field EF-PCM method21 (the UFF default model used in the Gaussian 09 package, with the electrostatic scaling factor α set to 1.0). For the global reactivity analysis, the electrophilicity χ, global hardness η, global softness σ, and nucleophilicity ω values were calculated based on the following eqn (2)–(6).| |
 | (2) |
| |
 | (3) |
| |
 | (4) |
| |
 | (5) |
| |
 | (6) |
3. Results and discussion
3.1. Spectroscopy and XRD studies
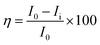
Fig. 1 shows the FTIR and Raman data on GO and Tb–GO composite coatings. As shown in Fig. 1a, the peak at 3500 cm−1 is attributed to the O–H stretching frequency. The stretching frequency at 2200 cm−1 is associated with the CC bond vibration. The peak at 1700 cm−1 is connected to the carbonyl group vibration. Further, the peak at 1530 cm−1 is related to the C–C bond vibration. In Fig. 1b, a new peak appearing at 2900 cm−1 is related to the C–H stretching vibration.22 Also, the vibration peaks of carbonyl group are reduced due to the coordination of terbium with the GO matrix. As shown in Fig. 1c for the Raman spectra of GO and Tb–GO, the peak at 1300 cm−1 is attributed to the sp2 carbons, and the peak at 1500 cm−1 is associated to the carbon defects in the graphene oxide sheets. The terbium functionalized graphene oxide sheet exhibited an additional peak as terbium is Raman active due to the bond vibration of Tb–GO. The peaks around 300 cm−1, 500 cm−1 and 1000 cm−1 are associated with the Raman active modes. XRD (Fig. 1d) indicates the crystallinity of the obtained GO and Tb–GO composite materials.23 For GO, 2Θ = 10–25° is associated with the characteristic peaks of GO, suggesting the crystalline nature of the GO surface. Further, for the Tb-GO composite materials, 2Θ = 30°, 35°, 50°, 60°, 61°, 70° and 80° are the characteristic peaks of Tb cubic phase.24,25
 |
| | Fig. 1 FTIR of terbium functionalized GO (A); FTIR of Tb–GO (B); Raman spectra of GO and Tb–GO composite (C); XRD of GO and Tb–GO (D). | |
3.2. Microscopy studies
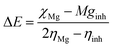
As shown in Fig. 2a, the GO facets have the dimension of about 1 micron. Further, it exhibits a single-layer GO sheet. Fig. 2b shows that nanographene oxide sheet is formed in a single layer with facets of around 200 nm. For the Tb-functionalized graphene oxide sheet, the interaction of terbium nanorods with the surface of GO could be observed. It is evident that terbium nanorods are crystalline, as demonstrated by the powder XRD and SID patterns previously.26,27 Further, Fig. 2d displays different shapes of terbium nanorods which are incorporated into the graphene oxide sheet by electrostatic forces.
 |
| | Fig. 2 GO and Tb-GO functionalized nanographene oxide sheets: FESEM images (A and B); TEM images of GO (C) and Tb-functionalized GO sheets (D). | |
3.3. Electrochemical stabilities
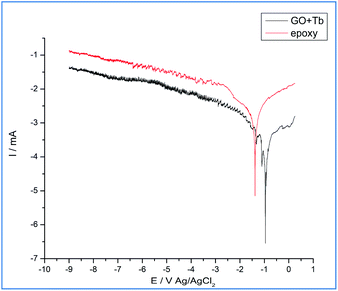
Fig. 3a illustrates the redox behaviour of terbium decorated graphene oxide with the applied voltages from 2 mV to 5 mV at a scan rate of 5 mV s−1. It is evident that the increased applied voltage led to an increase in the current, which may be associated with the presence of donor carboxylic anion moieties of graphene oxide. While it is also apparent that with an increased applied voltage, the redox peaks are increased which may be due to the exchange of electrons of carboxyl anions between terbium cations and GO carboxyl groups.28,29 Although the first reduction peak is increased, but the second reduction peak is decreased due to the exchange of electrons of epoxy ions between Tb3+ and also the non-bonding electrons of GO which is responsible for the intercalation of electrochemically active Tb3+. Hence, the mesomeric effect of epoxy ions could support stable redox behaviour. Therefore, the redox behaviour at the higher applied voltages, from 100 mV to 700 mV, was investigated. It is shown that with an increase in voltage, the current increased due to the electrochemically active Tb4+ reduced to Tb3+.30 At the applied voltage of 700 mV, a higher current peak appears due to the interaction of the edge hydroxyl group with active Tb3+.31–33 Therefore, the redox peak is increased due to the electron transfer of 4f-orbital since the d-orbitals are unfilled, electrons are available for the intercalation due to the increased current.
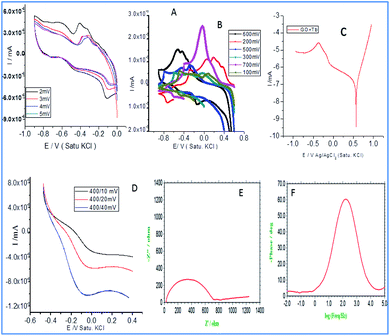 |
| | Fig. 3 Electrochemical studies of Tb-functionalized graphene oxide: (A and B) cyclic voltammetry (C) Tafel curve (D) linear sweep voltammetry (E) impedance Nyquist (F) impedance phase. | |
In Fig. 3c, Tafel curve shows both the oxygen and hydrogen evolutions. It indicates that in the region of 0.5 mV oxygen evolution occurs. Afterwards, it becomes constantly stable due to the inductive effect caused by electron delocalization in the carboxylate ions.34 The linear sweep voltammetry curves (Fig. 3d) indicate that hydrogen evolution occurs from 400 mV to 200 mV as the unfilled 4f orbital of Tb3+ facilitates the electron transfer from the host surface. The hydrogen evolution increases due to the sp2 π-bonds which share electrons with the empty orbitals. Further, as can be seen in Fig. 3e, the impedance Nyquist spectrum suggesting an increase in the imaginary phase, indicating the movement of electrons between the active functional groups of host GO and Tb3+. As shown in Fig. 3f, the impedance spectrum phase has also increased due to the electron exchange from Tb3+ to Tb4+. This confirms that host GO epoxy ions can accept electrons and donate them to guest molecules.
3.4. AC voltammetry studies
From Fig. 4a, it can be noted that the current increased with an increase in the applied potential due to the electrostatic interactions between Tb3+ cations and carboxylate ions. Also, the edge carboxylate ions enhance the stability of the structure due to weak hydrogen bonds. Further, the electron sharing of Tb 4f orbital with an unfilled 5d orbital leads to enhanced electrochemical stability.35–37 Also, the functional groups of graphene oxide and + mesomeric effect between epoxy non-bonding sp2 electrons and carboxylate ions lead to electron delocalization which could support increasing the electron current. In Fig. 4b, a decrease in the resistance with current could be seen which can be ascribed to the interactions of Tb3+ with edge hydroxyl groups (−I inductive effect) and +I inductive effect of OH groups. As shown in Fig. 4c, the current increased due to the intercalation of Tb4+cations between the empty cell from the p orbital of epoxy oxygen and the vacant cell from the f orbital of Tb4+ cations. As shown in Fig. 4d, chronopotentiometry of 10 cycles forward as well as backward leads to the structural stability of composite materials. Also, the adsorption and desorption of Tb3+ were increased on the electrode surface, indicating an increase in the rate of diffusion. Also, the rate of reduction of Tb4+ to Tb3+ increased due to an increase in stability.
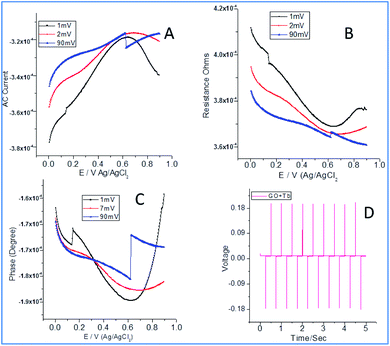 |
| | Fig. 4 Electrochemical studies of terbium decorated graphene oxide: AC voltammetry (A); resistance (B); phase current (C); chronopotentiometry (D). | |
3.5. Surface studies of magnesium alloy
As shown in Fig. 5, for the five days immersion of Tb–GO coated Mg alloy in 3.5 wt% NaCl solution, the propagation of corrosion seems to be stopped as the coating material acts as a barrier layer. The initiation of surface pitting was retarded by the effect of donation of non-bonding electrons of Tb–GO composite to Mg2+, and the elemental composition analysis results showed that oxygen concentration was higher as compared with the epoxy coated Mg alloy surface. Further, the concentrations of Zn and Al seem to be constant; this may be due to the composite material which does not allow the corrosive ions to the alloy surface because of the trapping of chlorides ions by Tb3+.
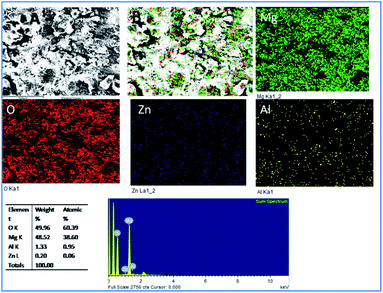 |
| | Fig. 5 Corrosion inhibition studies of Tb–GO coated Mg alloy after five days of immersion in 3.5 wt% NaCl. | |
Fig. 6 exhibits the epoxy-coated magnesium alloy after five days of immersion in 3.5 wt% NaCl medium, demonstrating a grain boundary attack by the corrosive chloride ions.36–38 Furthermore, pitting corrosion appears on the epoxy coating, where the pit size is about 5 μm due to the attacking of chloride ions onto the coating surface.
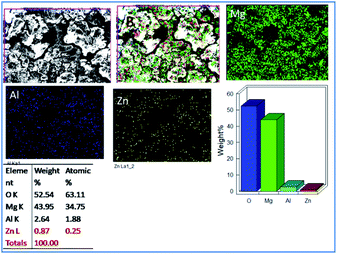 |
| | Fig. 6 Corrosion inhibition studies of epoxy coated Mg alloy after five days of immersion in 3.5 wt% NaCl. | |
Also, EDX mapping of Mg alloy suggests a higher percentage of Mg due to the weight loss because of the attack of chloride ions. Also, EDX results exhibit a higher concentration of oxygen as the corrosion reaction propagated by the attack of corrosive ion on the alloy.39–42 Hence, the concentrations of Zn and Al decreased as the alloy surface was attacked by the corrosive ions.
3.6. Coating wettability studies
Fig. 7A and B display the wettability of epoxy and GO + Tb coated surface before immersion. It exhibits that the wettability of the epoxy-coated surface is around 73° whereas for GO + Tb coated surface it is around 108°. Fig. 7C and D exhibit the surface wettability of epoxy and GO + Tb coated alloy after immersion. The epoxy-coated surface seems to be damaged due to the decreased wettability angle (57.1°). Hence, the chlorides may attack the surface as the surface hydrophobicity is low. Also, the surface hydrophobicity is reduced to ca. 57° due to the epoxy peeling off from the alloy.43,44 In the case of Tb–GO composite material, the surface hydrophobicity led to the wettability angle of 93.7° due to the formation of Tb–GO layer on the alloy surface (Fig. 7B). Further, a higher wettability angle supports the repulsion of the corrosive ions due to the self-healing of the coating surface.45
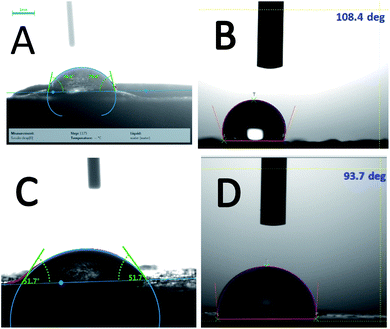 |
| | Fig. 7 Surface wettability of epoxy and GO + Tb coated alloy: (A and B) before immersion (C and D) after immersion. | |
3.7. Corrosion inhibition studies
As shown in Fig. 8, in the epoxy coated Mg alloy, the current density is increased, which leads to initiation of localized corrosion on the alloy surface due to the penetrating corrosive ions to the epoxy coated surface. Also, corrosion potential is decreased as the coating surface fails to prevent the movement of corrosive ions to the coated surface. The conventional epoxy coating does not contain strong acceptor functional groups and is also easy to peel out from the alloy surface due to which the grain boundary of epoxy coated Mg alloy was affected which in turn is due to the intergranular corrosion, as shown in the above surface studies of epoxy coated Mg alloy surface.46–51 However, Mg alloy coated by the Tb functionalized graphene oxide showed that the propagation of pitting corrosion stops due to the changes in the electron flow of Tb3+ between the alloy surface and electrolyte medium. Due to this, the corrosion current decreased and corrosion potential increased.52–57 Tb-GO coating was not possible to peel out from the alloy surface due to the strong acceptor and donor functional groups at the coating material surface58,59 and also the edge carboxylic resonance structure of graphene oxide could trap chlorides ions. The values of corrosion inhibition are shown in Table 1, and it can be concluded that the electrochemical studies support the surface studies.
 |
| | Fig. 8 Epoxy and Tb-GO coated Mg alloy corrosion inhibition studies after five days immersion in 3.5 wt% NaCl environment. | |
Table 1 Corrosion inhibition studies of epoxy and Tb–GO coated magnesium alloy after five days of immersion in 3.5 wt% NaCl
| Sample |
−Ecorr/mV |
−ICorr/mA |
% |
| Epoxy |
0.083 |
8.225 |
|
| Tb–GO |
−0.250 |
1.070 |
86.990 |
3.8. Computational studies
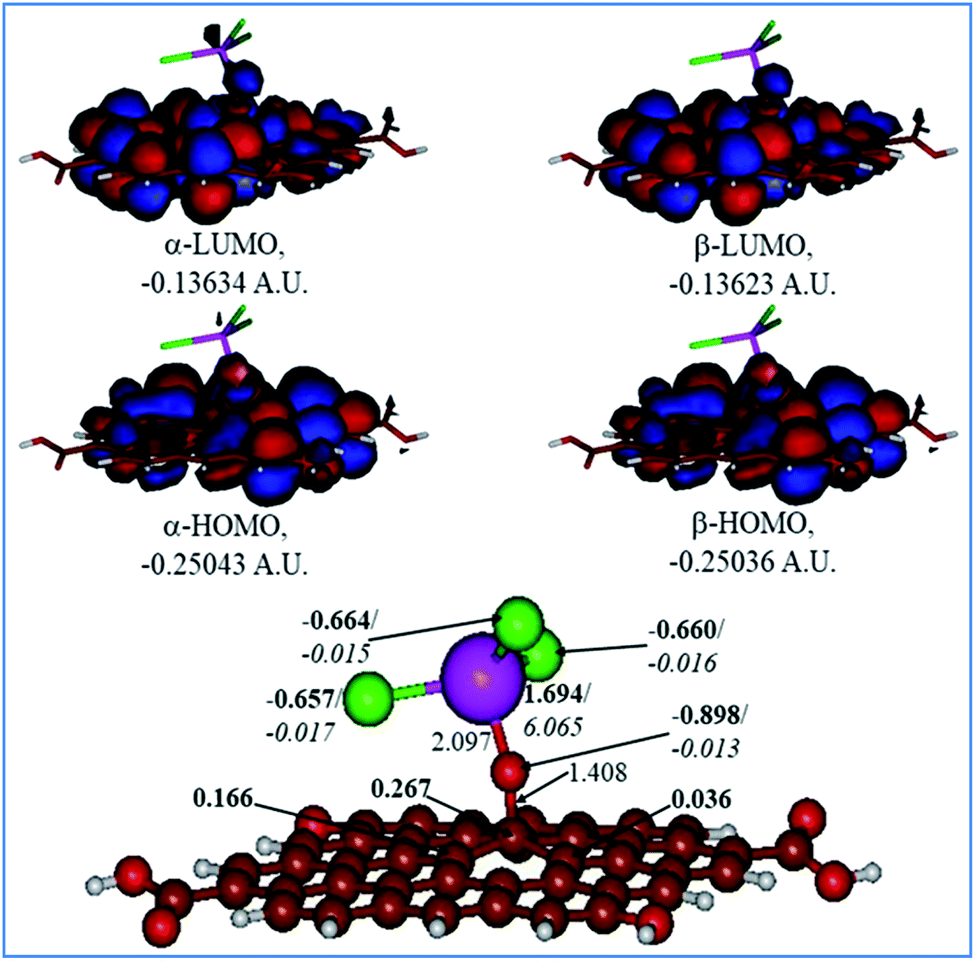
Fig. 9 and 10 show the H2O-optimized structures and frontier MOs of the neutral and protonated models for the Tb-decorated GO, respectively, along with the calculated NBO charges and spin densities (shown in bold and italics, respectively). It should be noticed that the septet structures were calculated to be the lowest in energy for both models (Table S1 in the ESI†). As can be seen in Fig. 9, the O–Tb bond distance is relatively long (2.097 Å), and the O–C (GO) bond distance is 1.408 Å. Also, the graphene oxide model monolayer near the O-linkage bound to the TbCl3 moiety becomes somewhat distorted upon optimization. Interestingly, the bond distances of Tb–Cl were calculated to be unequal, varying from 2.636 to 2.642 Å. The NBO analysis showed that the Tb-centre carries a quite significant positive charge (1.694e), and significant α-spin density (6.065e), accounting for most of the unpaired spin in the 7A neutral model. Significant negative charges (−0.657 to −0.664e), along with quite small amounts of β-spin density (−0.015 to −0.017e), were computed on the Cl-centres. Furthermore, on the O-centre connecting Tb to the GO surface, noticeable negative charge (−0.898e) was calculated along with the negligible amount of β-spin density (−0.013e). The accumulation of positive charge (0.267e) was found to occur on the C-centre connected to this oxygen as compared to the neighbouring carbons (Fig. 9). Furthermore, an analysis of the frontier MOs of this structure shows that in both α- and β-sets HOMOs/LUMOs are extremely close to each other in terms of energy as well as in their composition. Both α-and β-HOMOs are dominated by the contribution from GO, with some contribution of the O-linkage connecting TbCl3 to the GO, and with tiny, if any, the contribution from Tb. The same is true for the LUMOs.
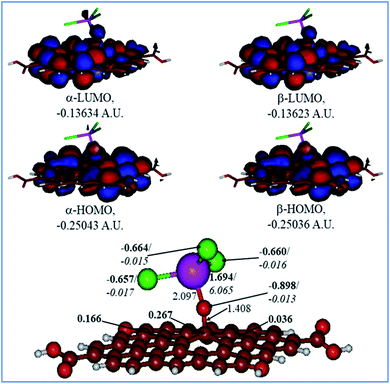 |
| | Fig. 9 Calculated structure (bottom row) and frontier MOs (top row) of the neutral GO model functionalized with TbCl3 group. Distances are given in Å. NBO charges are provided next to the atoms (in bold) along with spin densities (in italics). The colour code: brown for C, white for H, red for O, green for Cl, and lilac for Tb atoms. | |
A comparison of the results for the protonated GO model with the O(H+)TbCl3-group is shown in Fig. 10. The following could be noted from Fig. 10: (i) The O–Tb bond distance upon O protonation is elongated by 0.353 Å, and the bond distance of O–C(GO) is elongated by 0.077 Å. (ii) The TbCl3-group became rotated and bent as compared to the neutral model, and the valence angle of Tb–O–C(GO) is decreased by ca. 11.09°. (iii) The Tb–Cl bonds somewhat changed, too in the range of 2.591–2.643 Å. (iv) The charge on the Tb-centre increased by ca. 0.17e, although the spin density remains the same. (v) The charge on the protonated O-linkage became less negative by 0.095e, and the spin density on it became even lower. (vi) The charge on the C(GO) to which the O(H+)TbCl3-group is connected is changed very slightly, by 0.004e. Still, on the neighbouring carbons, the charge distribution became different from the neutral model: even negative charges appear on them. (vii) Charges on the Cl-centres vary broader than in the neutral model, from −0.638 to −0.668e, but the spin densities essentially did not change.
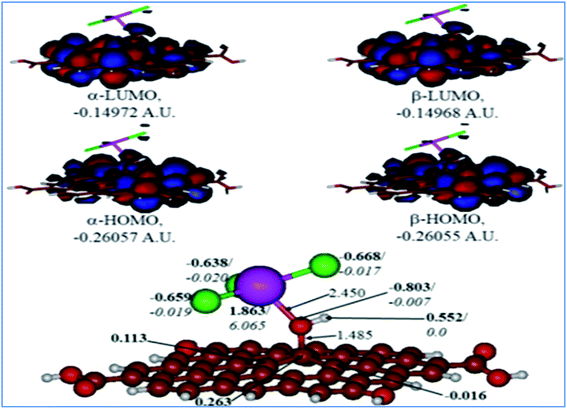 |
| | Fig. 10 Calculated structure (bottom row) and frontier MOs (top row) of the protonated GO model functionalized with TbCl3 group. Distances are given in Å. NBO charges are provided next to the atoms (in bold) along with spin densities (in italics). The colour code: brown for C, white for H, red for O, green for Cl, and lilac for Tb atoms. | |
Analysis of the MOs of both systems results in the following conclusions. (i) Composition of the MOs for both systems is essentially the same. (ii) The HOMO–LUMO gaps for both systems were calculated to be relatively small, ca. 0.11 a.u. (Table 2). or ca. 3 eV (TDDFT gaps: 1.50 and 1.53 eV for the neutral and protonated structures, respectively). (iii) The computed global hardness η.
Table 2 Global reactivity parameters computed for the Tb-decorated GO with implicit effects from water, neutral and protonated models. Values in a.u. A = α-HOMO & LUMO, B = β-HOMO & LUMO
| |
HOMO |
LUMO |
ΔE |
I |
A |
χ |
η |
σ |
ω |
| Neutral |
| A |
−0.25043 |
−0.13634 |
0.11409 |
0.25043 |
0.13634 |
0.193385 |
0.05705 |
17.5285 |
0.32776 |
| B |
−0.25036 |
−0.13623 |
0.11413 |
0.25036 |
0.13623 |
0.193295 |
0.05707 |
17.5223 |
0.32734 |
![[thin space (1/6-em)]](https://www.rsc.org/images/entities/char_2009.gif) |
| Protonated |
| A |
−0.26057 |
−0.14972 |
0.11085 |
0.26057 |
0.14972 |
0.205145 |
0.05543 |
18.0408 |
0.37962 |
| B |
−0.26055 |
−0.14968 |
0.11087 |
0.26055 |
0.14968 |
0.205115 |
0.05544 |
18.0375 |
0.37944 |
The obtained values for both models are relatively small, ca. 0.055–0.057 a.u. and the global softness σ values are quite significant (17.52–18.04 a.u.) (Table 2). This suggests that this system would be quite highly reactive towards oxidizing agents which attack the surface, supporting the suggestion that the composite materials can protect the alloy surface form the aggressive ions medium, thereby improving the inhibition efficiency. This is also supported by a relatively small HOMO–LUMO energy gap value (ΔE) (Table 2). The relatively small global electronegativity (χ), ca. 0.193–0.205 a.u., and low electrophilicity (ω), 0.323–0.380 a.u. values also suggesting higher potential reactivity of the system with oxidizing electrophilic agents.
4. Conclusions
The current study leads to the following outcomes: (i) for the first time, novel terbium functionalized graphene oxide composite materials have been synthesized and characterized and have been proved to be suitable and excellent corrosion inhibition coating for the Mg alloys.
(ii) The spectral analysis of the functional groups and XRD crystallinity results showed electrostatic interaction of Tb with the graphene oxide sheet.
(iii) The microscopy studies suggested the formation of nanosheets with high crystallinity of Tb–GO composite material.
(iv) Electrochemical studies revealed the stability of Tb–GO composite at high voltage after 20 cycles. A significant corrosion inhibition efficiency was shown for the Tb–GO composite materials.
(v) The DFT results supported the experimental data, suggesting that the Tb–GO composite material acts as a passivation coating layer on the Mg alloy surface.
Conflicts of interest
There is no conflict of interests.
Acknowledgements
N. P. and Prof Ivan. Cole would like to thank RMIT University to support this research work and the Central University of Gujarat for Instrumental facilities. A. E. K. acknowledges the computational facilities of the Technological Institute of Aeronautics, Brazil.
References
- M. L. Zheludkevich, D. G. Shchukin, K. A. Yasakau, H. Mohwald and M. G. S. Ferreira, Chem. Mater., 2007, 19, 402–411 CrossRef CAS.
- P. B. Matad, P. B. Mokshanatha, N. Hebbar, V. T. Venkatesha and H. C. Tandon, Ind. Eng. Chem. Res., 2014, 53, 8436–8444 CrossRef CAS.
- B. Heeg and D. Klenerman, Langmuir, 2000, 16, 1783–1792 CrossRef CAS.
- M. Faustin, A. Maciuk, P. Salvin, C. Roos and M. Lebrini, Corros. Sci., 2015, 92, 287–300 CrossRef CAS.
- Y. Ren, Y. Luo, K. Zhang, G. Zhu and X. Tan, Corros. Sci., 2008, 50, 3147–3153 CrossRef CAS.
- H. Z. Alkhathlan, M. Khan, M. M. S. Abdullah, A. M. AlMayouf, A. Y. Badjah-Hadj-Ahmed, Z. A. AlOthman and A. A. Mousa, RSC Adv., 2015, 5, 54283–54292 RSC.
- M. Lebrini, F. Robert, A. Lecante and C. Roos, Corros. Sci., 2011, 53, 687–695 CrossRef CAS.
- K. W. Tan and M. J. Kassim, Corros. Sci., 2011, 53, 569–574 CrossRef CAS.
- E. E. Oguzie, Corros. Sci., 2008, 50, 2993–2998 CrossRef CAS.
- H. Lu, S. Zhang, W. Li, Y. Cui and T. Yang, ACS Appl. Mater. Interfaces, 2017, 9, 4034–4043 CrossRef CAS.
- X. Luo, J. Zhong, Q. Zhou, S. Du, S. Yuan and Y. Liu, ACS Appl. Mater. Interfaces, 2018, 10, 18400–18415 CrossRef CAS.
- N. Palaniappan, I. S. Cole, A. E. Kuznetsov, K. Balasubramanian and K. R. Justin Thomas, RSC Adv., 2019, 9, 32441–32447 RSC.
-
(a) N. Palaniappan, I. S. Cole and A. E. Kuznetsov, RSC Adv., 2020, 10, 11426–11434 RSC;
(b) X. Yanfei, H. Yi, Y. Weibo, Z. Long and C. Yongsheng, J. Nanosci. Nanotechnol., 2013, 13, 1116–1119 CrossRef.
- X. Yanfei, H. Yi, Y. Weibo, Z. Long and C. Yongsheng, J. Nanosci. Nanotechnol., 2013, 13, 1116–1119 CrossRef.
- M. J. Frisch, G. W. Trucks, H. B. Schlegel, G. E. Scuseria, M. A. Robb, J. R. Cheeseman, G. Scalmani, V. Barone, G. A. Petersson, H. Nakatsuji, X. Li, M. Caricato, A. Marenich, J. Bloino, B. G. Janesko, R. Gomperts, B. Mennucci, H. P. Hratchian, J. V. Ortiz, A. F. Izmaylov, J. L. Sonnenberg, D. Williams-Young, F. Ding, F. Lipparini, F. Egidi, J. Goings, B. Peng, A. Petrone, T. Henderson, D. Ranasinghe, V. G. Zakrzewski, J. Gao, N. Rega, G. Zheng, W. Liang, M. Hada, M. Ehara, K. Toyota, R. Fukuda, J. Hasegawa, M. Ishida, T. Nakajima, Y. Honda, O. Kitao, H. Nakai, T. Vreven, K. Throssell, J. A. Montgomery Jr, J. E. Peralta, F. Ogliaro, M. Bearpark, J. J. Heyd, E. Brothers, K. N. Kudin, V. N. Staroverov, T. Keith, R. Kobayashi, J. Normand, K. Raghavachari, A. Rendell, J. C. Burant, S. S. Iyengar, J. Tomasi, M. Cossi, J. M. Millam, M. Klene, C. Adamo, R. Cammi, J. W. Ochterski, R. L. Martin, K. Morokuma, O. Farkas, J. B. Foresman and D. J. Fox, Gaussian 09, Revision B.01, Gaussian, Inc., Wallingford CT, 2016 Search PubMed.
- Y. Zhao and D. G. Truhlar, Theor. Chem. Acc., 2008, 120, 215–241 Search PubMed.
- P. Fuentealba, H. Stoll, L. v. Szentpály, P. Schwerdtfeger and H. Preuss, J. Phys. B, 1983, 16, L323–L28 CrossRef CAS.
- X. Y. Cao and M. Dolg, J. Mol. Struct., 2002, 581, 139–147 CrossRef CAS.
- G. A. Petersson, A. Bennett, T. G. Tensfeldt, M. A. Al-Laham, W. A. Shirley and J. Mantzaris, J. Chem. Phys., 1988, 89, 22193–22218 Search PubMed.
- A. McLean and D. G. S. Chandler, J. Chem. Phys., 1980, 72, 5639–5648 CrossRef CAS.
- E. Cances and B. T. Mennucci, J. Chem. Phys., 1997, 107, 3032–3041 CrossRef CAS.
- A. A. Ansari and J. P. Labis, J. Mater. Chem., 2012, 22, 16649 RSC.
- D. A. Gálico, I. O. Mazali and F. A. Sigoli, New J. Chem., 2018, 42, 18541–18549 RSC.
- T. Palasyuk, S. Saxena, P. Z. Ejgierd and M. Tkacz, J. Alloys Compd., 2014, 597, 58–62 CrossRef CAS.
- Y. F. Jiang, C. Z. Yuan, T. Y. Cheang and A. W. Xu, New J. Chem., 2019, 43, 9210–9215 RSC.
- S. Pang, Z. Zhou and Q. Wang, Carbon, 2013, 58, 232–2324 CrossRef CAS.
- M. T. Colomer, S. D. Moreno, A. Tamayo, A. L. Ortiz and J. Chaboy, J. Mater. Chem. C, 2018, 6, 12643–12651 RSC.
- C. Tan, Q. Wang and C. C. Zhan, Chem. Commun., 2011, 47, 12521–12523 RSC.
- N. T. Rice, I. A. Popov, D. R. Russo, T. P. Gompa, A. Ramanathan, J. Bacsa, E. R. Batista, P. Yang and H. S. La Pierre, Chem. Sci., 2020, 11, 6149–6159 RSC.
- C. T. Palumbo, I. Zivkovic, R. Scopelliti and M. Mazzanti, J. Am. Chem. Soc., 2019, 141, 9827–9831 CrossRef CAS.
- Z. Zhou and Q. Wang, Nanoscale, 2014, 6, 4583–4587 RSC.
- J. Wang and X. Sun, Energy Environ. Sci., 2012, 5, 5163–5185 RSC.
- J. L. Xie, C. X. Guo and C. M. Li, Energy Environ. Sci., 2014, 7, 2559–2579 RSC.
- V. Chabot, D. Higgins, A. Yu, X. Xiao, Z. Chen and J. Zhang, Energy Environ. Sci., 2014, 7, 1564–1596 RSC.
- C. Xu, B. Xu, Y. Gu, Z. Xiong, J. Sunband and X. S. Zhao, Energy Environ. Sci., 2013, 6, 1388–1414 RSC.
- D. Liu, C. Guo, L. Chai, V. R. Sherman, X. Qin, Y. Ding and M. A. Meyers, Mater. Sci. Eng., B, 2015, 195, 50–58 CrossRef CAS.
- E. Willbold, A. A. Kaya, R. A. Kaya, F. Beckmann and F. Witte, Mater. Sci. Eng., B, 2011, 176, 1835–1840 CrossRef CAS.
- L. White, Y. Koo, S. Neralla, J. Sankar and Y. Yun, Mater. Sci. Eng., B, 2016, 208, 39–46 CrossRef CAS.
- A. M. Fekry and R. H. Tammam, Mater. Sci. Eng., B, 2011, 176, 792–798 CrossRef CAS.
- S. Liu and B. Wang, J. Mater. Res. Technol., 2020, 9, 6612–6619 CrossRef CAS.
- T. M. Pan, C. W. Wang, W. H. Weng and S. T. Pang, J. Mater. Chem. C, 2014, 2, 7575–7582 RSC.
- Y. Wang, Y. Deng, J. Chen, Q. Dai and X. Guo, J. Mater. Res. Technol., 2020, 9, 5391–5402 CrossRef CAS.
- V. N. Paunov, H. Al-Sherry and T. S. Horozov, Phys. Chem. Chem. Phys., 2016, 18, 26495–26508 RSC.
- J. Drelich, E. Chibowski, D. D. Meng and K. Terpilowski, Soft Matter, 2011, 7, 9804–9828 RSC.
- C. Semprebon, S. Herminghaus and M. Brinkmann, Soft Matter, 2012, 8, 6301–6630 RSC.
- J. Xu, Q. Yang, M. S. Javed, Y. Gong, M. K. Aslam and C. Chen, RSC Adv., 2017, 7, 5880–5887 RSC.
- J. Zhou, X. Zhang, Q. Li, Y. Liu, F. Chen and L. Li, J. Mater. Chem. B, 2013, 1, 6213–6224 RSC.
- Y. Jiao, J. Zhang, P. Kong, Z. Zhang, Y. Jing, J. Zhuang, W. Wang, L. Zhang, C. Xu, R. Wu and M. Zhang, J. Mater. Chem. B, 2015, 3, 7386–7400 RSC.
- W. Shang, C. He, Y. Wen, Y. Wang and Z. Zhang, RSC Adv., 2016, 6, 113967–113980 RSC.
- J. Liu, P. Wang, C. C. Chu and T. Xi, J. Mater. Chem. B, 2017, 5, 1787–1802 RSC.
- N. Wang, Y. Mu, Q. Li and Z. Shi, RSC Adv., 2017, 7, 53226–53235 RSC.
- B. K. Jiang, A. Y. Chen, J. F. Gu, J. T. Fan, Y. Liu, P. Wang, H. J. Li, H. Sun, J. H. Yang and X. Y. Wang, Carbon, 2020, 157, 537–548 CrossRef CAS.
- G. Chilkoor, R. Sarderc, J. Islama, K. E. ArunKumar, I. Ratnayakee, S. Stara, B. K. Jasthif, G. Seredac, N. Koratkarg, M. Meyyappani and V. Gadhamshetty, Carbon, 2020, 159, 586–597 CrossRef CAS.
- L. B. Tong, J. B. Zhang, C. Xu, X. Wang, S. Y. Song, Z. H. Jiang, S. Kamado, L. R. Cheng and H. J. Zhang, Carbon, 2016, 109, 340–351 CrossRef CAS.
- J. Peng, Z. Zhang, C. Long, H. Chen, Y. Wu, J. Huang, W. Zhou and Y. Wu, J. Alloys Compd., 2020, 827, 154096 CrossRef CAS.
- X. Liu, T. C. Zhang, H. He, L. Ouyang and S. Yuan, J. Alloys Compd., 2020, 834, 155210 CrossRef CAS.
- Y. Yi, G. Weinberg, M. Prenzel, M. Greiner, S. Heumann, S. Becker and R. Schlog, Catal. Today, 2017, 295, 32–40 CrossRef CAS.
- V. Z. Asl, J. Zhao, M. J. Anjum, S. Wei, W. Wang and Z. Zhao, J. Alloys Compd., 2020, 821, 153248 CrossRef.
- Z. Li, X. Wang, X. Dong, F. Hu, S. Liu, M. Zhang, T. Yuan, Y. Yu, Q. Kuang, Q. Ren, J. Wang and X. Jing, J. Alloys Compd., 2020, 818, 153341 CrossRef CAS.
Footnote |
| † Electronic supplementary information (ESI) available. See DOI: 10.1039/d0ra08766a |
|
| This journal is © The Royal Society of Chemistry 2021 |
Click here to see how this site uses Cookies. View our privacy policy here. 
 Open Access Article
 This Open Access Article is licensed under a Creative Commons Attribution-Non Commercial 3.0 Unported Licence
 *a,
Ivan S. Cole
*a,
Ivan S. Cole