
 Open Access Article
 This Open Access Article is licensed under a Creative Commons Attribution-Non Commercial 3.0 Unported Licence
Crystal polymorphism of 8OCB liquid crystal consisting of strongly polar rod-like molecules†
Subhadip Ghosh and
Arun Roy *
*
Raman Research Institute, C.V. Raman Avenue, Sadashivanagar, Bangalore 560080, India. E-mail: aroy@rri.res.in
First published on 26th January 2021
Abstract
We report detailed experimental studies on the different crystal polymorphs of 8OCB (4′-octyloxy-4-cyanobiphenyl) obtained by cooling the sample from its melt. The 8OCB liquid crystal has a stable crystal phase which is known as commercial powder (CP) phase. In addition, it also exhibits various metastable crystal phases such as square-plate, needle phase and long parallelepiped (PP) phase. We identify the metastable crystal state often found on cooling the sample from its melt as PP phase which transforms to stable CP phase on aging at room temperature or by heating it above 312 K. Based on our experimental results, we find that the stable CP crystal phase of 8OCB is not a single homogeneous phase but is the coexistence of fibrillar nano-crystallites embedded in an amorphous phase. The heterogeneous nature of its stable crystal state is an intriguing feature of this pure compound consisting of relatively small rod-like molecules with a strong dipole moment along their long axis.
1 Introduction
Molecules with a strong electric dipole moment can exhibit a rich variety of phases on changing the temperature. The long range dipole–dipole interactions between the molecules compared to the van der Waals interactions play an important role in stabilising different phases. The strong dipolar association contributes to the complexity in the self-organisation of the molecules giving rise to interesting physical properties in their liquid and solid phases.1,2 In the last few decades different phases of dipolar nOCB liquid crystal homologs have been investigated, where n denotes the number of carbon atoms in the terminal aliphatic chain attached to one end of the biphenyl core of the molecule.3–9 These rod-like molecules have a strong dipole moment along their long axis due to the presence of the nitrile (CN) group attached to the other end of the biphenyl core of each molecule.3 In this family of liquid crystals, the compounds 8OCB (4′-octyloxy-4-cyanobiphenyl) and 9OCB (4′-nonyloxy-4-cyanobiphenyl) with intermediate chain length show both smectic and nematic phases. The lower homologs exhibit only nematic phase and higher homologs exhibit only smectic phase.10 In the smectic A phase, the rod-like molecules are arranged in layers with their long axes on average parallel to the layer normal and the layer spacing is the same as the molecular length (l).11 But the nOCB homologues exhibit an intercalated smectic A (SmAd) phase with layer spacing as 1.4l.3,7,9 Moreover at higher pressure and in mixtures of different homologous compounds, a remarkable reentrance phenomenon with reentrant nematic phase has been observed.3,4,8 The intercalated nature of the smectic A phase and the reentrant phenomenon are thought to arise from the strong dipolar association of the molecules forming dynamic pairs in their liquid crystalline phases.3,7Interestingly these nOCB liquid crystals also exhibit various stable and metastable crystalline phases.10,12–17 Hori et al. first observed three different metastable crystal polymorphs of 8OCB grown from its solution and these phases were square-plate, needle phase and long parallelepiped (PP) phase respectively.10 They found that the square-plate phase was too unstable to probe experimentally. With the help of X-ray diffraction studies, it has been shown that the needle and PP metastable phases have triclinic and monoclinic lattice structures respectively. The molecules in the needle phase form tetramers by CN⋯CN interactions whereas the CN⋯biphenyl intermolecular interactions play a dominant role in stabilising the monoclinic crystal structure of the PP phase. In addition to these metastable crystal phases, 8OCB has a stable crystal phase which is known as the commercial powder (CP) phase. The lattice structure of the CP phase is monoclinic but the detail molecular arrangement is still not well understood.5,18 Most of the previous studies on stable and metastable crystal phases of 8OCB were carried out on solution crystallised samples.10,16,18 Jakli et al. studied a metastable crystal state of 8OCB obtained by cooling the sample from its melt and identified the observed metastable phase as needle crystal phase.19 After that the temperature variation of the dielectric constant of a metastable state of 8OCB doped with graphene nano-platelets has been reported.20 Recently, a glassy state of 8OCB on fast cooling of the sample from its melt has been observed.21
Though a large number of studies on the liquid crystalline phases of nOCB molecules have been reported, relatively few studies have been performed on the solid phases of this system. In this work, we report detailed experimental studies on the different crystal polymorphs of 8OCB obtained by cooling the sample from its melt. We identify the metastable crystal state found in our sample as PP phase which transforms to stable CP phase on aging at room temperature or by heating it above 312 K. Based on our experimental results, we have found that the stable CP crystal phase of 8OCB is a heterogeneous phase with the coexistence of fibrillar nano-crystallites embedded in an amorphous phase. The existence of various metastable crystal phases and a heterogeneous phase as the stable ground state show remarkable complexity of the free energy landscape for this type of pure compound consisting of relatively small rod-like molecules with a strong dipole moment along their long axis.
2 Experimental
The commercially available liquid crystalline sample 4′-octyloxy-4-cyanobiphenyl (8OCB) was used in all the experimental studies. Sample sandwiched between two cleaned cover slips was used for Raman Spectroscopy (RS) and Polarised Optical Microscopy (POM) studies. A cover slip was heated to 373 K by keeping it on a hot stage and then a small amount of 8OCB sample was placed on it. The sample transformed to isotropic state at that temperature. Then another cover slip was carefully placed on top of the sample. The sample sandwiched between the cover slips was then allowed to cool to obtain the different crystal polymorphs. Raman spectra were obtained using a laser micro-Raman spectrometer (Jabin-Yvon T64000) equipped with a microscope hot stage and a temperature controller (Linkam T95). The Raman signal from the back scattered light was detected using a cooled CCD camera. Prior to taking the Raman spectra of the sample, the spectrometer was calibrated using the 520.7 cm−1 line of silicon. The POM studies of the sample were carried out on a polarized optical microscope (Olympus BX 50) equipped with a hot stage (METTLER FP 800).X-ray diffraction (XRD) studies were performed on samples filled in Lindemann capillaries (outer diameter 1.0 mm) with CuKα radiation of wavelength 1.54 Å using a DY 1042-Empyrean (PANalytical) X-ray diffractometer comprising a programmable divergence slit and PIXcel 3D detector. Small-angle X-ray scattering (SAXS) studies were performed using a HECUS S3 Microsystem fitted with a copper anode X-ray generator (Genix) and a 1D position-sensitive detector. The sample was taken in the Lindemann capillary tube (outer diameter 1.0 mm). A Peltier-controlled stainless steel holder was used to maintain the sample temperature.
Field Emission Scanning Electron Microscopic (FESEM) studies were performed by using a Carl Zeiss (Ultra Plus model) system. This technique was used to probe the surface morphology of the samples. For FESEM studies, a small amount of sample was kept on a cleaned thin aluminium foil and it was cooled to the desired phases from its isotropic phase. The sample was then coated with platinum [QUORUM (Q150R S)] to probe sample surface morphology.
The dielectric measurements in the metastable crystalline state were performed by using homemade liquid crystal (LC) cells. The LC cells were made by using clean ITO coated glass plates with a circular electrode area of diameter 8 mm. For probing the dielectric constant of the stable crystal phase, commercially available LC cells (INSTEC Inc.) of sample thickness 9 μm were also used. The sample was filled in the LC cells in its isotropic state by capillary action using a hot stage. The measurements of the dielectric constant as a function of temperature were performed on a homemade experimental setup. It was measured by applying a sinusoidal AC voltage of frequency 5641 Hz and rms amplitude 0.5 volts to the sample cell and a resistance of 1 kΩ connected in series. The amplitude and phase of the voltage drop across the resistance were measured by using a lock-in amplifier (Stanford Research SR830). After impedance analysis, we measured the capacitance of the sample cell. The effective dielectric constant was extracted by taking the ratio of this measured capacitance with the empty cell capacitance measured prior to filling the sample in the LC cell. The temperature of the sample was monitored by a microscope hot stage and a temperature controller (INSTEC Inc.). The measurements were automated by interfacing the instruments with a computer using a customized LabVIEW program.
3 Results and discussion
Two types of crystal phases of 8OCB were most often observed on cooling the sample from its melt. One of them was the stable commercial powder or CP crystal phase. The other phase was the metastable parallelepiped or PP crystal phase which transformed to the CP crystal phase at higher temperature or even at room temperature after few days. The POM textures of the CP phase and the PP phase are shown in Fig. 1a and b respectively. The stable CP crystal phase grew from its melt as spherulites and showed a non-uniform grainy texture (Fig. 1a) between crossed polarisers. The non-uniform texture indicates the presence of many submicroscopic domains coexisting in this phase. The metastable PP phase grew from its melt as flat strips with a smooth homogeneous texture (Fig. 1b). Interestingly, the growing front edge of a strip was found to be tilted with respect to the growth direction by an acute angle of about ±40°. When a strip was rotated by 360° between crossed polarisers, four extinction positions with a difference of 90° were always found. This indicates that a strip of PP phase has a uniform orientational order. The uniform extinction of a strip occurred when its front edge was made parallel or perpendicular to the polariser axis. It implies that the major or minor axis of the effective refractive index ellipse is parallel to the front edge of the strip. POM studies using a λ-plate were performed to determine the direction of the major axis of this refractive index ellipse within a strip of PP phase. The used λ-plate was a positive birefringent crystal plate with a known direction for its slow axis. A strip of lower thickness with the birefringence colour in the first order region of the Levy chart (see Fig. 2a) was chosen for this purpose to clearly identify the colour changes of the sample on inserting the λ-plate in the light path. The strip was kept at its brightest positions at an angle ±45° respectively with respect to one of its four extinction positions; i.e. the front edge of the strip was making an angle ±45° respectively with respect to the polariser. At these two brightest positions, colour variations of the strip were noticed (see Fig. 2b and c) by introducing the λ-plate in the optical path of the microscope. When the front edge of the strip was parallel to the slow axis of the λ-plate, the strip appeared blue (Fig. 2b) indicating the effective addition of optical path differences between the ordinary and extraordinary rays on passing through the sample and the λ-plate. On the other hand, when the front edge of the strip was perpendicular to the slow axis of the λ-plate then the strip appeared dark yellow (Fig. 2c) due to the effective subtraction of these optical path differences. These observations illustrate that the effective refractive index parallel to the front edge (white double headed arrow in Fig. 2a) of the PP strip is larger than that perpendicular to the growing front plane of the strip. Fig. 2d shows a possible schematic organisation of the 8OCB molecules within the strip. Here the reported monoclinic lattice structure of the PP phase is used.10 The b-axis of the monoclinic lattice having the maximum component of the refractive index is parallel to the front edge of the strip while the c-axis is perpendicular to the growing front plane. The molecules lie parallel to this front plane of the growing strip as shown in Fig. 2d. This organisation of the molecules may account for the slightly higher value of the dielectric constant in the PP phase compared to that in the CP crystal phase discussed below.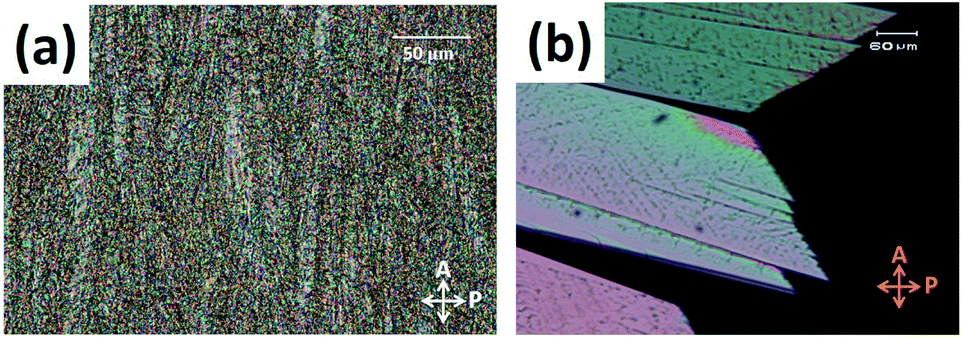 | ||
| Fig. 1 The POM textures of (a) the stable CP phase and (b) PP phase growing from smectic phase of 8OCB. | ||
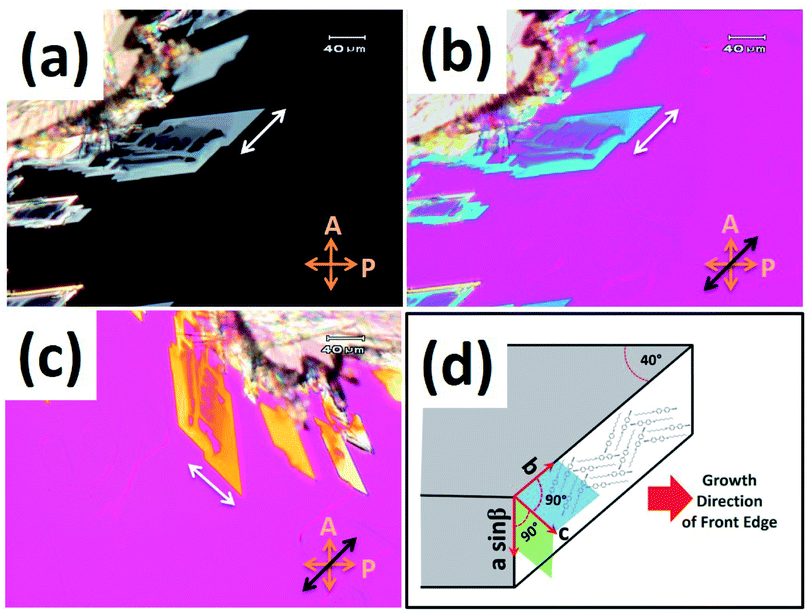 | ||
| Fig. 2 The POM textures of a strip of PP phase between crossed polarisers: (a) without λ-plate, (b) with the slow axis of the λ-plate parallel to the front edge and (c) with the slow axis of the λ-plate perpendicular to the front edge. The white double headed arrow indicates the major axis of the effective refractive index ellipse within the strip. (d) The schematic representation of the molecular organisation within the strip. | ||
The metastable PP phase transforms to the stable CP phase on increasing the temperature of the sample. Fig. 3 shows the POM textures of the growth of CP phase into the PP phase. The CP phase appeared from the top left corner of the visible area of the sample at 312 K. This is the reported transition temperature of solution crystallised PP phase of 8OCB.16 So the metastable phase observed in our sample on cooling from its melt is the PP phase.
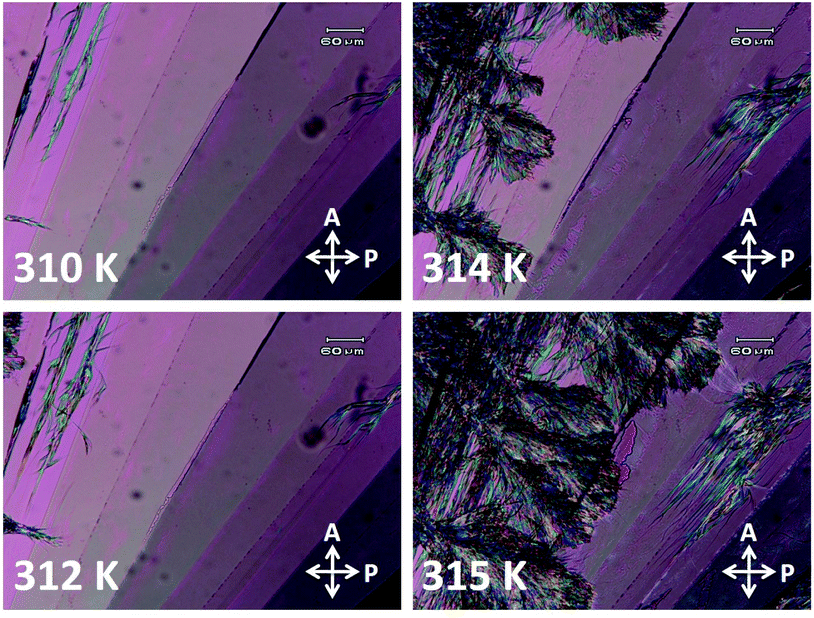 | ||
| Fig. 3 The POM textures showing the transformation of PP phase to CP phase with increasing temperature. | ||
The POM texture of CP phase showed evidence of many coexisting submicroscopic domains (Fig. 1a). But the resolution of the optical microscope was not enough to resolve the structure of these domains. The FESEM studies were performed to investigate the structure of these phases at higher resolution. Fig. 4 shows the FESEM photomicrographs of the sample in these phases. The FESEM texture of the CP phase (Fig. 4a) shows the presence of numerous fibrillar nano-crystallites embedded in an uncrystallised amorphous phase. Fig. 4b shows the cross sectional view of these nano-crystallites in the CP phase. The nano-crystallites have a long fibrillar shape of length 5–7 μm and width about 100–400 nm. The XRD studies discussed later show that the fibrillar nano-crystallites have a monoclinic crystal structure while the other component of CP phase has no crystal order and hence it is in an amorphous state. The FESEM studies therefore clearly revealed that the stable CP crystal phase of 8OCB is a heterogeneous phase consisting of two subphases coexisting together. Fig. 4c shows the FESEM texture of the PP phase. The inset shows the magnified view of the marked position in Fig. 4c. The uniform FESEM texture of metastable PP phase shows the homogeneity of this phase unlike the CP phase.
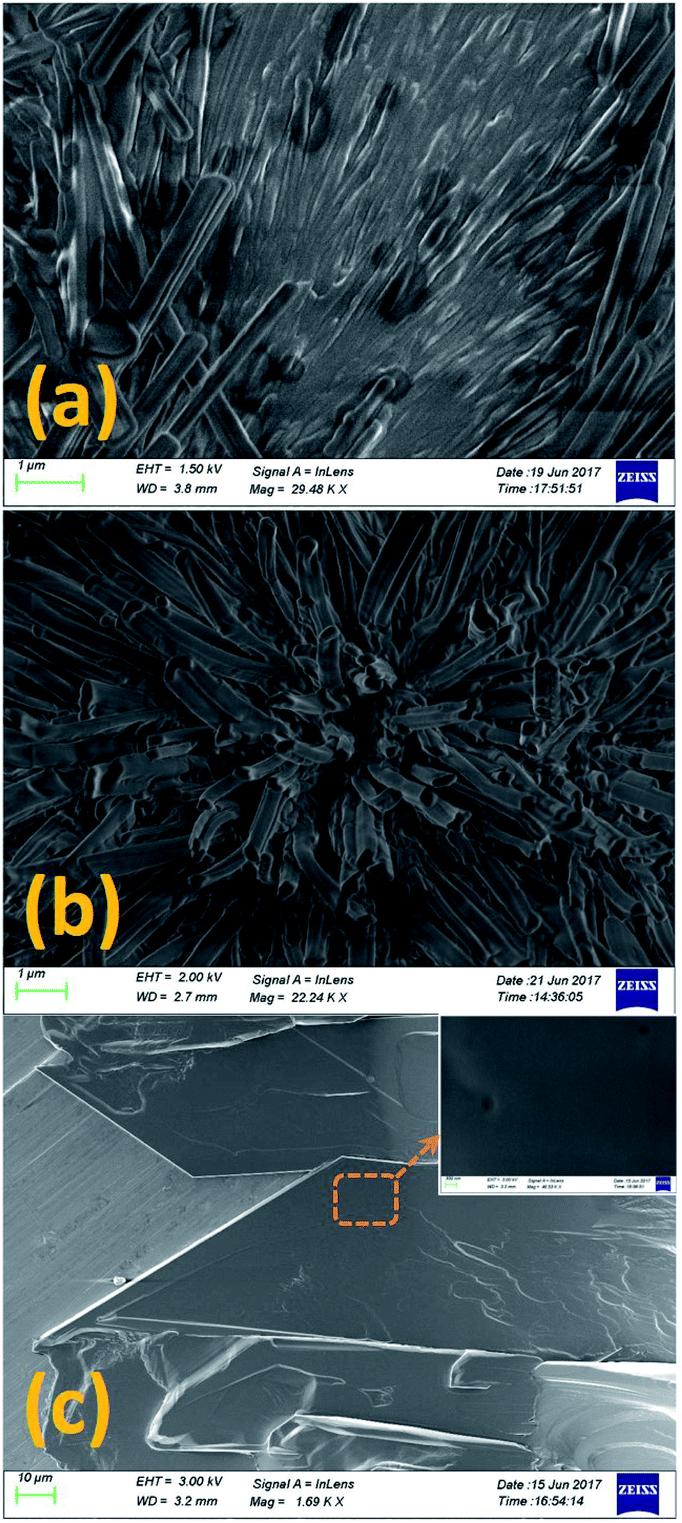 | ||
| Fig. 4 The SEM textures of (a) the CP phase, (b) the cross sectional view of the fibrillar nano-crystallites in the CP phase and (c) PP phase. The inset in (c) shows the magnified view of the marked region of the PP phase indicating smooth homogeneous texture. | ||
Dielectric measurements on the sample were performed with increasing temperature to detect the various phase transitions as shown in Fig. 5. One advantage of our technique is that the state of the sample can be observed during the measurement of the dielectric constant using POM. Due to the metastable nature of the PP phase, it is important to ensure the starting state of the sample during the measurement. The measurements were carried out during heating of the sample either from the metastable PP phase or from the stable CP phase. The transition from the PP phase to the CP phase at 312 K was clearly detected as shown in Fig. 5a. A step decrease in dielectric constant is clearly visible at this transition (see inset in Fig. 5a). On further heating, the melting transition from CP to SmA phase at 327.5 K was observed which agrees with the reported melting point of solution crystallised CP phase.16 Interestingly, a prominent pre-transitional effect in which the dielectric constant of the sample increasing continuously from 321 K was observed (see Fig. 5). Further studies discussed below showed that this pre-transitional effect arose due to the changes occurring in the heterogeneous CP phase in this temperature range. The amorphous component of the CP phase starts to transform below the melting point of the nano-crystallites at 327.5 K giving rise to this pre-transitional behaviour. The monotonic increase of the dielectric constant in the SmA phase on heating was due to the gradual change from planar to homeotropic alignment of molecules in the LC cell. The dielectric constant parallel to the average molecular orientation axis in the homeotropic configuration is much larger than that of the perpendicular component in planar configuration due to the strong longitudinal dipole moment of the 8OCB molecules.22 The dielectric constant then again decreased in the nematic phase as the nematic to isotropic transition temperature was approached due to the decrease in the orientational order.
 | ||
| Fig. 5 The temperature variations of the dielectric constant of 8OCB on heating the sample from its (a) PP phase and (b) CP phase. The inset in (a) shows the variation of the dielectric constant across the PP to CP phase transition in an expanded scale. | ||
The powder X-ray diffraction (XRD) studies were performed to characterise the crystallographic structures of the CP phase. The XRD intensity profile obtained in the CP phase is shown in Fig. 6. The prominent diffraction peaks obtained in the CP phase can be indexed with the Miller indices of a monoclinic lattice structure as indicated in Fig. 6. The lattice parameters obtained for the monoclinic structure are a = 30.72 Å, b = 7.47 Å, c = 25.58 Å and β = 107.72°. These parameters obtained in our experiment agree with the results reported from solution crystallised CP phase.18 Our XRD studies showed the presence of a single lattice structure in the CP phase even though the FESEM studies clearly revealed the presence of two coexisting sub-phases in this phase. Therefore, we conclude from the XRD studies that the nano-crystalline component of the CP phase has a monoclinic lattice structure while the other component, which did not exhibit any peaks in the XRD profile is in the uncrystallised amorphous state.
 | ||
| Fig. 6 The XRD intensity profile of the CP phase showing the characteristic peaks corresponding to a monoclinic lattice structure. The 2θ range corresponding to the q-range shown in the figure is from 1° to 28°. The Miller indices associated with the peaks are also depicted. | ||
To identify the structural changes in the CP phase during heating in the pre-transitional temperature range from 321 K to 327.5 K, small angle X-ray scattering (SAXS) studies of the sample were performed. In the wave vector (q) range from 1.40 to 3.20 nm−1 of the SAXS spectra, three peaks at 2.14 nm−1 (100), 2.58 nm−1 (001) and 2.80 nm−1 (10![[1 with combining macron]](https://www.rsc.org/images/entities/char_0031_0304.gif) ) corresponding to the monoclinic lattice structure of CP phase were found. These peaks were fitted with three different Gaussian functions to accurately determine their intensities, positions and the full widths at half maxima (FWHM). The intensity profiles of these fitted peaks as function of the wave vector q at different temperatures are shown in the ESI (see Fig. S1†). Fig. 7 shows the variation of the intensity and FWHM of these peaks with temperature difference ΔT = T − Tc, where T and Tc denote the measured temperature and the transition temperature from CP to smectic phase respectively. The intensity of all these peaks either increased or remained almost the same with increasing temperature until ΔT = −2 K and then started to decrease until the complete melting of the CP phase at Tc. The FWHM of all these peaks decreased until Tc. Above Tc, only one peak at 1.98 nm−1 corresponding to the layer spacing in the smectic phase was observed. Interestingly, this smectic peak started to grow from 5 K below Tc and became prominent with heating (Fig. 7d). The SAXS results therefore indicate that both the nano-crystalline component of the CP phase and the smectic phase grew at the expense of the amorphous component of the CP phase during heating it in this pre-transitional region. This was also confirmed by studying the SEM texture of the CP phase which was cooled to room temperature after heating it to 326 K. This texture showed that the size of the fibrillar nano-crystallites in the CP phase became larger compared to that obtained on cooling from its melt (see Fig. S2 in ESI†). It implies that the fibrillar nano-crystallites in the CP phase grew at the expense of the amorphous phase in the pre-transitional temperature range and their size was preserved on subsequent cooling to room temperature. These changes in the morphology of the sample during heating gave rise to the continuous increase in the dielectric constant of the CP phase before its complete melting.
) corresponding to the monoclinic lattice structure of CP phase were found. These peaks were fitted with three different Gaussian functions to accurately determine their intensities, positions and the full widths at half maxima (FWHM). The intensity profiles of these fitted peaks as function of the wave vector q at different temperatures are shown in the ESI (see Fig. S1†). Fig. 7 shows the variation of the intensity and FWHM of these peaks with temperature difference ΔT = T − Tc, where T and Tc denote the measured temperature and the transition temperature from CP to smectic phase respectively. The intensity of all these peaks either increased or remained almost the same with increasing temperature until ΔT = −2 K and then started to decrease until the complete melting of the CP phase at Tc. The FWHM of all these peaks decreased until Tc. Above Tc, only one peak at 1.98 nm−1 corresponding to the layer spacing in the smectic phase was observed. Interestingly, this smectic peak started to grow from 5 K below Tc and became prominent with heating (Fig. 7d). The SAXS results therefore indicate that both the nano-crystalline component of the CP phase and the smectic phase grew at the expense of the amorphous component of the CP phase during heating it in this pre-transitional region. This was also confirmed by studying the SEM texture of the CP phase which was cooled to room temperature after heating it to 326 K. This texture showed that the size of the fibrillar nano-crystallites in the CP phase became larger compared to that obtained on cooling from its melt (see Fig. S2 in ESI†). It implies that the fibrillar nano-crystallites in the CP phase grew at the expense of the amorphous phase in the pre-transitional temperature range and their size was preserved on subsequent cooling to room temperature. These changes in the morphology of the sample during heating gave rise to the continuous increase in the dielectric constant of the CP phase before its complete melting.
 | ||
| Fig. 7 The temperature variation of intensity and FWHM of three crystalline peaks (a) (100), (b) (001), (c) (10) of CP phase and (d) (001) peak of smectic phase on heating the sample in the pre-transitional temperature range. Here ΔT = T − Tc, where T and Tc denote the measured temperature and the complete melting temperature of CP phase respectively. | ||
Raman spectroscopic studies on the sample were performed to characterise the observed crystal phases obtained from its melt. This spectroscopic technique is an indispensable tool to identify the crystal phases of 8OCB.18 Fig. 8 shows the Raman spectra of the sample in its PP and CP phases in the range of 200 cm−1 to 900 cm−1. It can be seen that two closely spaced peaks at about 400 cm−1 are almost not visible (Fig. 8a) for the metastable PP phase but are prominent for the CP phase (Fig. 8b). This doublet peak in the CP phase at 399 cm−1 and 414 cm−1 respectively has been assigned to the stretching vibrations of the twisted biphenyl link.18 The existence of these peaks are quite sensitive to the dihedral or twist angle of the biphenyl moiety of the 8OCB molecules. This dihedral angle varies in the different crystalline states of 8OCB. The reported twist of the biphenyl moiety of 8OCB molecules in PP phase is 2.2° whereas for needle and CP phases the corresponding values are relatively high.10,18 The low value of the twist angle in the PP phase accounts for the absence of the doublet peak at 400 cm−1 while these peaks are prominent in other crystalline phases of 8OCB.18 The absence of these peaks for the metastable crystal phase observed in our experiments on cooling the sample from its melt therefore confirms that it is the PP phase. The Raman spectroscopic signature of the transition from PP to CP phase is shown in Fig. 8c where the doublet peak near 400 cm−1 appears at 312 K.
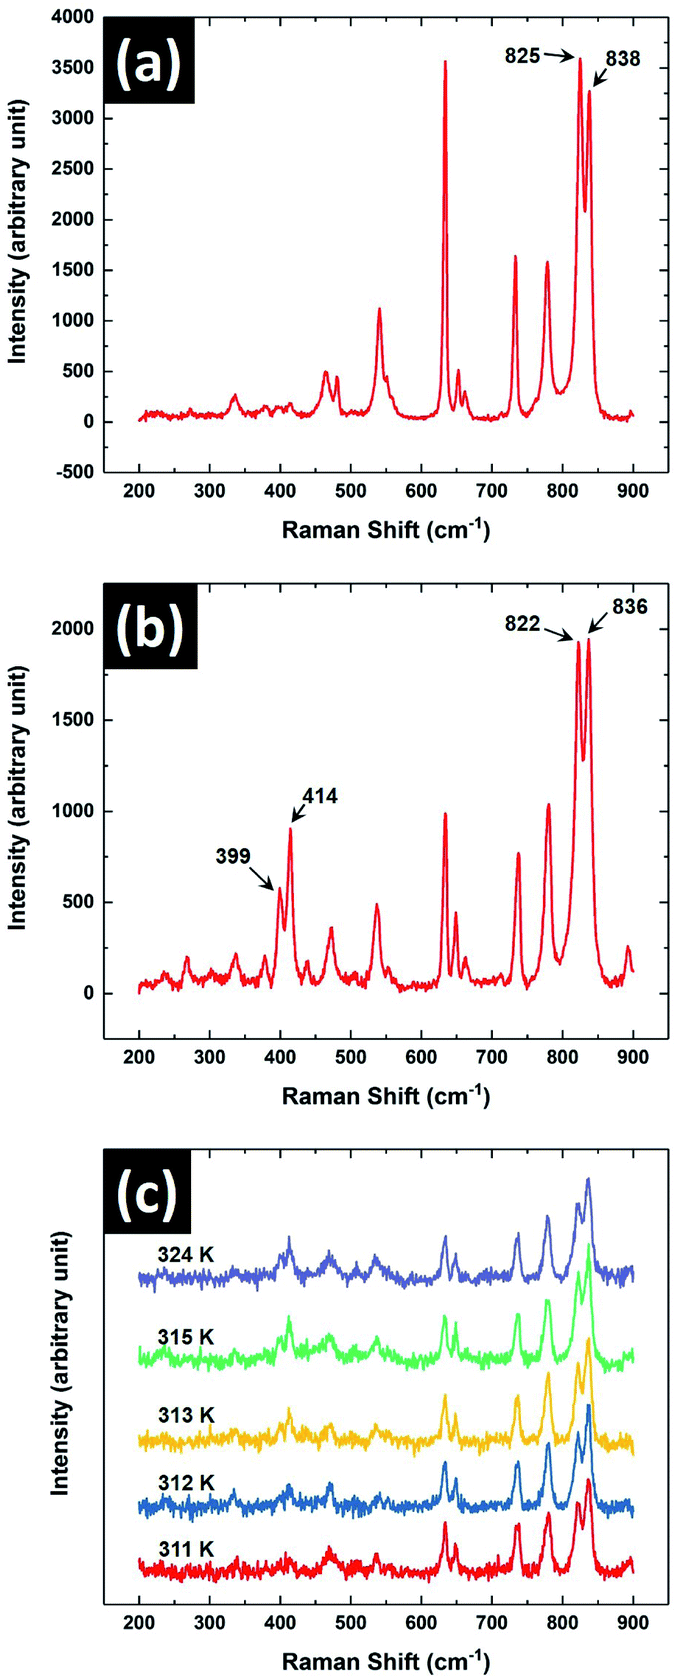 | ||
| Fig. 8 The Raman spectrum in the range from 200 cm−1 to 900 cm−1 of 8OCB in its (a) PP phase and (b) CP phase. (c) The Raman spectra of 8OCB showing the variation with temperature across the transition from PP to CP phase. | ||
Another doublet peak with components at 822 cm−1 and 836 cm−1 was observed for CP phase. The same peaks were also found for PP phase at 825 cm−1 and 838 cm−1 respectively. These peaks near 800 cm−1 are associated with two different perpendicular deformation modes of CH bonds linked with the phenyl rings of the 8OCB molecule.23 The peaks had almost equal intensities for both PP and CP phases and it remained almost the same across PP to CP phase transition (Fig. 8c). For the solution crystallised needle phase of 8OCB, the intensity of the peak with lower Raman shift was found to be significantly higher than that of the other component.18 Therefore the existence of the needle phase can be identified from the nature of these two peaks. Hori et al. reported that in most cases the PP phase grown from 8OCB solution transformed to CP phase on slow heating.18 Occasionally, they also found traces of needle phase in the CP phase after this transition. However, from micro-Raman studies we did not detect the trace of needle phase in the CP phase obtained on heating the PP phase above 312 K.
The CP phase is the most stable and hence the lowest energy crystalline state of 8OCB.16 At room temperature, the metastable PP phase is the next lowest energy state compared to the other phases of 8OCB. Thus, the metastable PP phase which forms on cooling of 8OCB melt tends to transform to the stable CP phase. However at room temperature, this transition takes a few days to complete due to the high energy barrier between these two states. On increasing the temperature, this barrier height to the CP phase decreases and the metastable needle phase becomes of lower energy than the PP phase above 312 K. Thus the PP phase mostly transforms to the CP phase at 312 K. But traces of needle phase can also be found occasionally across the PP to CP transition. The needle phase being more unstable to the formation of CP phase transforms to this latter phase.
The variation of the Raman spectra with temperature was also studied in different phases of 8OCB. The Raman spectrum in the range between 200 cm−1 to 3200 cm−1 of the CP phase of 8OCB is shown in Fig. 9. Four strong vibrational peaks at about 1185 cm−1, 1284 cm−1, 1605 cm−1 and 2234 cm−1 were found in all phases of 8OCB. The first one is associated with an in-plane deformation of CH bonds of the biphenyl moiety.23 The second one is a combinational band of symmetric and asymmetric perpendicular deformations of CH2 groups in the aliphatic chain.23 The third peak is for quadrant stretching mode of aromatic rings and the last one is for the CN stretching vibration.23,24
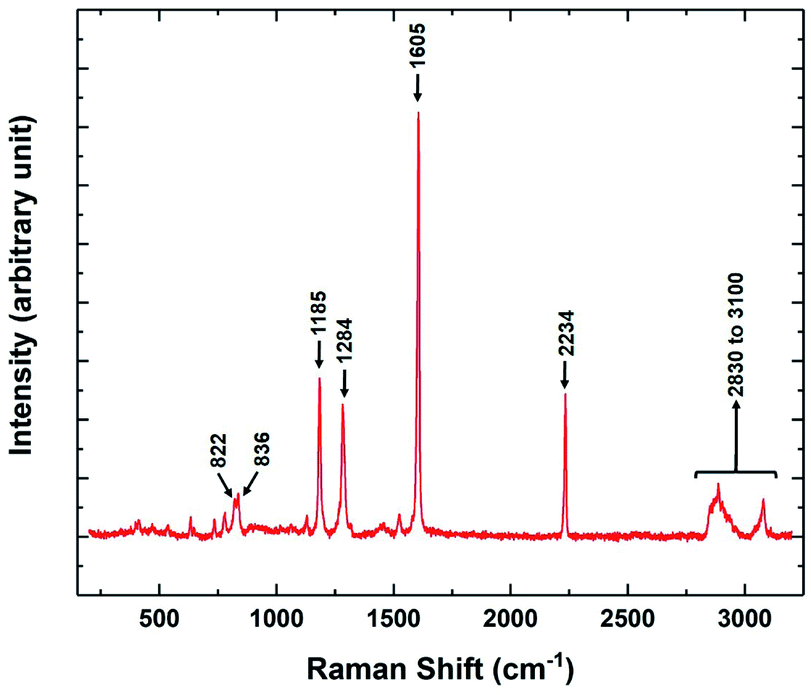 | ||
| Fig. 9 The Raman spectrum of the stable CP phase of 8OCB showing the prominent vibrational peaks in the range from 200 cm−1 to 3200 cm−1. | ||
The variation in the position of the peak near 1185 cm−1 with temperature is shown in Fig. 10. This peak showed a doublet structure in the PP phase and was fitted with the superposition of two closely spaced peaks at 1181 cm−1 and 1188 cm−1 respectively (see Fig. S3 in ESI†). The positions of these two peaks did not vary appreciably with temperature in this phase (Fig. 10a). Across the transition from the PP to CP phase at 312 K, the doublet peak transformed to a single symmetric peak centered at 1184.5 cm−1. The position of this symmetric peak started to decrease continuously on heating above 323 K (Fig. 10a). This type of pre-transitional effect near the melting point of the CP phase was also observed in the XRD and dielectric studies. The position of this peak remained almost constant in all the liquid phases with increasing temperature. The temperature variation of this peak position was also studied on heating the sample which was initially in its stable CP phase rather than metastable PP phase. Again a totally symmetric singlet peak was observed in the whole temperature range of the CP phase. The variation of this peak position with temperature is shown in Fig. 10b. The clear match between peak positions in the CP phase with temperature for both cases signifies that the PP phase transformed to the CP phase at 312 K on heating.
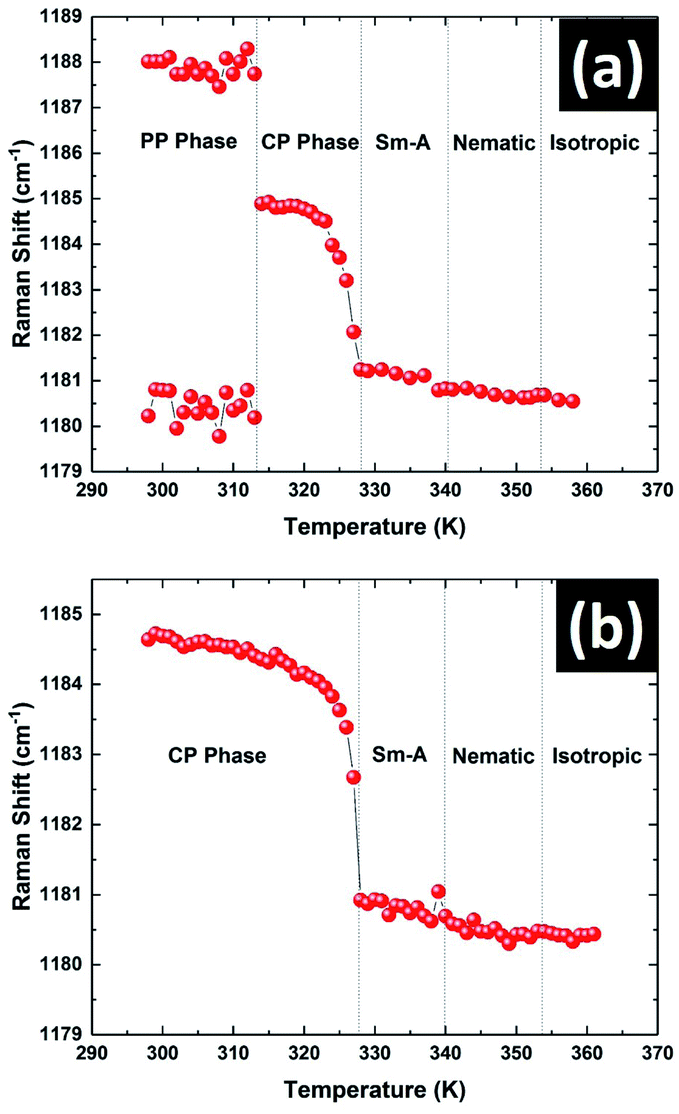 | ||
| Fig. 10 The temperature variation of the 1185 cm−1 peak position of 8OCB on heating the sample (a) from the metastable PP phase and (b) from the stable CP phase. | ||
The position of the peak near 1284 cm−1 showed a small jump across the PP to CP transition. While near the CP to smectic phase transition, this peak position gradually changed towards higher Raman shift in the pre-transitional temperature range and it was continued until the complete melting of CP phase. In liquid phases this peak did not show any change in its position. The Raman peak near 1605 cm−1 was asymmetric in nature for both PP and CP phases. This peak was symmetric in the liquid phases and the position of the peak remained constant with temperature.
The position of the peak at about 2234 cm−1 associated with the CN stretching vibration is quite sensitive to the electron density of the CN group.5 This electron density depends on the local molecular environment around the CN group in different phases of 8OCB and hence is sensitive to these phases. The CN stretching vibration gave rise to a symmetric singlet peak at 2230 cm−1 in the PP phase. The closer proximity between the CN group of a molecule with the biphenyl moiety of the neighbouring molecule in the monoclinic structure of PP phase manifests itself in giving rise to this peak.10 This peak became asymmetric in the CP phase and was fitted with a prominent strong peak and a weak satellite peak at slightly lower Raman shift than the strong peak (see Fig. S4 in ESI†). This CN peak again became a singlet symmetric peak at 2227 cm−1 in liquid phases with the peak position remaining almost constant on increasing temperature. The molecular environment of the CN group is different in the amorphous and crystalline components of the CP phase giving rise to slightly different peak positions. Hence the doublet nature of the CN peak in the CP phase can be attributed to the heterogeneous nature of this phase. The fitted strong and weak peaks are associated with the nano-crystalline and amorphous components of the CP phase respectively. This was inferred from the pre-transitional variation of these peaks near the CP to smectic phase transition as shown in Fig. 11. The intensity and position of the strong peak remained almost constant with increasing temperature in the pre-transitional range and it disappeared on melting of the nano-crystallites at Tc. On the other hand, the intensity and the position of the weak peak started to change in this temperature range due to the transformation of the amorphous component to smectic below Tc and only this peak remained after transition to the smectic phase at Tc.
 | ||
| Fig. 11 The temperature variation of the Raman peak profile associated with the CN stretching vibration of 8OCB molecules in the pre-transitional temperature range of CP phase during heating the sample. ΔT = T − Tc denotes temperature difference from the complete melting temperature of CP phase. | ||
4 Conclusions
Two different crystalline states of 8OCB are observed on cooling the sample from its melt. One of them is the metastable long parallelepiped or PP crystal phase. The other one is the stable crystal phase known as the commercial powder or CP phase. The metastable PP phase transforms to the stable CP phase on aging at room temperature or by heating it above 312 K. Though the PP phase is a homogeneous crystal phase, the SEM studies show that the stable CP phase is actually heterogeneous in nature with two sub-phases coexisting together. Here numerous fibrillar nano-crystallites are found to be embedded in an amorphous matrix. The XRD studies on the CP phase show that the fibrillar nano-crystallites have monoclinic lattice structure while no lattice structure is found corresponding to the amorphous component. This signifies that there is no long range positional order in the amorphous component of the CP phase. The CP phase shows a prominent pre-transitional effect close to its melting point during heating. This effect arises due to the transition of the amorphous part of the CP phase that starts before the melting point of the nano-crystallites at 327.5 K. Such coexistence of crystalline and amorphous states is generally observed for large molecular weight polymeric systems or in mixtures of incompatible molecules.25,26 The coexistence of nano-crystallites and the amorphous phase in the stable ground state has not been observed for this type of small-molecular-weight liquid crystals. We attribute this behaviour to the strong dipole moment of the 8OCB molecules. This strongly polar 8OCB compound is known to exhibit a reentrant nematic phase below its smectic phase under high pressure or in suitable mixtures with 6OCB.3,4 Thus, it is our expectation that this amorphous component may be the frozen reentrant nematic phase. We are unable to isolate the amorphous component of the CP phase to clearly identify its structure. Further experiments are required to reveal the detailed structure of the CP phase and the possible origin of the heterogeneous ground state.Conflicts of interest
There are no conflicts to declare.Acknowledgements
We acknowledge Ms Vashudha K. N. for her help in acquiring XRD data and K. M. Yatheendran for his help in SEM imaging.Notes and references
- E. Brini, C. J. Fennell, M. Fernandez-Serra, B. Hribar-Lee, M. Lukšič and K. A. Dill, Chem. Rev., 2017, 117, 12385–12414 CrossRef CAS.
- K. A. Sharp, in Water: Structure and Properties, American Cancer Society, 2001 Search PubMed.
- P. E. Cladis, D. Guillon, F. R. Bouchet and P. L. Finn, Phys. Rev. A: At., Mol., Opt. Phys., 1981, 23, 2594–2601 CrossRef CAS.
- P. E. Cladis, R. K. Bogardus, W. B. Daniels and G. N. Taylor, Phys. Rev. Lett., 1977, 39, 720–723 CrossRef CAS.
- K. Hori, M. Kuribayashi and M. Iimuro, Phys. Chem. Chem. Phys., 2000, 2, 2863–2868 RSC.
- L. M. Babkov, O. V. Gorshkova, E. V. Gabrusyonok, G. A. Puchkovskaya and I. N. Khakimov, J. Struct. Chem., 1995, 36, 739–746 CrossRef.
- P. E. Cladis, R. K. Bogardus and D. Aadsen, Phys. Rev. A: At., Mol., Opt. Phys., 1978, 18, 2292–2306 CrossRef CAS.
- Y. Yamamura, R. Tsuchiya, S. Fujimura, M. Hishida and K. Saito, J. Phys. Chem. B, 2017, 121, 1438–1447 CrossRef CAS.
- G. J. Brownsey and A. J. Leadbetter, Phys. Rev. Lett., 1980, 44, 1608–1611 CrossRef CAS.
- K. Hori, M. Kurosaki, H. Wu and K. Itoh, Acta Crystallogr., Sect. C: Cryst. Struct. Commun., 1996, 52, 1751–1754 CrossRef.
- P. de Gennes and J. Prost, The Physics of Liquid Crystals, Clarendon Press, 1993 Search PubMed.
- L. Walz, Î. Paulus and W. Haase, Z. Kristallogr. Cryst. Mater., 1987, 180, 97–112 CrossRef CAS.
- K. Hori, Y. Koma, M. Kurosaki, K. Itoh, H. Uekusa, Y. Takenaka and Y. Ohashi, Bull. Chem. Soc. Jpn., 1996, 69, 891–897 CrossRef CAS.
- K. Hori, Y. Koma, A. Uchida and Y. Ohashi, Mol. Cryst. Liq. Cryst. Sci. Technol., Sect. A, 1993, 225, 15–22 CrossRef CAS.
- P. Mandal and S. Paul, Mol. Cryst. Liq. Cryst., 1985, 131, 223–235 CrossRef CAS.
- K. Hori, Liq. Cryst., 1999, 26, 37–43 CrossRef CAS.
- J. Tanno, K. Itoh, A. Tsuji and K. Hori, J. Mol. Struct., 1996, 379, 121–134 CrossRef CAS.
- K. Hori, Y. Iwai, M. Yano, R. Orihara-Furukawa, Y. Tominaga, E. Nishibori, M. Takata, M. Sakata and K. Kato, Bull. Chem. Soc. Jpn., 2005, 78, 1223–1229 CrossRef CAS.
- A. Jakli, I. Janossy and A. Vajda, Liq. Cryst., 2000, 27, 1035–1038 CrossRef CAS.
- P. Wu and W. Lee, Appl. Phys. Lett., 2013, 102, 162904 CrossRef.
- J. Jiang, E. Zhuravlev, Z. Huang, L. Wei, Q. Xu, M. Shan, G. Xue, D. Zhou, C. Schick and W. Jiang, Soft Matter, 2013, 9, 1488–1491 RSC.
- J. Jadżyn and G. Czechowski, Liq. Cryst., 1989, 4, 157–163 CrossRef.
- K. Merkel, R. Wrzalik and A. Kocot, J. Mol. Struct., 2001, 563–564, 477–490 CrossRef CAS.
- R. Mishra, A. Bhattacharjee, D. Bhattacharjee, K. N. Singh, B. Gogoi and P. R. Alapati, Liq. Cryst., 2018, 45, 1333–1341 CrossRef CAS.
- H. D. Keith and F. J. Padden, J. Appl. Phys., 1963, 34, 2409–2421 CrossRef CAS.
- C. Wang, R. Thomann, J. Kressler, Y. Thomann, K. Crämer, B. Stühn, P. Svoboda and T. Inoue, Acta Polym., 1997, 48, 354–362 CrossRef CAS.
Footnote |
| † Electronic supplementary information (ESI) available. See DOI: 10.1039/d0ra08543j |
| This journal is © The Royal Society of Chemistry 2021 |