 Open Access Article
Performance of the highly sensitive humidity sensor constructed with nanofibrillated cellulose/graphene oxide/polydimethylsiloxane aerogel via freeze drying
Yutong Yang,
Guoting Su,
Qilin Li,
Zipiao Zhu,
Shaoran Liu,
Bing Zhuo,
Xinpu Li,
Pu Ti and
Quanping Yuan *
*
School of Resources, Environment and Materials, Guangxi University, Nanning 530004, China. E-mail: yuanquanping@gxu.edu.cn
First published on 5th January 2021
Abstract
A kind of capacitive humidity sensor with high sensitivity constructed with nanofibrillated cellulose (NFC), graphene oxide (GO) and polydimethylsiloxane (PDMS) is presented in this work, via a simple ultrasonic dispersion and freeze drying technology. The NFC and GO with a strong adsorption for water molecules were used as a substrate for the promotion of capacitive response of the humidity sensor. Moreover, anhydrous ethanol was added to inhibit the generation of big cracks in the humidity sensor in the freeze drying process, so as to obtain a regular network porous structure, then providing a great deal of conduction channels and active sites for molecular water. Also, the addition of PDMS can effectively enhance the flexibility and stability of its porous structure. The results confirmed that the humidity sensor with 30 wt% GO showed an excellent humidity sensitivity (6576.41 pF/% RH), remarkable reproducibility, low humidity hysteresis characteristic in 11–97% relative humidity (RH) at 25 °C, and short response/recovery times (57 s/2 s). In addition, the presented sensor exhibited small relative deviation of the measured relative humidity value compared with the commercial hygrometer. The realization of the high sensitivity can be attributed to the theories about interaction of the hydrophilic group, proton transfer of water molecules and the three-dimensional network transport structure model. Therefore, the NFC/GO/PDMS humidity sensor finally realizes stable, reproducible and fast humidity sensing via an eco-friendly process, exhibiting promising potential for wide practical application.
Introduction
With the development of an intelligent modern society, humidity sensors are widely used in multifarious fields such as environmental monitoring,1 automobile defogging,2 production line,3 respiratory monitoring,4–6 medical care,7 agriculture and forestry breeding,8 meteorological detection,9 food logistics and transportation,10 and wearable flexible equipment.11 As a precision instrument for humidity measurement, it is highly vital for a humidity sensor to satisfy higher requirements for its accuracy, sensitivity, excellent stability and compatibility. However, for traditional humidity sensors there exist some challenges such as low sensitivity, lag response and insufficient sensing efficiency.12 Therefore, the development of flexible, efficient and green humidity sensitive materials becomes the theme for the future development of humidity sensors.Humidity sensors can detect humidity via sensing the change of electrical signal induced by the absorption or desorption of water molecules in the tested environment. Up to now, a variety of metal oxides,13 organic polymers,14 and carbon materials15 were used to prepare resistance type,16 capacitance type,8 optical fiber type,17 quartz crystal microbalance type3 and other types of humidity sensors. Graphene oxide (GO), nanofibrillated cellulose (NFC) and polydimethylsiloxane (PDMS) are extensively introduced in humidity sensing due to their unique properties. As a multifunctional derivative of graphene, GO is rich in hydrophilic groups (such as hydroxyl (–OH) and carboxyl (–COOH)), and has a large specific surface area. It has a high degree of participation in the construction of two-dimensional or three-dimensional network structure, which can provide a large number of active sites to absorb water molecules, greatly improving its humidity sensing characteristics and becoming a potential sensor material.18–20 In recent years, there were many reports related to the development of GO-based humidity sensor. For example, Xuan et al. prepared flexible humidity sensor with GO sensing layer that possessed high sensitivity and response speed via dropping casting.21 Another humidity sensitive polymer material made of GO, Nafion and In2O3, also presents high sensitivity, good stability and rapid response (70 s).22 To further improve response speed of humidity sensor, Zhang et al. proposed to develop a super sensitive GO/SnS2 humidity sensor on a flexible substrate,23 obtaining outstanding response (0.9 s) and recovery (10 s) performance, as well as excellent reproducibility.23
As a renewable and natural biomass polymer, nanocellulose has the advantages of biodegradability, excellent mechanical strength, large specific surface area, and self-assemble performance. It is also a good surfactant, which can enhance the dispersion and compatibility of carbon materials.4 Due to the hydrophilic groups such as –OH and –COOH on cellulose molecules,24 cellulose are more sensitive to temperature and humidity. A polymer film compounded by NFC, reduced graphene oxide (rGO) and polyvinyl alcohol (PVA), exhibited better humidity sensing performance compared to PVA/rGO film without NFC.25 Thus, the characteristics of nanocellulose make it have great potential in sensor applications, especially in humidity sensing.26–28 Besides, Yao et al. developed another nanocellulose based quartz crystal microbalance (QCM) humidity sensor with asymmetric structure, presenting the characteristics of short response/recovery time (60 s/15 s), low humidity hysteresis (7.3% RH), and excellent long-term stability.29 Combining polypyrrole and nanocellulose is to obtain humidity sensor with good humidity sensitivity, remarkable linearity and superior reversibility.30 A large number of studies had proved that specific surface area and number of hydrophilic groups of the sensing material have a great impact on its sensitivity, response speed, humidity hysteresis performance and long-term stability.29 Therefore, the development of highly sensitive, highly stable and environment-friendly humidity sensor with nanocellulose has a great prospect.
However, a single sensing material still has certain defects in the response performance of the sensor in the high relative humidity range.31 Our work proposed to use ultrasonic dispersion and vacuum freeze drying method to install NFC/GO/PDMS aerogel with abundant three-dimensional porous structure on the flexible interdigital electrode to prepare a new kind of NFC/GO/PDMS humidity sensor. The use of NFC and GO with numbers of hydrophilic groups attracting more water molecules can increase the response of sensor.32 Moreover, previous researches had pointed out that the enhancement of interfacial interaction can change the dielectric properties of composite materials.32,33 So the interaction among NFC, GO and PDMS will lead to changes in its dielectric properties and the promotion of capacitive response. Especially, a certain amount of anhydrous ethanol was added into the dispersion system of NFC and GO, by which the cracks in NFC/GO/PDMS can be reduced in the freeze drying process.34 The imposed small amount of PDMS had also enhanced connects among NFC and GO, by which the three-dimensional porous network structure became more stable and the adhesion of the aerogel on the electrode was further strengthened, so as to obtain remarkable reproducibility. Hence, the presented method will further elevate the performance of the capacitance humidity sensor for wide and practical application.
Experimental
Material
The GO dispersion (2 mg mL−1) was obtained from Suzhou Tanfeng Graphene Technology Co., Ltd. (Suzhou, China). The NFC dispersion (1.08 wt%) was supplied by Tianjin Woodelf Biotechnology Co., Ltd. (Tianjin, China). Anhydrous ethanol was purchased from Chengdu Chron Chemicals Co., Ltd. (AR; Chengdu, China). Polydimethylsiloxanes (Sylgard184, PDMS) were prepared by Dow Corning Co., Ltd. Flexible interdigital electrode (IDE; width, length, thickness: 5 mm × 10 mm × 0.1 mm), is made of polyethylene terephthalate (PET) substrate plated with metal copper/nickel/gold, and the interdigital gap and width are 100 μm, as well as the effective area is 25 mm2.Preparation of NFC/GO/PDMS aerogel and humidity sensor
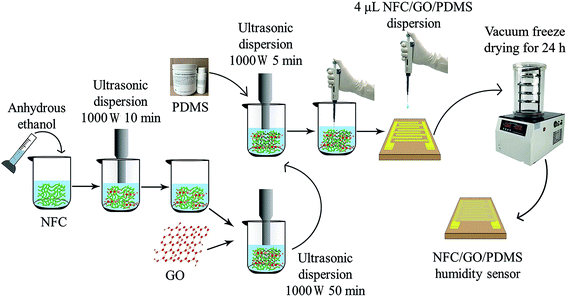
The NFC/GO/PDMS aerogel and humidity sensor were prepared via follow process. First, after weighting 24 mg NFC in a beaker, 1.7 mL anhydrous ethanol and 1.7 mL deionized water were added in that to mix sufficiently. Then the mixture was treated using an ultrasonic cell breaker (TL-1200Y, Jiangsu Tenlin Instrument Co., Ltd., Yancheng, China) for 10 min under the power of 1000 W. Follow by 6 mL GO dispersion (GO content of 30 wt%) was blended into the above mixture with ultrasound treatment for 50 min under the power of 1000 W. After that, 4 mg PDMS was uniformly mingled with the mixture. Sequentially, the mixture dispersion was disposed for 5 min via ultrasonication under 1000 W. Hereto, NFC/GO/PDMS composite dispersion with a certain mass ratio was obtained.The 4 μL composite dispersion was dropped on the flexible interdigital electrode through a micro pipette, and then was spread over its effective interdigital area. Successively, the treated interdigital electrode was put into the vacuum freeze dryer (Fd-1A-50, Jiangsu Tenlin Instrument Co., Ltd., Yancheng, China) to freeze for 3 h and then vacuum dry for 24 h. Finally, the prepared humidity sensor was gained. The specific process is shown in Fig. 1. The humidity sensors with different GO contents (10 wt%, 20 wt%, 30 wt%, and 40 wt%) were fabricated by referring to the above method. In which, the NFC/GO/PDMS composite dispersion had the controlled concentration of 3.5 mg mL−1 (the content of NFC changed with the content of GO, and the addition amount of PDMS was controlled at 10 wt%). Their humidity sensing performance and mechanism were studied.
Meanwhile, the above remaining composite dispersion after sucked to prepare sensor, was put into a Petri dish (disk shape, 55 mm in diameter) and a small beaker (cylinder shape; 22 mm × 22 mm × 25 mm), respectively. The two shape of the aerogel were formed after dried using the same vacuum freeze drying process. The obtained NFC/GO/PDMS aerogel were taken to investigate their surface morphology, density, flexibility and chemical properties.
Humidity sensing measurement
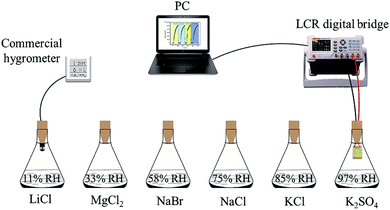
The humidity sensing performance was tested by exposing the prepared sensor in measurement space with various relative humidity which are provided by using saturated salt solution of LiCl (11% RH), MgCl2 (33% RH), NaBr (58% RH), NaCl (75% RH), KCI (85% RH) and K2SO4 (97% RH) under the room temperature of 25 °C. The output capacitance value of the sensor was measured through LCR digital bridge (4091 C; Double King Industrial Holdings Co., Ltd., Shenzhen, China) under the certain temperature and different humidity conditions at the frequency of 100 Hz. The test device is shown in Fig. 2. A commercial hygrometer (AS847, ±3% RH; ARCO Electronics Co., Ltd., Guangzhou, China) was also applied to test the humidity of environment for reducing the test error. Sensitivity, response/recovery time and humidity hysteresis are important indexes to evaluate performance of the sensor. Here, the ratio of capacitance difference and humidity difference under a certain humidity condition is defined as the sensitivity (S), S = (Cx − C0)/(RH97 − RH11). The response time is defined as the required time when capacitance change of the sensor reaches 90% of the value of |Cx − C0|. And the recovery time refers to the time from the response equilibrium state back to initial state. Specifically, the capacitance value of the sensor at 11% RH was defined as the initial capacitance C0, and Cx represent the capacitance value at 97% RH.The reproducibility of the sensor with 30 wt% GO was tested, in which it was exposed to the humidity firstly at 11% RH then at 58% RH, 75% RH and 85% RH successively for four times, respectively. At 11% RH, the sensor was exposed for about 150 s each time. Besides, a longer test time to 500 s was performed at the 58% RH, 75% RH and 85% RH for ensuring that the sensor can attain to the steady state.
Humidity hysteresis of the sensor was evaluated in the stage of absorption and desorption. The sensor was exposed firstly from 11% RH to 97% RH, and then from 97% RH back to 11% RH, continuously. Capacitance value was recorded when the sensor achieved the steady state at each relative humidity.
Characterization analysis
The appearance of NFC/GO/PDMS aerogel was photographed with digital camera to evaluate its appearance. Scanning electron microscope (SEM; S-3400N type; Hitachi, Japan) was employed to observe morphology of GO, NFC and NFC/GO/PDMS aerogel. Fourier transform infrared spectrometer (FT-IR; Nicolet iS50; Thermo Fisher Scientific, Inc., USA) was used to analyze GO, NFC and NFC/GO/PDMS aerogel, recording the corresponding spectrum in the wave number range of 400–4000 cm−1. And the XPS spectrum of the aerogel was recorded by using X-ray photoelectron spectroscopy (XPS; ESCALAB 250XI+, Thermo Fisher Scientific, Inc., USA). It was noted that the aerogel was opened for 24 h in the same environment (25 °C, 60 ± 3% RH) before the test.Density and porosity test
The density of the aerogel is closely related to its pore structure and specific surface area. Their density was calculated via dividing their mass by volume. The porosity of NFC/GO/PDMS aerogel was estimated according to eqn (1):
 | (1) |
Flexibility test
The compression test was carried out to explore the flexibility of NFC/GO/PDMS aerogel. The height of the aerogel with cylinder shape was firstly pressed down by 50% with binder plate, and then the binder plate was immediately picked up. After 1 min, its recovery process and recovery state were observed and evaluated.Result and discussion
Morphology analysis
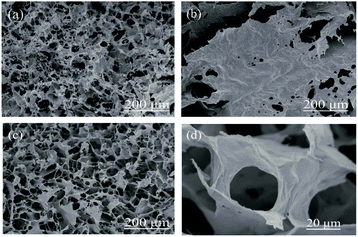
It is easy to form ice crystals in the process of vacuum freeze drying,35,36 so cracks and gaps frequently appear in the NFC/GO/PDMS aerogel, which can reduce the uniformity and consistency of the three-dimensional porous network structure. It is not conducive to the absorption of water molecules. The addition of moderate anhydrous ethanol can prevent the generation of big cracks and gaps, which had been indicated in the existing research on rGO/carbon nanotube (CNT) sponge foam.34 As seen in Fig. 3a and b, the aerogel with anhydrous ethanol exhibited smooth surface in which the porous network structure was well distributed, while there were many big cracks and gaps on the surface of the aerogel without anhydrous ethanol (Fig. 3c and d). The overall structure was relatively loose, as well as the structure uniformity of three-dimensional porous network was poor. Compared with other materials prepared by vacuum freeze drying technology,37,38 the aerogel obtained a smoother and more complete surface which can promote conduction of water molecular and thus will improve humidity sensitivity.39 Besides, the orderly morphology and structure also can be seen in the cylinder samples shown from Fig. 4.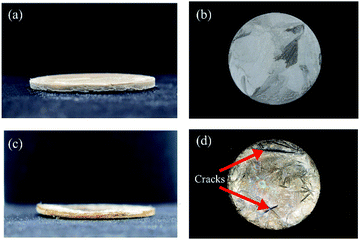 | ||
| Fig. 3 Appearance of NFC/GO/PDMS aerogel in disk shape (a and b) added with anhydrous ethanol and (c and d) without anhydrous ethanol. | ||
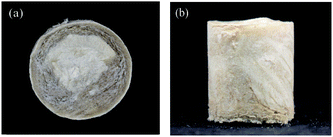 | ||
| Fig. 4 Appearance on (a) top surface and (b) side face of NFC/GO/PDMS aerogel in cylinder shape added with anhydrous ethanol. | ||
As shown from Fig. 5, a big lamellar structure was formed in the GO aerogel (Fig. 5b) by the aggregation of thin and plicated sheets.23 The obvious porous structure existed in the NFC aerogel along with much more flake pore wall shown in Fig. 5a. The NFC/GO/PDMS aerogel with 30 wt% GO (Fig. 5c) exhibited more orderly and uniform porous structure, in which NFC and GO cross-linked with each other. The structure would obtain accessible surface area and attract more water molecules.40 In addition, Fig. 5d shows clear pore structure, which has sheet wall extending along the length of the oriented pore canal. This kind of porous network structure provides excellent ion diffusion channels and large active contact area,41 which is of great significance to improve response sensitivity of the humidity sensor.
Chemical characterization analysis
Fig. 6a shows the FT-IR spectrum of the GO, NFC and NFC/GO/PDMS aerogel with 30 wt% GO. A strong absorption peak around the 3449 cm−1 was observed in the GO spectrum due to the stretching vibration of –OH group. In addition, the other characteristic peaks of GO appeared at 1637 cm−1, 1386 cm−1 and 615 cm−1, respectively, corresponding to C![[double bond, length as m-dash]](https://www.rsc.org/images/entities/char_e001.gif) C, C–OH and C
C, C–OH and C![[double bond, length as m-dash]](https://www.rsc.org/images/entities/char_e001.gif) O groups.18,23 For the pure NFC, the absorption peaks at 3449 cm−1, 2928 cm−1, 1633 cm−1, 1426 cm−1, 1028 cm−1 and 898 cm−1 are attributed to –OH stretching vibration, –CH stretching vibration, H–O–H stretching vibration, –CH2 bending vibration, C–O–C stretching and C1–H deformation vibrations, respectively.42,43 According to the spectrum of NFC/GO/PDMS, there are also characteristic absorption peaks of the pure GO and NFC. However, the absorption peak of the –OH group shift to the lower wavenumber of 3347 cm−1 compared to that at 3449 cm−1 of pure NFC and GO, indicating the formation of strong hydrogen bonding in the aerogel.44–49 After the addition of a small amount of PDMS, there is another strong absorption peak of Si–O–Si at 1054 cm−1, and the absorption peak at 796 cm−1 is assigned to the action of Si–C groups.50,51 In summary, the aerogel contains some oxygen-containing groups such as C–OH, C
O groups.18,23 For the pure NFC, the absorption peaks at 3449 cm−1, 2928 cm−1, 1633 cm−1, 1426 cm−1, 1028 cm−1 and 898 cm−1 are attributed to –OH stretching vibration, –CH stretching vibration, H–O–H stretching vibration, –CH2 bending vibration, C–O–C stretching and C1–H deformation vibrations, respectively.42,43 According to the spectrum of NFC/GO/PDMS, there are also characteristic absorption peaks of the pure GO and NFC. However, the absorption peak of the –OH group shift to the lower wavenumber of 3347 cm−1 compared to that at 3449 cm−1 of pure NFC and GO, indicating the formation of strong hydrogen bonding in the aerogel.44–49 After the addition of a small amount of PDMS, there is another strong absorption peak of Si–O–Si at 1054 cm−1, and the absorption peak at 796 cm−1 is assigned to the action of Si–C groups.50,51 In summary, the aerogel contains some oxygen-containing groups such as C–OH, C![[double bond, length as m-dash]](https://www.rsc.org/images/entities/char_e001.gif) O, H–O–H, C–O–C and Si–O–Si, which can effectively improve its adsorption effect to water molecules.52–54
O, H–O–H, C–O–C and Si–O–Si, which can effectively improve its adsorption effect to water molecules.52–54
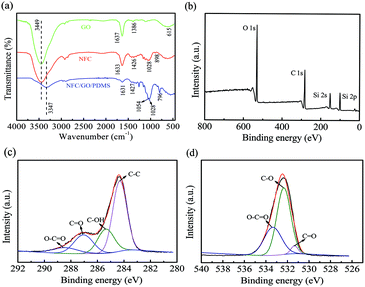 | ||
| Fig. 6 (a) FT-IR spectra of GO, NFC, NFC/GO/PDMS aerogel with 30 wt%; XPS spectra of NFC/GO/PDMS aerogel with 30 wt% GO: (b) survey spectrum, (c) C 1s spectrum and (d) O 1s spectrum. | ||
Similar results are also found from XPS analysis in Fig. 6b–d. It can be clearly seen that C and O are the main elements of the NFC/GO/PDMS aerogel with 30 wt% GO (Table 1). At the same time, there is also a small amount of Si element due to the addition of PDMS to enhance mechanical properties and adhesion force of the aerogel. Moreover, the C 1s spectrum is shown in Fig. 6c. The four types of carbon with different chemical states located at 284.3 eV, 286.4 eV, 287.1 eV and 288.6 eV, corresponding to C–C, C–OH, C![[double bond, length as m-dash]](https://www.rsc.org/images/entities/char_e001.gif) O and O–C
O and O–C![[double bond, length as m-dash]](https://www.rsc.org/images/entities/char_e001.gif) O groups, respectively.25 As well as in Fig. 6d, three strong peaks can be observed in the O 1s spectrum, located at 531.2 eV, 532.3 eV and 533.4 eV, respectively, which are related to C
O groups, respectively.25 As well as in Fig. 6d, three strong peaks can be observed in the O 1s spectrum, located at 531.2 eV, 532.3 eV and 533.4 eV, respectively, which are related to C![[double bond, length as m-dash]](https://www.rsc.org/images/entities/char_e001.gif) O, C–O and O–C
O, C–O and O–C![[double bond, length as m-dash]](https://www.rsc.org/images/entities/char_e001.gif) O groups.31 The aerogel has similar groups to other existed GO composite humidity sensitive material, which had been proved that it has certain humidity sensitive characteristics.24,25
O groups.31 The aerogel has similar groups to other existed GO composite humidity sensitive material, which had been proved that it has certain humidity sensitive characteristics.24,25
| Element | Content (at%) |
|---|---|
| Carbon | 59.61 |
| Oxygen | 40.39 |
Density and flexibility analysis
It is found from Table 2 that the density of NFC/GO/PDMS aerogel is as small as 5.23 kg m−3, which indicates that the aerogel has high porosity and specific surface area. The porosity of the aerogel is about 99.6% based on eqn (1). In general, the results demonstrated that the aerogel has low density and porous structure, providing a large amount of open channels (SEM results in Fig. 5c and d). This structure increases the interaction surface area and facilitates the entry and exit of water molecules to enhance the sensitivity of sensor.55| Sample 1# | Sample 2# | Average value | |
|---|---|---|---|
| Quality (g) | 0.0546 | 0.0529 | 0.0538 |
| Volume (cm3) | 9.90 | 10.67 | 10.29 |
| Density (kg m−3) | 5.52 | 4.96 | 5.23 |
It is found from Fig. 7 that the NFC/GO/PDMS aerogel has good flexibility through the elastic test on the cylinder sample. After the height of the aerogel was pressed down by 50%, it shrunk significantly at cylindrical surface. When the pressure was released, the aerogel almost entirely returned to its original appearance, and the height was basically the same to that before the compression. The found flexibility indicates its flexible skeleton and pore channel for sensing, by which its porous network structure can keep stable even that water molecules eroded in its inner structure when stated in a high humidity atmosphere. The good flexibility as well as the stability could endow the sensor more suitable for actual detection,56 and make it have more advantages in the application of wearable devices and flexible electronic instruments.
Humidity sensing performance
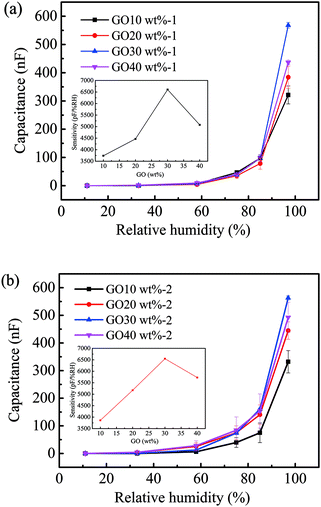
The NFC/GO/PDMS humidity sensor can absorb and desorb water molecules rapidly with the changing of the environment humidity, resulting in the change of the output capacitance. Fig. 8a and b shows that output capacitance of the sensor increased with the increase of relative humidity in the range of 11–97% RH, which exhibited a certain of regularity. Specifically, output capacitance of the sensor with 30 wt% GO increased from 11.71 pF to 565![[thin space (1/6-em)]](https://www.rsc.org/images/entities/char_2009.gif) 583.33 pF in the humidity range of 11% RH to 97% RH.
583.33 pF in the humidity range of 11% RH to 97% RH.
Appropriate amount of GO promotes the humidity sensitivity of the sensor.31 The sensitivity of sensor increased with raising the content of GO from 10 wt% to 30 wt%. The addition of 30 wt% GO gained a higher capacitance output value and sensitivity. As seen the microstructure of the aerogel with 30 wt% GO from Fig. 5c and d, GO and NFC cross-link to form a neat and orderly three-dimensional porous structure, which is conducive to the permeation of water molecules. Thus, the sensor can acquire capacitance change signals timely. However, excessive GO could result in that agglomeration and restack occurred on the surface of the aerogel (Fig. 5b), by which the effective surface area was reduced,57 thus decreased the capacitance output value and the sensitivity of the sensor. Notably, the aerogel sample became shapeless and vulnerable as adopting the content from 50 wt% to 90 wt% of GO. When the content of NFC was gradually reduced, acting as binder and substrate, the structure of aerogel was weakened. Specifically, sensitivity of the sensor with 30 wt% GO was calculated as high as 6576.41 pF/% RH, while the reported capacitance sensors had sensitivity of −9.5 fF/% RH,58 46.25 pF/% RH,59 1061.6 pF/% RH,60 1552.3 pF/% RH,61 1604.89 pF/% RH,62 and 1670.3 pF/% RH.63
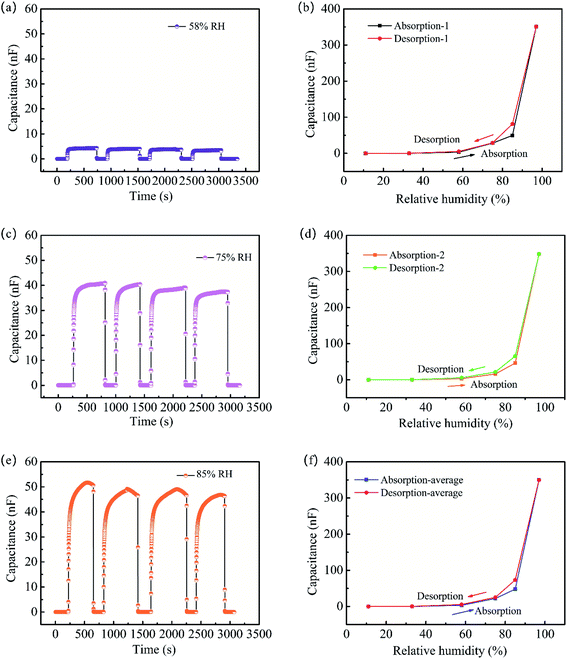
Fig. 9a, c and e indicates the excellent reproducibility of NFC/GO/PDMS humidity sensor. The stable output capacitance of the sensor with 30 wt% GO was demonstrated even it was exposed to various humidity for four times. It also can be seen in Fig. 9a, c and e that the output capacitance of the sensor was up to 4286 pF (58% RH), 38![[thin space (1/6-em)]](https://www.rsc.org/images/entities/char_2009.gif) 113 pF (75% RH), and 49
113 pF (75% RH), and 49![[thin space (1/6-em)]](https://www.rsc.org/images/entities/char_2009.gif) 108 pF (85% RH), correspondingly. The good reproducibility of the sensor makes it possible to provide stable humidity detection in practical applications.
108 pF (85% RH), correspondingly. The good reproducibility of the sensor makes it possible to provide stable humidity detection in practical applications.
Humidity hysteresis is an important performance index for humidity sensor.64 Fig. 9b, d and f shows the humidity hysteresis curve of NFC/GO/PDMS humidity sensor with 30 wt% GO in the humidity range of 11–97% RH, reflecting that the sensor had a low hysteresis characteristic. Desorption curve of the sensor was slightly lagged behind its adsorption curve in the range of 75–85% RH. In the adsorption process, water molecules were firstly adsorbed on surface of the aerogel sensitive layer via the interaction with carboxyl, hydroxyl and other hydrophilic groups.65 But the adsorbed water molecules are difficult to release for the effect of hydrogen bonding in the dehumidification stage, so the water molecules are partly remained in the inner structure of NFC/GO/PDMS aerogel,66 resulting in desorption lag. It also can be seen from the Fig. 9b, d and f that the maximum humidity hysteresis occurred in the humidity of 85% RH.
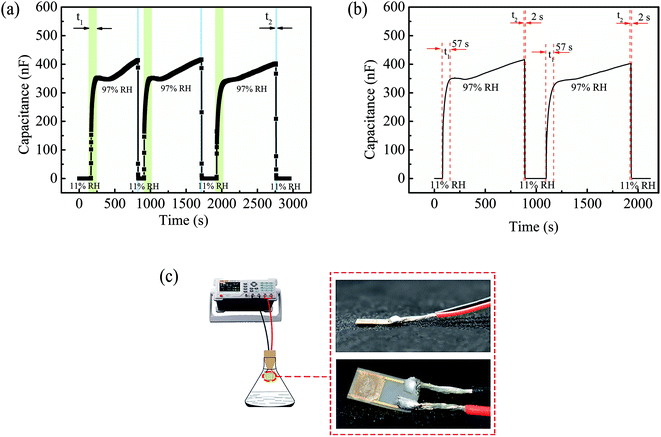
Response/recovery time reflects the speed of dynamic output response of humidity sensor.64 Fig. 10a and b shows the response/recovery time curve of the sensor with 30 wt% GO between the test humidity of 11% RH and 97% RH, in which the response time was 57 s and the recovery time was 2 s even the test were repeated multiple times. The recovery speed of this sensor was faster than other existed sensors.59,60,62
In addition, the performance of some reported sensors are also listed specifically in Table 3 for the comparison. Response time of the presented sensor was slightly longer, which need to be further improved in the future. The appearance of the humidity sensor with high sensitivity can be clearly seen in Fig. 10c.
| No. | Sensing material | Dry method | The test humidity range | Sensitivity | Response/recovery time | Ref. |
|---|---|---|---|---|---|---|
| 1 | GO | Baked for 2 h in the baking oven at 50 °C | 25–65% RH | −9.5 fF/% RH | 5 s/no mention of recovery time | 58 |
| 2 | GO | Dried in an air oven | 15–95% RH | 46.25 pF/% RH | 10.5 s/41 s | 59 |
| 3 | GO/In2O3 | Vacuum drying in an oven | 11–97% RH | 1061.6 pF/% RH | 15 s/2.5 s | 60 |
| 4 | GO/PDDA | Dried in the oven at 50 °C for 2 h | 11–97% RH | 1552.3 pF/% RH | 61 | |
| 5 | RGO/SnO2 | Vacuum drying in an oven | 11–97% RH | 1604.89 pF/% RH | 102 s/6 s | 62 |
| 6 | GO/PPy | Dried naturally | 11–97% RH | 1670.3 pF/% RH | 63 | |
| 7 | NFC/GO/PDMS | Vacuum freeze drying | 11–97% RH | 6576.41 pF/% RH | 57 s/2 s | Our work |
Exponential growth relationship between the capacitance and relative humidity was found via fitting analysis shown in Fig. 11a. The fitted relationship of NFC/GO/PDMS humidity sensor-1 and NFC/GO/PDMS humidity sensor-2 were described as that lg![[thin space (1/6-em)]](https://www.rsc.org/images/entities/char_2009.gif) y1 = 0.05062x + 0.82714 and lg
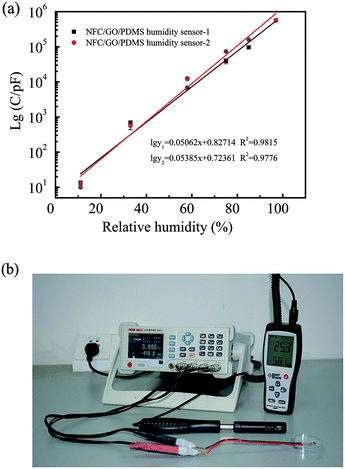
y1 = 0.05062x + 0.82714 and lg![[thin space (1/6-em)]](https://www.rsc.org/images/entities/char_2009.gif) y2 = 0.05385x + 0.72361 (y is the capacitance, pF; x is the relative humidity, % RH). Therefore, the humidity value corresponding to different electric capacity values can be calculated via the fitting equation. As shown in Fig. 11b, both the NFC/GO/PDMS humidity sensor and commercial hygrometer were put in an indoor environment (temperature 25.3 °C) to test its humidity at the same time, to evaluate practical performance of the sensor. After tested for 5 min, LCR digital bridge recorded the capacitance value (y) of 3880 pF under the stable state of the sensor. By calculating on basis of the above two fitted equations, the indoor humidity (x) indirectly measured by the presented sensor are 54.6% RH and 53.2% RH; it is 58.1% RH when it is directly tested using the commercial hygrometer. There is little relative deviation between the two test methods, indicating the practical application potential of the presented sensor.
y2 = 0.05385x + 0.72361 (y is the capacitance, pF; x is the relative humidity, % RH). Therefore, the humidity value corresponding to different electric capacity values can be calculated via the fitting equation. As shown in Fig. 11b, both the NFC/GO/PDMS humidity sensor and commercial hygrometer were put in an indoor environment (temperature 25.3 °C) to test its humidity at the same time, to evaluate practical performance of the sensor. After tested for 5 min, LCR digital bridge recorded the capacitance value (y) of 3880 pF under the stable state of the sensor. By calculating on basis of the above two fitted equations, the indoor humidity (x) indirectly measured by the presented sensor are 54.6% RH and 53.2% RH; it is 58.1% RH when it is directly tested using the commercial hygrometer. There is little relative deviation between the two test methods, indicating the practical application potential of the presented sensor.
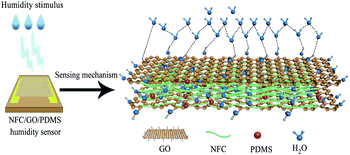
The adsorption of water molecules and oxygenated groups are closely related to the response performance of humidity sensor.67 Fig. 12 shows the humidity sensing mechanism of the NFC/GO/PDMS humidity sensor. As the sensor was stimulated by the external humidity, the NFC/GO/PDMS aerogel can physically adsorb water molecules, which will induce the change of its dielectric constant and corresponding increase of capacitance, thus make the humidity sensor respond quickly.68 It is observed from the SEM morphology that the NFC/GO/PDMS aerogel has an interconnected macroporous structure, forming a wide range of transmission channels with abundant reactive sites, which could promote the adsorption of water molecules and cause frequent protons hopping transport, so the humidity sensing performance can be enhanced.68
FT-IR and XPS spectra in Fig. 6 show that NFC/GO/PDMS aerogel contains a large amount of oxygen-containing functional groups, which play an important role in humidity sensing.69 Simultaneously, the defects of GO also increase its interlayer spacing, which helps the penetration of water molecules into internal interlayer space, ultimately improving the sensitivity of the humidity sensor.70,71
In the specific process of humidity sensing, water molecules are firstly adsorbed on the surface active sites of the aerogel through double hydrogen bonding.72,73 With the increase of relative humidity, more and more water molecules are adsorbed through single hydrogen bonding.73 The output capacitance of the humidity sensor increases gradually along with increasing the adsorption of water molecules.73 This mechanism is also appropriate to this sensor.
In summary, the sensing characteristic of the NFC/GO/PDMS humidity sensor depends on the absorption of water molecules by the porous structure with oxygen-containing functional groups on its surface.
Conclusion
In this paper, a simple and environment-friendly technology was employed to fabricate a high-sensitivity, fast-response, rapid-recovery and flexibility humidity sensor. The NFC/GO/PDMS humidity sensor has high sensitivity (6576.41 pF/% RH) and low humidity hysteresis, and presents a fast response (57 s) and recovery (2 s) behavior. In which, NFC and GO construct a uniform three-dimensional porous network structure; the addition of PDMS enhances its stability and reproducibility; the addition of anhydrous ethanol in its preparation process can effectively inhibit the generation of ice crystal to obtain a homogeneous aerogel sensing layer.There are a lot of hydrophilic groups on the surface of NFC/GO/PDMS aerogel constructed with the one and two-dimensional oxygen-containing monomer. Moreover, the three-dimensional porous network structure of the aerogel provided a great deal of conduction channels and absorption active sites for water molecular, which enabled water molecules to penetrate freely, thus greatly improving the sensitivity of the sensor. The presented NFC/GO/PDMS humidity sensor finally realizes stable, reproducible and fast humidity sensing.
Conflicts of interest
The authors declare no conflict of interest.Acknowledgements
The work was supported by the Guangxi Natural Science Foundation of China (Project No. 2017GXNSFBA198015), the National Natural Science Foundation of China (NSFC) (Project No. 31700496), the Guangxi Innovation-Driven Development Special Fund Project of China (Project No. AA17204087-18), and College Students' Innovation and Entrepreneurship Training Program of Guangxi University (Project No. 201910593051).References
- T. H. Huang, J. C. Chou, T. P. Sun and S. K. Hsiung, Sens. Actuators, B, 2008, 134, 206–212 CrossRef CAS.
- J. F. Feng, X. X. Kang, Q. Y. Zuo, C. Yuan, W. J. Wang, Y. H. Zhao, L. M. Zhu, H. W. Lu and J. Y. Chen, Sensors, 2016, 16, 314 CrossRef.
- H. Jin, X. Tao, B. Feng, L. Y. Yu, D. M. Wang, S. R. Dong and J. K. Luo, Vacuum, 2017, 140, 101–105 CrossRef CAS.
- P. H. Zhu, Y. Liu, Z. Q. Fang, Y. D. Kuang, Y. Z. Zhang, C. X. Peng and G. Chen, Langmuir, 2019, 35, 4834–4842 CrossRef CAS.
- U. Mogera, A. A. Sagade, S. J. George and G. U. Kulkarni, Sci. Rep., 2014, 4, 4103 CrossRef CAS.
- P. Jayaraman, C. Sengottaiyan and K. Krishnan, J. Nanosci. Nanotechnol., 2020, 20, 2893–2901 CrossRef CAS.
- N. Li, X. D. Chen, X. P. Chen, X. Ding and X. Y. Li, IEEE Electron Device Lett., 2015, 36, 615–617 CAS.
- L. Y. Lan, X. H. Le, H. Y. Dong, J. Xie, Y. B. Ying and J. F. Ping, Biosens. Bioelectron., 2020, 165, 112360 CrossRef CAS.
- J. Majewski, Metrol. Meas. Syst., 2017, 24, 607–616 Search PubMed.
- H. Y. Zhang and S. J. Yang, Advanced Graphic Communications and Media Technologies, 2017, vol. 417, pp. 589–598 Search PubMed.
- Y. Feng, S. J. Gong, E. W. Du, K. Yu, J. Ren, Z. G. Wang and Z. Q. Zhu, J. Mater. Chem. C, 2019, 7, 9284–9292 RSC.
- H. Farahani, R. Wagiran and M. N. Hamidon, Sensors, 2014, 14, 7881–7939 CrossRef.
- X. Zhao, X. D. Chen, X. Yu, X. Ding, X. L. Yu and K. Tang, Sens. Actuators, B, 2019, 301, 127048 CrossRef CAS.
- J. Boudaden, M. Steinmaßl, H. E. Endres, A. Drost, I. Eisele, C. Kutter and P. Müller-Buschbaum, Sensors, 2018, 18, 1516 CrossRef.
- C. Lv, C. Hu, J. H. Luo, S. Liu, Y. Qiao, Z. Zhang, J. F. Song, Y. Shi, J. G. Cai and A. Watanabe, Nanomaterials, 2019, 9, 422 CrossRef CAS.
- D. Z. Zhang, J. Tong and B. K. Xia, Sens. Actuators, B, 2014, 197, 66–72 CrossRef CAS.
- Y. Zhao, R. J. Tong, M. Q. Chen and F. Xia, Sens. Actuators, B, 2019, 284, 96–102 CrossRef CAS.
- L. Chen, Z. Li, G. S. Wu, Y. D. Wang, T. Wang, Y. Ma and B. Fei, Composites, Part A, 2018, 115, 341–347 CrossRef CAS.
- B. Liu, H. J. Sun, T. J. Peng, J. Z. Yang, Y. Z. Ren, J. Ma, G. P. Tang, L. L. Wang and S. K. Huang, Appl. Surf. Sci., 2020, 503, 144312 CrossRef CAS.
- Q. Fatima, A. A. Haidry, Z. J. Yao, Y. He, Z. Li, L. C. Sun and L. J. Xie, Nanoscale Adv., 2019, 1, 1319–1330 RSC.
- W. P. Xuan, X. L. He, J. K. Chen, W. B. Wang, X. Z. Wang, Y. Xu, Z. Xu, Y. Q. Fu and J. K. Luo, Nanoscale, 2015, 7, 7430–7436 RSC.
- D. Z. Zhang, M. Y. Wang and Z. M. Yang, Sens. Actuators, B, 2019, 292, 187–195 CrossRef CAS.
- D. Z. Zhang, X. Q. Zong and Z. L. Wu, Sens. Actuators, B, 2019, 287, 398–407 CrossRef CAS.
- H. D. Peng, L. J. Meng, L. Y. Niu and Q. H. Lu, J. Phys. Chem. C, 2012, 116, 16294–16299 CrossRef CAS.
- S. M. Xu, W. J. Yu, X. L. Yao, Q. Zhang and Q. Fu, Compos. Sci. Technol., 2016, 131, 67–76 CrossRef CAS.
- H. Golmohammadi, E. Morales-Narváez, T. Naghdi and A. Merkoçi, Chem. Mater., 2017, 29, 5426–5446 CrossRef CAS.
- K. Solin, M. Borghei, O. Sel, H. Orelma, L. S. Johansson, H. Perrot and O. J. Rojas, ACS Appl. Mater. Interfaces, 2020, 12, 36437–36448 CrossRef CAS.
- P. H. Zhu, Y. D. Kuang, Y. Wei, F. Li, H. J. Ou, F. Jiang and G. Chen, Chem. Eng. J., 2021, 404, 127105 CrossRef CAS.
- Y. Yao, X. H. Huang, B. Y. Zhang, Z. Zhang, D. Hou and Z. K. Zhou, Sens. Actuators, B, 2020, 302, 127192 CrossRef CAS.
- S. K. Mahadeva, S. Yun and J. Kim, Sens. Actuators, A, 2011, 165, 194–199 CrossRef CAS.
- S. Pongampai, P. Pengpad, R. Meananeatra, W. Chaisriratanakul, A. Poyai, M. Horprathum, C. Chananonnawathorn, W. Titiroongruang and R. Muanghlua, IEEJ Trans. Electr. Electron. Eng., 2020, 15, 965–975 CrossRef CAS.
- A. Kafy, A. Akther, M. I. R. Shishir, H. C. Kim, Y. Yun and J. Kim, Sens. Actuators, A, 2016, 247, 221–226 CrossRef CAS.
- J. K. Yuan, S. H. Yao, Z. M. Dang, A. Sylvestre, M. Genestoux and J. B. Bai, J. Phys. Chem. C, 2011, 115, 5515–5521 CrossRef CAS.
- Y. R. Son and S. J. Park, Chem. Eng. J., 2019, 373, 1020–1029 CrossRef CAS.
- S. Facq, F. Danède and B. Chazallon, J. Phys. Chem. A, 2013, 117, 4916–4927 CrossRef CAS.
- L. Xian, Y. Zhang, Y. J. Wu, X. Y. Zhang, X. Dong, J. C. Liu and A. R. Guo, Ceram. Int., 2020, 46, 1869–1875 CrossRef CAS.
- X. S. Ge, Y. N. Shan, L. Wu, X. D. Mu, H. Peng and Y. J. Jiang, Carbohydr. Polym., 2018, 197, 277–283 CrossRef CAS.
- S. M. Zhang, G. J. Liu, Y. Gao, Q. Y. Yue, B. Y. Gao, X. Xu, W. J. Kong, N. Li and W. Q. Jiang, Sci. Total Environ., 2019, 694, 133671 CrossRef CAS.
- Z. S. Xing, Y. Zheng, Z. F. Yan, Y. M. Feng, Y. Xiao, J. H. Yu, H. Y. Guan, Y. H. Luo, Z. Q. Wang, Y. C. Zhong and Z. Chen, Sens. Actuators, B, 2019, 281, 953–959 CrossRef CAS.
- X. Y. Li, X. D. Chen, X. P. Chen, X. Ding and X. Zhao, Mater. Chem. Phys., 2018, 207, 135–140 CrossRef CAS.
- S. Y. Lyu, Y. P. Chen, L. F. Zhang, S. J. Han, Y. Lu, Y. Chen, N. Yang, Z. L. Chen and S. Q. Wang, RSC Adv., 2019, 9, 17824–17834 RSC.
- C. Yang, C. C. Chen, Y. Y. Pan, S. Y. Li, F. Wang, J. Y. Li, N. N. Li, X. Y. Li, Y. Y. Zhang and D. G. Li, Electrochim. Acta, 2015, 182, 264–271 CrossRef CAS.
- W. S. Chen, H. P. Yu and Y. X. Liu, Carbohydr. Polym., 2011, 86, 453–461 CrossRef CAS.
- X. P. Li, C. Shao, B. Zhuo, S. Yang, Z. Y. Zhu, C. W. Su and Q. P. Yuan, Int. J. Biol. Macromol., 2019, 139, 1103–1116 CrossRef CAS.
- Y. Y. Feng, X. Q. Zhang, Y. T. Shen, K. Yoshino and W. Feng, Carbohydr. Polym., 2012, 87, 644–649 CrossRef CAS.
- N. Song, X. S. Hou, L. Chen, S. Q. Cui, L. Y. Shi and P. Ding, ACS Appl. Mater. Interfaces, 2017, 9, 17914–17922 CrossRef CAS.
- A. A. Ksenofontov, S. A. Stupikova, G. B. Guseva, E. V. Antina and A. I. Vyugin, Sens. Actuators, B, 2018, 277, 462–466 CrossRef CAS.
- Y. Y. Sun, W. Fan, C. Zou, L. H. Wei, J. Q. Liu and Y. Xu, ACS Sustainable Chem. Eng., 2019, 7, 6851–6858 CrossRef CAS.
- Y. L. Gao and Z. X. Jin, ACS Sustainable Chem. Eng., 2018, 6, 6192–6202 CrossRef CAS.
- L. Wang, Y. Chen, L. W. Lin, H. Wang, X. W. Huang, H. G. Xue and J. F. Gao, Chem. Eng. J., 2019, 362, 89–98 CrossRef CAS.
- C. C. Chen, X. T. Bu, Q. Feng and D. G. Li, Polymers, 2018, 10, 1000 CrossRef.
- M. M. Mo, C. C. Chen, H. Gao, M. W. Chen and D. G. Li, Electrochim. Acta, 2018, 269, 11–20 CrossRef CAS.
- K. L. Zhang, Z. L. Hou, B. X. Zhang and Q. L. Zhao, Appl. Phys. Lett., 2017, 111, 153101 CrossRef.
- A. N. Parvez, M. H. Rahaman, H. C. Kim and K. K. Ahn, Composites, Part B, 2019, 174, 106923 CrossRef CAS.
- J. Wu, Z. X. Wu, K. Tao, C. Liu, B. R. Yang, X. Xie and X. Lu, J. Mater. Chem. B, 2019, 7, 2063–2073 RSC.
- B. T. Li, G. Xiao, F. Liu, Y. Qiao, C. M. Li and Z. S. Lu, J. Mater. Chem. C, 2018, 6, 4549–4554 RSC.
- Y. L. Chen, Z. A. Hu, Y. Q. Chang, H. W. Wang, Z. Y. Zhang, Y. Y. Yang and H. Y. Wu, J. Phys. Chem. C, 2011, 115, 2563–2571 CrossRef CAS.
- C. L. Zhao, M. Qin, W. H. Li and Q. A. Huang, 2011 16th International Solid-State Sensors, Actuators and Microsystems Conference, Beijing, 2011 Search PubMed.
- H. C. Bi, K. B. Yin, X. Xie, J. Ji, S. Wan, L. T. Sun, M. Terrones and M. S. Dresselhaus, Sci. Rep., 2013, 3, 2714 CrossRef.
- B. L. Li, Q. Tian, H. X. Su, X. W. Wang, T. E. Wang and D. Z. Zhang, Sens. Actuators, B, 2019, 299, 126973 CrossRef CAS.
- D. Z. Zhang, J. Tong, B. K. Xia and Q. Z. Xue, Sens. Actuators, B, 2014, 203, 263–270 CrossRef CAS.
- D. Z. Zhang, H. Y. Chang, P. Li, R. H. Liu and Q. Z. Xue, Sens. Actuators, B, 2016, 225, 233–240 CrossRef CAS.
- M. Y. Wang, D. Z. Zhang, A. J. Yang, D. R. Wang and X. Q. Zong, J. Mater. Sci.: Mater. Electron, 2019, 30, 4967–4976 CrossRef CAS.
- D. Z. Vasiljevíc, A. Mansouri, L. Anzi, R. Sordan and G. M. Stojanovíc, IEEE Sens. J., 2018, 18, 4378–4383 Search PubMed.
- V. V Perera, N. L. Fernando, B. Nissanka and D. R. Jayasundara, Adsorption, 2019, 25, 1543–1552 CrossRef.
- X. H. Le, X. Y. Wang, J. T. Pang, Y. J. Liu, B. Fang, Z. Xu, C. Gao, Y. Xu and J. Xie, Sens. Actuators, B, 2018, 255, 2454–2461 CrossRef CAS.
- K. Rathi and K. Pal, ACS Omega, 2017, 2, 842–851 CrossRef CAS.
- Z. Y. Wang, L. Y. Shi, F. Q. Wu, S. Yuan, Y. Zhao and M. H. Zhang, Nanotechnology, 2011, 22, 275502 CrossRef.
- H. L. Yan, S. Y. Guo, F. Wu, P. Yu, H. B. Liu, Y. L. Li and L. Q. Mao, Angew. Chem., Int. Ed., 2018, 57, 3922–3926 CrossRef CAS.
- V. I. Popov, D. V. Nikolaev, V. B. Timofeev, S. A. Smagulova and I. V. Antonova, Nanotechnology, 2017, 28, 355501 CrossRef CAS.
- M. R. Karim, K. Hatakeyama, T. Matsui, H. Takehira, T. Taniguchi, M. Koinuma, Y. Matsumoto, T. Akutagawa, T. Nakamura, S. Noro, T. Yamada, H. Kitagawa and S. Hayami, J. Am. Chem. Soc., 2013, 135, 8097–8100 CrossRef CAS.
- B. Bhangare, S. Jagtap, N. Ramgir, R. Waichal, K. P. Muthe, S. K. Gupta, S. C. Gadkari, D. K. Aswal and S. Gosavi, IEEE Sens. J., 2018, 18, 9097–9104 CAS.
- N. Li, X. D. Chen, X. P. Chen, X. Ding and X. Zhao, RSC Adv., 2017, 7, 45988–45996 RSC.
| This journal is © The Royal Society of Chemistry 2021 |

