
 Open Access Article
 This Open Access Article is licensed under a Creative Commons Attribution-Non Commercial 3.0 Unported Licence
Effect of dopant concentration and the role of ZnS shell on optical properties of Sm3+ doped CdS quantum dots
N. D. Vinha,
P. M. Tanb,
P. V. Doc,
S. Bhartid,
V. X. Hoae,
N. T. Hien e,
N. T. Luyene and
N. X. Ca*e
e,
N. T. Luyene and
N. X. Ca*e
aFaculty of Chemistry, TNU – University of Sciences, Thai Nguyen, Vietnam
bFaculty of Fundamental Sciences, Thai Nguyen University of Technology, Thai Nguyen, Vietnam
cThuyloi University, 175 Tay Son, Dong Da, Hanoi, Vietnam
dPanjab University, Chandigarh, 160014, India
eFaculty of Physics and Technology, TNU – University of Sciences, Thai Nguyen, Vietnam. E-mail: canx@tnus.edu.vn
First published on 18th February 2021
Abstract
The role of samarium (Sm) dopant on the structural, morphological, and optical properties of CdS QDs and CdS/ZnS core/shell QDs was methodically reported. The synthesis of Sm-doped CdS QDs and CdS/ZnS QDs was carried out via a facile wet chemical method. The structure, chemical composition, and optical properties of the synthesized QDs were investigated by using X-ray diffraction (XRD), X-ray photoelectron spectroscopy (XPS), Raman spectroscopy (RS), and photoluminescence (PL) spectroscopy. XRD analysis showed that the synthesized CdS QDs exhibited zinc blende structure which was not affected by doping Sm3+ ions. The particle size of the CdS:Sm and CdS:Sm (2%)/ZnS QDs was estimated to be ∼4 nm and ∼7 nm, respectively. Transmission electron microscopy (TEM) images revealed that the incorporation of Sm dopant did not significantly affect the size and morphology of CdS QDs, while the formation of the ZnS shell increased the particle size. XPS and XRD results confirmed the successful incorporation of Sm3+ ions into the CdS QDs. The effect of dopant concentration on the structural and luminescent properties was studied. The emission and excitation spectra of Sm3+-doped CdS QDs and CdS/ZnS QDs consisted of the characteristic lines corresponding to the intra-configurational f–f transitions. The energy transfer (ET) mechanism from the host to Sm3+ ions and the ET process through cross-relaxation between Sm3+ ions have been elucidated. The effect of the ZnS shell on the optical stability of the Sm3+-doped CdS QDs was studied in detail and the results showed that the CdS:Sm (2%)/ZnS QDs retained their good emission characteristics after 376 days of fabrication. The luminescent properties of Sm-doped QDs ranging from violet to red and PL lifetime extending to milliseconds demonstrated that these QDs are the potential materials for applications in white LEDs, biomarkers, and photocatalysis.
1. Introduction
Nanostructures have always attracted the interest of researchers because of their unique tunable properties and their potential in fundamental studies and technical applications. Semiconductor materials of the II–VI group are an important class of nanomaterials owing to their distinctive optoelectronic properties. Cadmium sulfide (CdS) is one of the n-type striking material with a narrow bandgap of 2.42 eV and potential applications in the optical and electronic industries.1,2 CdS is of high interest to researchers because of its intrinsic conduction band position, relatively high nonlinear optical response, and photocatalytic activity.3,4 Inorganic quantum dots (QDs) have a quantum efficiency of 20–80% and are stable under a harsh environment. Semiconductor QDs possess broad and continuous absorption spectra, whereas the emission spectra are narrow and independent of the excitation wavelength. However, naked CdS nanostructures have various limitations including photo-corrosion, high carrier recombination rate, and limited active sites.5–7The optical properties of II–VI semiconductors can be enhanced by various methods like optical annealing, luminescent ion doping, and coating with a higher bandgap material.8–10 The coating of CdS nanostructures with a higher bandgap material can enhance the photoluminescence quantum yield and photostability because the surface non-radiative recombination defects are eliminated and the dangling bonds are reduced. Several studies have focused on the synthesis and improvement of optical properties of Type-I core/shell nanostructures such as CdSe/CdS, CdSe/ZnS, and CdS/ZnS, etc. CdS and ZnS have a similar crystalline structure, which makes them interesting for optoelectronic and biological applications.11,12 ZnS is the most chosen semiconductor material for shell formation because it can enhance the fluorescent efficiency and reduce the toxicity of the unstable core. ZnS can improve the chemical and optical stability by acting as an anti-oxidant layer and shield the reactive core from photobleaching and the outer environment.13 In Type-I core/shell nanostructures, the holes and electrons are confined in the core and the shell does not contribute much to the wavefunction.14
Doping semiconductor QDs with a suitable material is an important approach utilized in the nanotechnology field for modifying the material properties.15 Effective doping can not only modify the electronic, structural, and optical properties of the host material but also enhance the photocatalytic properties of semiconductor nanostructure. In addition to the different synthesis approaches such as varying solvents and precursors and changing temperature which have been applied to modify the key properties of CdS QDs, the doping of the proper material is also an important route.16,17
Doping of lanthanides is a novel approach that has been received a lot of attention. Owing to the unique electrical, optical and chemical properties, lanthanides have great potential for applications such as luminescent devices, color displays, optical communication, and catalysts. The photocatalytic activity of the doped material increases because doping provides a path to concentrate the target molecules (organic pollutants) at the catalyst surface by forming a Lewis acid–base complex.18 Lanthanides cause the effective separation of e−–h+ pairs and increase the light sensitivity of the photocatalyst.19,20 The electronic structure of lanthanides is special, thus, they can form complex with Lewis bases like aldehydes, acids, and alcohols very easily.
Among various lanthanides, samarium (Sm) is of particular interest for phosphor applications because of its multiple energy level structures and high emission spectra. Sm has high potential in color displays, optical data storage, optical amplifiers, underwater communication, etc.21–23 The characteristic that makes this material highly interesting is the strong luminescence in the visible spectrum exhibited by Sm3+ ions and the emitting 4G5/2 energy level with a relatively high quantum efficiency.24 Researchers have synthesized Sm3+-doped TiO2 and ZnO nanostructures25,26 and found that Sm3+ ions could enhance the visible light absorption of TiO2 and ZnO nanostructures, leading to the improvement of the photocatalytic activity. Therefore, II–VI semiconductor QDs doped with lanthanides have been potentially applied in various areas such as display production, electronic device manufacture, and biomedical technology. To our best knowledge, the works with the synthesis of Sm-doped semiconductor CdS QDs and Sm-doped CdS/ZnS core/shell QDs and their properties have been carried out limitedly until now.
The present paper reports the effect of Sm doping on CdS QDs and core/shell CdS/ZnS QDs. A wet chemical method is used to synthesize CdS QDs and CdS/ZnS QDs doped with Sm ions. CdS QDs are doped with different concentrations of Sm (0.5–2%) and are systematically studied for their structure, optical properties, and morphology. The effect of Sm doping on CdS/ZnS core/shell QDs has been explored using various spectroscopic techniques. The structure and chemical composition of all samples are investigated by XRD, TEM, RS, and XPS. The optical properties of the synthesized samples are studied by using PL and PL excitation (PLE) spectroscopy. The ET mechanism from host to dopant and the ET process through cross-relaxation between Sm3+ ions are elucidated. The emission decay curve is studied to explore the decay lifetime of the synthesized QDs.
2. Experimental
2.1. Materials
The chemicals and solvents used throughout the experiments were of analytical grade and used directly without any further purification. Cadmium oxide (CdO, 99.99%, powder), sulfur (S, 99.98%), samarium(III) acetate hydrate (Sm(CH3COO)3·H2O, 99.9%), oleic acid (OA, 90%), Tri-n-octylphosphine (TOP, 97%), 1-octadecene (ODE, 90%), toluene (99.8%) and isopropanol (99.7%) were purchased from Sigma-Aldrich.2.2. Synthesis of Sm-doped CdS and CdS/ZnS QDs
The synthesis process used to fabricate Sm-doped CdS QDs and Sm-doped CdS/ZnS core/shell QDs was adapted and modified according to the process reported in our studies.27,28 In a three-neck flask, 128 mg of CdO powder was dissolved in a mixture of 2 ml of OA and 20 ml of ODE at 240 °C under a continuously stirring condition to produce a homogeneous Cd2+ ion solution. A solution containing S2− ions was prepared by mixing 32 mg of S with 5 ml of ODE and 1 ml of TOP solution at 100 °C. Sm(CH3COO)3·H2O was dissolved in TOP and ODE and stirred at 150 °C until a homogeneous clear solution of Sm3+ was obtained. The precursor solutions containing Cd2+ ions and Sm3+ ions were mixed with different Sm3+/Cd2+ ratios (the concentrations of Sm3+ ions used for doping CdS QDs were 0.5%, 1%, and 2%). Then, the S2− solution was added quickly to the mixture containing Cd2+ and Sm3+ ions at 240 °C. For the nucleus growth of Sm-doped CdS QDs, the reaction system was maintained at 240 °C for 60 min. The fabricated Sm-doped CdS QDs were dispersed in isopropanol to remove extra unreacted Cd2+, Sm3+, and S2− ions and separated from the liquid by centrifuging. The purified Sm-doped CdS QDs were re-dispersed in toluene and ODE and the obtained mixture was used for ZnS coating experiments.For the formation of ZnS shell over Sm-doped CdS QDs, ZnO, and S were used to prepare Zn2+ and S2− precursor solutions. For the S2− precursor, 32 mg of S was dissolved in 1 ml of TOP and 5 ml of ODE solvent at 100 °C and for the Zn precursor, 81 mg of ZnO was dissolved in a mixture consisting of 2 ml of OA and 5 ml of ODE at 200 °C. The solutions containing Zn2+ and S2− ions were slowly added to previously prepared Sm-doped CdS QDs at 220 °C. This solution was left for 30 min to grow the ZnS shell. For the purification process, QDs were separated from the solvent by centrifuging at 10![[thin space (1/6-em)]](https://www.rsc.org/images/entities/char_2009.gif) 000 rpm for 5 min. The obtained QDs were dispersed in toluene for further characterizations. All of the synthesis processes were performed in nitrogen ambiance to avoid oxidation.
000 rpm for 5 min. The obtained QDs were dispersed in toluene for further characterizations. All of the synthesis processes were performed in nitrogen ambiance to avoid oxidation.
3. Characterization
To study the optical properties of the fabricated QDs, emission and excitation spectra, and luminescent lifetime were measured using an FLS1000 system (Edingburgh, UK) with a 450 W Xe lamp at room temperature. The crystal structure of the fabricated samples was analyzed using an X-ray diffractometer (Siemens, D5005) equipped with a Cu-Kα radiation source. The morphology of the QDs was observed using TEM (JOEL-JEM 1010) operated at 80 kV. X-ray photoelectron spectroscopy (XPS) measurements were performed on a Thermo VG Escalab 250 photoelectron spectrometer. Raman spectra (RS) were measured using a LABRAM-HR800 spectrometer (Horriba, Jobin Yvon) with a wavelength λexc = 488 nm (2.54 eV) generated from an Ar+ laser as an excitation source. To compare the emission intensity and avoid the re-absorption, the optical density of the samples was normalized (equal to 0.07) at the excitation wavelength 378 nm.4. Results and discussion
4.1. Morphology and structural analysis
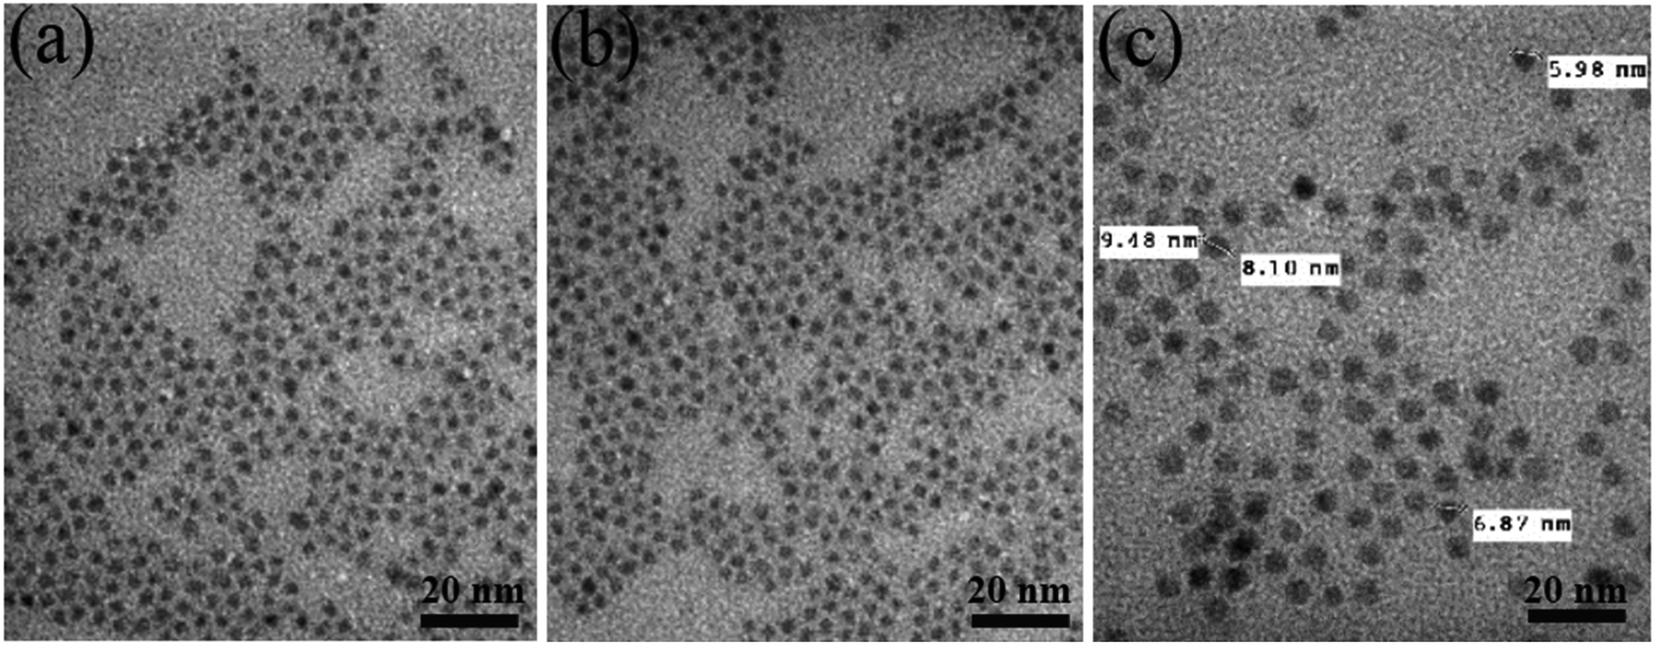 | ||
| Fig. 1 TEM images of (a) CdS, (b) CdS:Sm2%, and (c) CdS:Sm2%/ZnS QDs. | ||
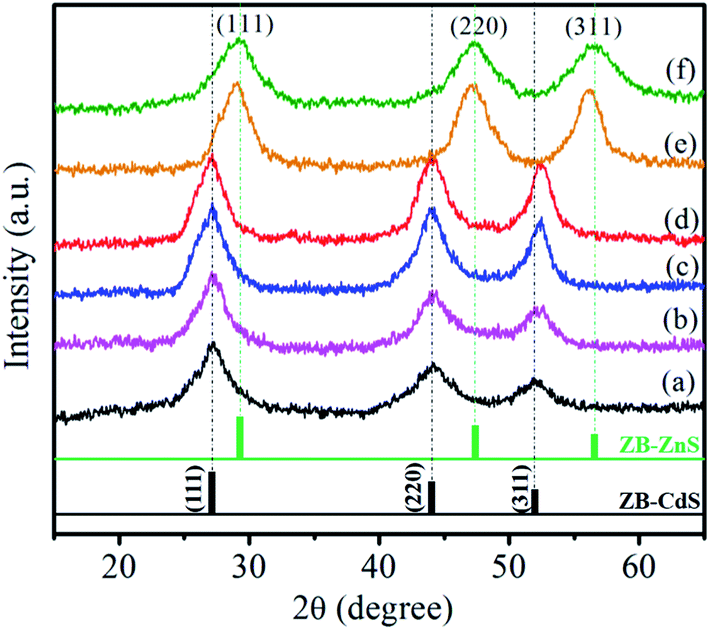 | ||
| Fig. 2 XRD pattern of (a) CdS, (b) CdS:Sm0.5%, (c) CdS:Sm1%, (d) CdS:Sm2%, (e) CdS:Sm2%/ZnS, and (f) ZnS QDs. | ||
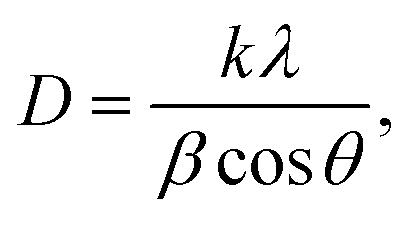
The crystallite size of the synthesized nanostructures was calculated by using Debye Scherrer's formula:33,34
 | (1) |
 | (2) |
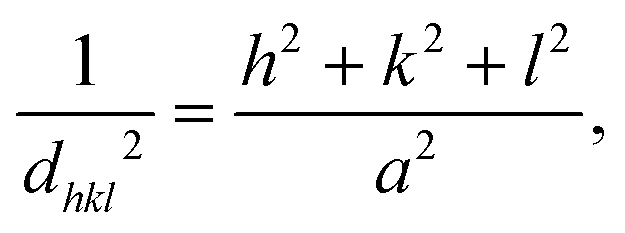
sinθ. The broadening of XRD peaks is mainly due to two factors (i) size in the quantum regime and (ii) strain induced in the nanostructures. Hence, the strain was calculated using Stokes–Wilson equation:36
 | (3) |
The number of dislocations presenting in the unit area of the synthesized samples was calculated using the equation:36
 | (4) |
The calculated parameters from the XRD data i.e. D, a, dhkl, δ, and ε are summarized in Table 1. The calculated values show that the crystallite size of CdS QDs increases after doping with Sm3+ ions. The decrease in the values of ε and δ of the QDs after doped with Sm3+ confirms the formation of a low-defect nanostructure.
| S. no. | Sample | 2θ | hkl | dhkl (nm) | a (nm) | β | D (nm) | δ × 10−2 | ε × 10−2 |
|---|---|---|---|---|---|---|---|---|---|
| i | CdS | 51.91° | [311] | 1.75 | 5.82 | 0.046 | 3.35 | 8.9 | 1.03 |
| ii | CdS:Sm (0.5%) | 52.17° | [311] | 1.75 | 5.80 | 0.042 | 3.67 | 7.42 | 0.94 |
| iii | CdS:Sm (1%) | 52.29° | [311] | 1.74 | 5.77 | 0.037 | 4.18 | 5.72 | 0.83 |
| iv | CdS:Sm (2%) | 52.43° | [311] | 1.73 | 5.75 | 0.035 | 4.41 | 5.14 | 0.78 |
For CdS:Sm (2%)/ZnS QDs, the diffraction peaks shift towards a higher angle, but the change in the crystalline structure is not observed after the formation of the shell. The XRD peaks for CdS:Sm (2%)/ZnS QDs observed at 28.94°, 47.20° and 56.10° correspond to the [111], [220], and [311] planes in the zinc blende structure. All the diffraction peaks systematically shift from those of the characteristics of pure CdS towards pure ZnS.37 A similar shift in the diffraction patterns was observed during the growth of the ZnS shell on CdSe core by Dabbousi et al.38 The formation of the ZnS shell over the CdS:Sm core does not affect the cubic structure of CdS, confirming the formation of core/shell QDs. The obtained values of dhkl and lattice parameter ‘a’ are 1.61 and 5.34 nm, respectively. The reduction in dhkl and lattice parameter ‘a’ is attributed to the smaller lattice constant of ZnS as compared to that of CdS or due to the strain induced by the shell on the core. The value of the lattice constant of CdS is larger than that of ZnS, thus, the core undergoes a compressive strain while the shell experiences a tensile strain.39 An asymmetric internal electric field generated at the interface due to the stress induced by the lattice mismatch of the core and shell affects the electronic states and optical properties of nanostructures and will be discussed in the following sections.
4.2. Oscillation spectra and composition analysis
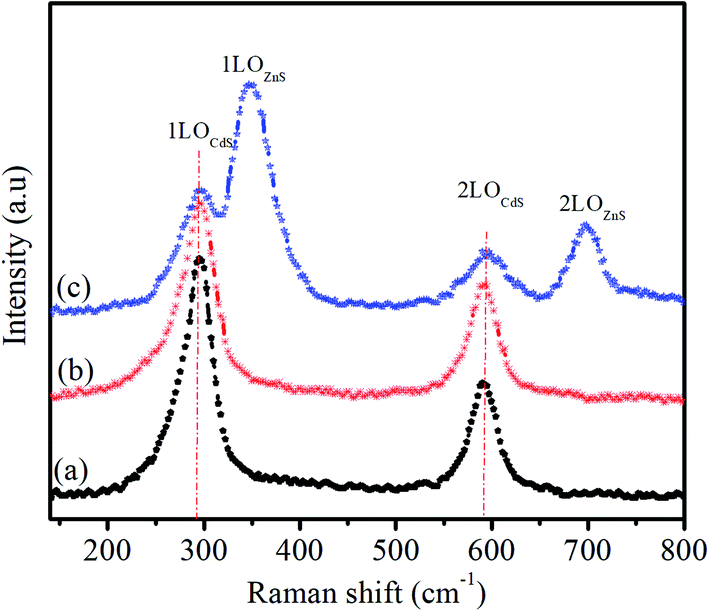 | ||
| Fig. 3 RS spectra of (a) CdS, (b) CdS:Sm2%, and (c) CdS:Sm2%/ZnS QDs. | ||
The intensity ratio of the overtone phonon to fundamental phonon gives the strength of the exciton–phonon coupled in semiconductors.35 The calculated intensity ratios (I2LO/I1LO) of the QDs are given in Table 2. The I2LO/I1LO ratio of the Sm (2%) doped CdS and CdS:Sm (2%)/ZnS QDs is higher than that of the CdS QDs, suggesting that the doping and formation of the ZnS shell strengthen the exciton–phonon coupling. According to the Raman spectrum of the CdS:Sm (2%)/ZnS core/shell QDs (Fig. 3(c)), two additional peaks can be observed after the formation of the ZnS shell. The peaks at 298 cm−1, 348 cm−1, 596 cm−1 and 696 cm−1 are associated with 1LO (CdS), 1LO (ZnS), 2LO (CdS) and 2LO (ZnS) longitudinal optical phonon modes, respectively. The presence of the peaks of optical phonon modes of both CdS and ZnS confirms the formation of the shell. This finding is in accordance with the previously reported results.37,41 The broadening of the peaks is due to the strain that exists at the interface of core/shell QDs.42,43 The formation of the ZnS shell of 3 monolayers over the Sm (2%) doped CdS QDs minimizes the prominent LO peaks of CdS QDs. A similar result was reported by Bhand et al.44 and can be explained by the formation of a CdSe shell over CdTe QDs. The intensity and position of the peaks change due to the structural distortion induced by the dopant or shell.
| Sample | Raman peak 1LO (cm−1) | Raman peak 2LO (cm−1) | Raman intensity (I1LO) | Raman intensity (I2LO) | Intensity ratio (I2LO/I1LO) |
|---|---|---|---|---|---|
| CdS | 296 | 591 | 43354.2 |
38888.9 |
0.89 |
| CdS:Sm (2%) | 296 | 590 | 45313 |
42349 |
0.93 |
| CdS:Sm (2%)/ZnS | 296CdS, 348ZnS | 590CdS, 696ZnS | 45782CdS, 49645ZnS |
43600CdS, 44559ZnS |
0.95CdS, 0.89ZnS |
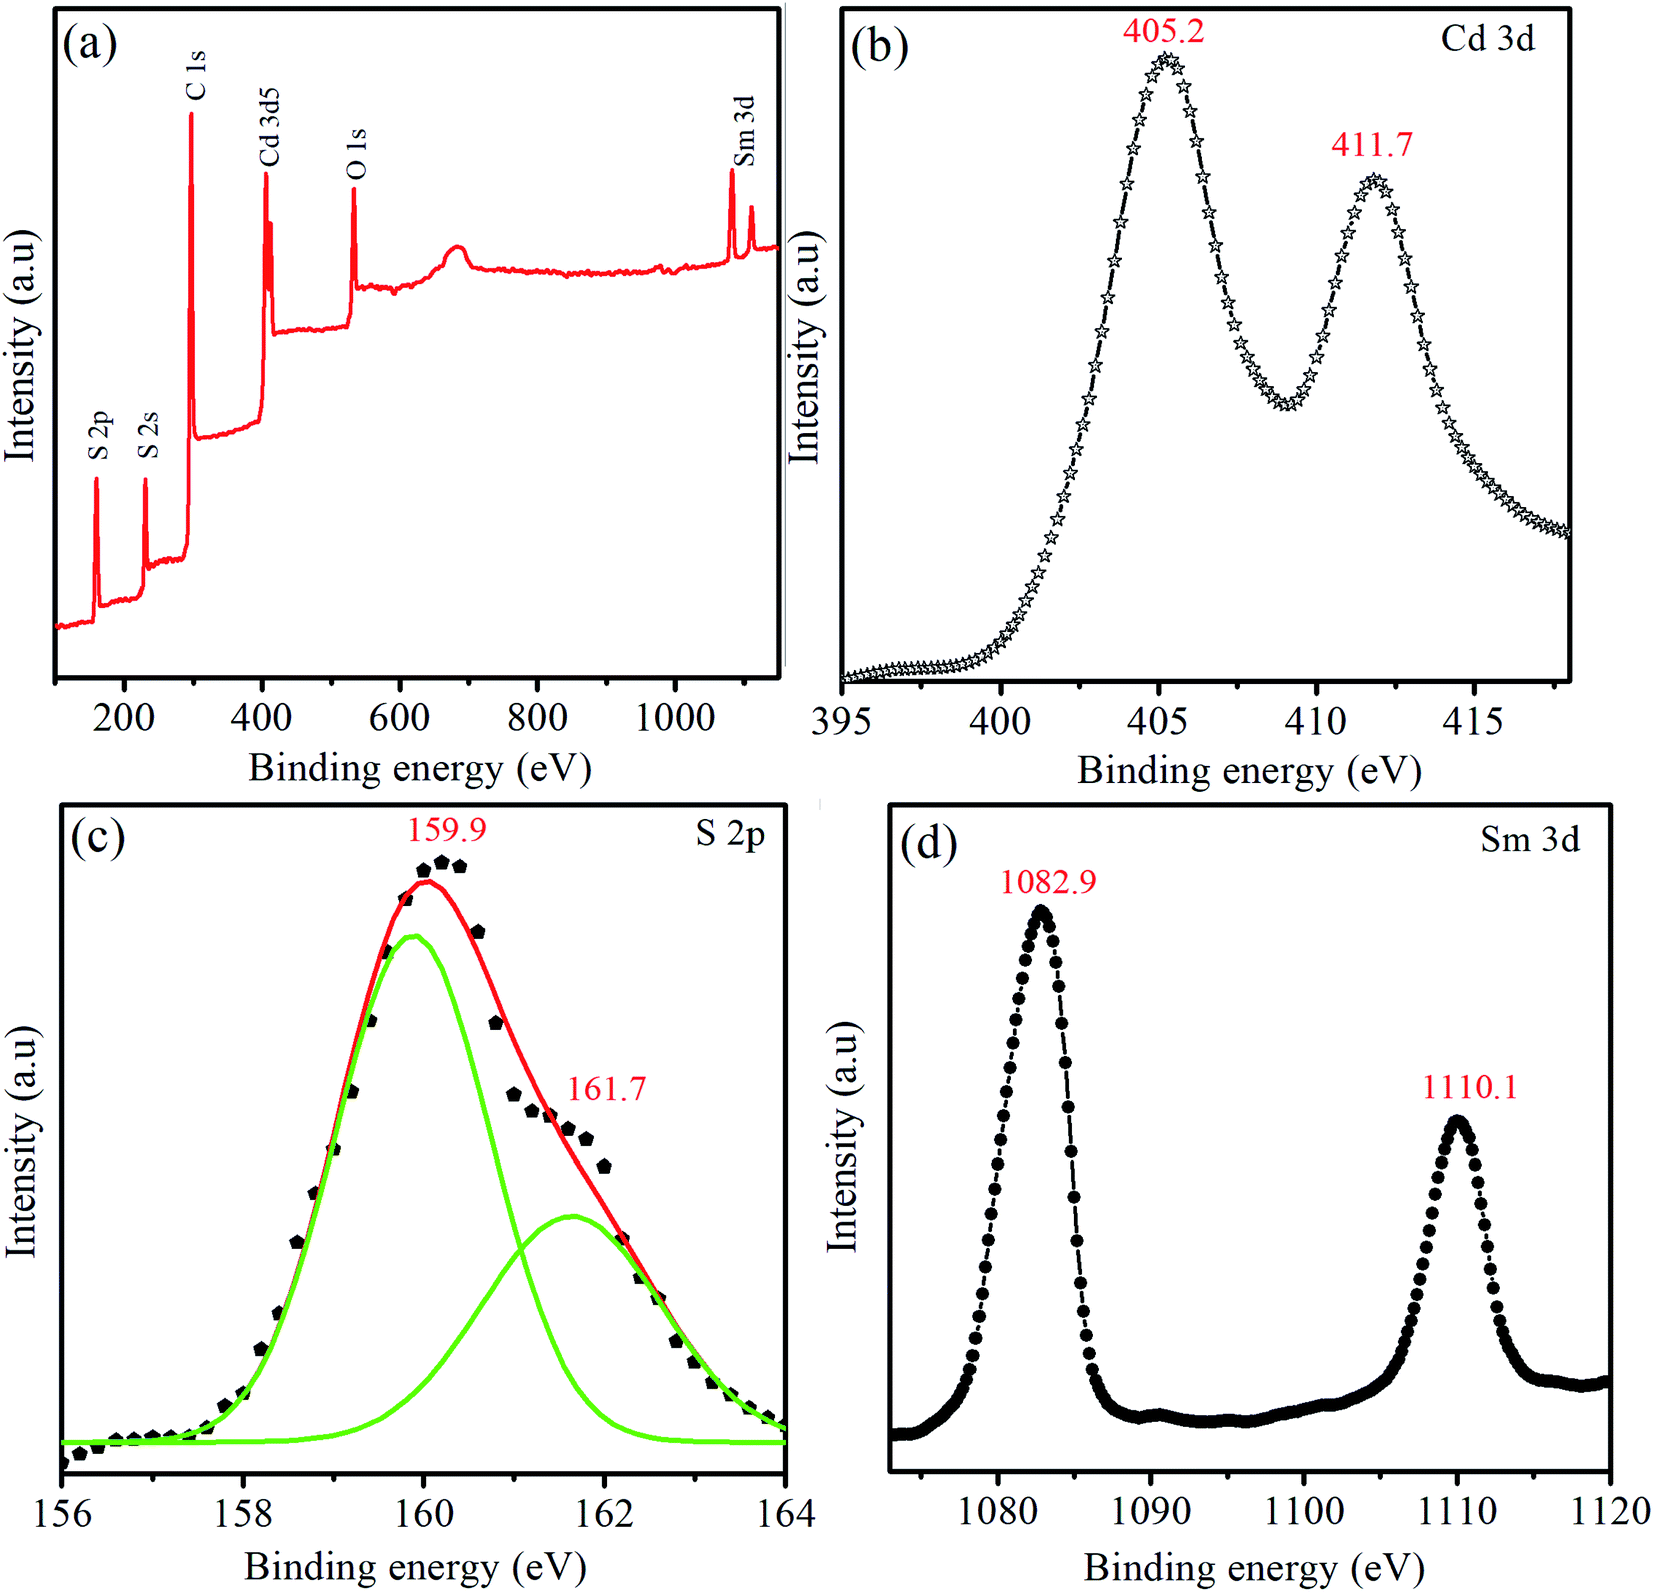 | ||
| Fig. 4 (a) Survey XPS spectra of the CdS:Sm (2%) QDs, and (b) Cd 3d, (c) S 2p, (d) Sm 3d. | ||
The high-resolution XPS spectra of Cd 3d, S 2p, and Sm 3p are shown in Fig. 4(b)–(d). The strong peaks of Cd 3d5/2 and Cd 3d3/2 are observed at binding energies of 405.2 eV and 411.7 eV, respectively. The binding energy of Cd 3d5/2 attributed to the Cd2+ bonding state and the spin–orbit separation of 6.5 eV for Cd are in agreement with the previous data.46 The peaks occuring in the range ∼160 eV–164 eV are associated with the binding energy of S2− species. For S, the peaks are fitted with Gaussian functions for the deconvolution. The high-resolution peaks of S 2p exhibit two peaks at 159.9 eV and 161.7 eV, indicating that −2 is the dominant oxidation state of S. The major peak at 159.9 eV and low-intensity peak at 161.7 eV are indexed with the 2p3/2 and 2p5/2 states of S, respectively. When compared to the binding energy of S 2p in bulk CdS, that in CdS:Sm QDs shows a blue shift which may be due to the influence of quantum confinement effect.47
For Sm 3d, the two peaks with an energy difference of 27.2 eV observed at the binding energy of 1082.9 eV and 1110.1 eV are attributed to Sm 3d3/2 and 3d5/2, respectively. The binding energy of the Sm 3d appearing at 1082.9 eV corresponds to the energy of Sm3+ photoelectrons. The concentrations of Cd, Sm, and S in the CdS:Sm2% QDs calculated from Cd 3d, Sm 3d, and S 2p signals are 57.7, 1.4, and 40.9%, respectively.
4.3. Optical properties
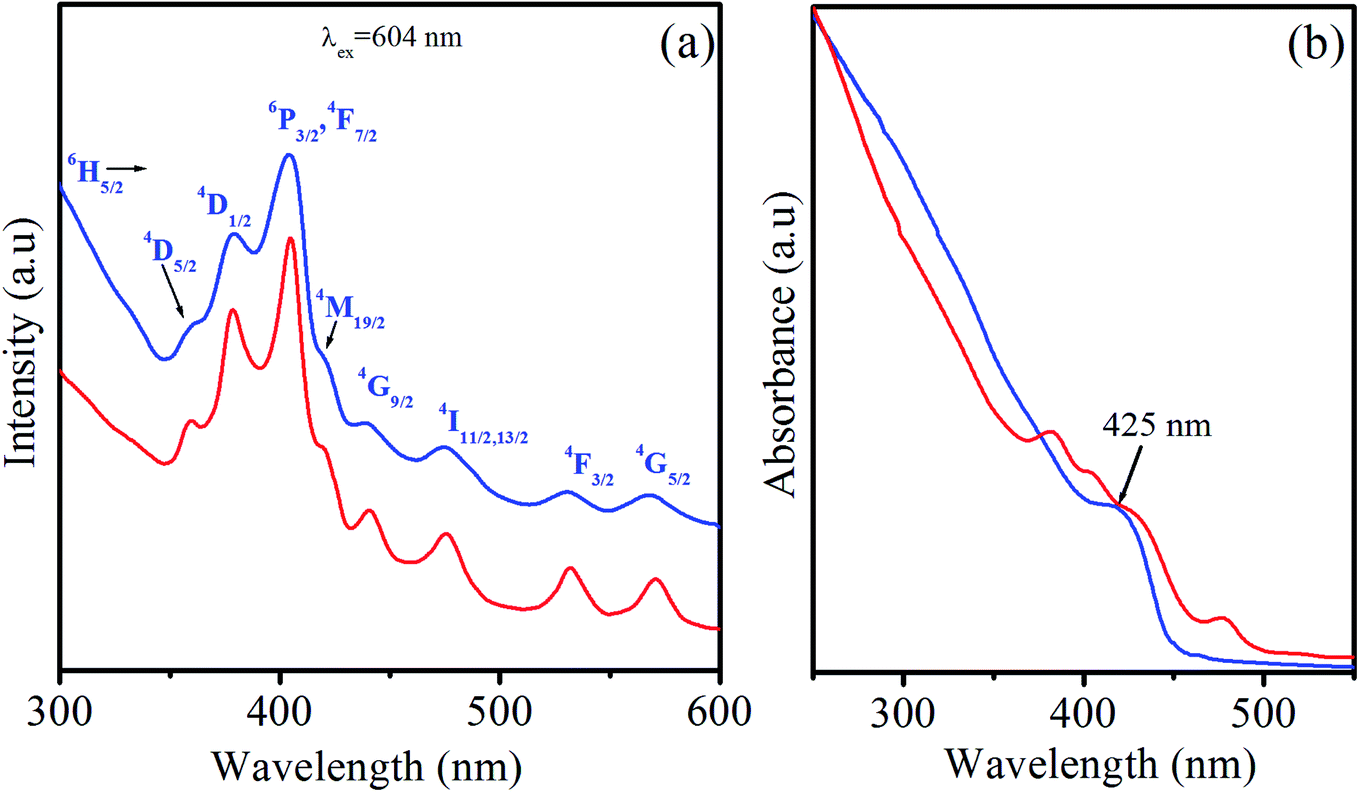 | ||
| Fig. 5 (a) PLE spectra of CdS:Sm2% QDs (blue line) and CdS:Sm2%/ZnS core/shell QDs (red line). (b) UV-vis absorption spectra of CdS (blue line) and CdS:Sm2% QDs (red line). | ||
The absorption (Abs) spectra of the CdS and CdS:Sm2% QDs are presented in the inset of Fig. 5(b). On the Abs spectrum of the CdS QDs (blue line), the first excitonic absorption peak can be observed at a wavelength of 425 nm, corresponding to the lowest energy transition between the ground hole and electron (1S3/2(h)–1S(e)). It can be used to estimate the diameter of the QDs according to Yu's empirical equation:48 D = (−6.6521 × 10⁻⁸)λ3 + (1.9557 × 10⁻⁴)λ2 + (1.6242 × 10⁻³)λ2 − (9.2352 × 10⁻¹)λ + 13.29, where λ is the wavelength of the first excitonic absorption peak D is the size of QDs. In this study, the estimated size of the QDs is about 4.2 nm. Some characteristic absorption peaks of Sm ions can be seen on the Abs spectrum of the CdS:Sm2% QDs (red line), which are similar to PLE spectra. We can see a slight shift of the first excitonic absorption peak of CdS:Sm2% QDs (see the red line in Fig. 5(b)) towards longer wavelengths compared to that of CdS QDs. This slight redshift may be due to the larger size of CdS:Sm2% QDs when compared to that of CdS QDs. This assumption is consistent with the size of the QDs given in Table 1.
 | ||
| Fig. 6 (a) PL spectra (b) FWHM of host emission peak of CdS, CdS:Sm (0.5–2%) and CdS:Sm2%/ZnS QDs. | ||
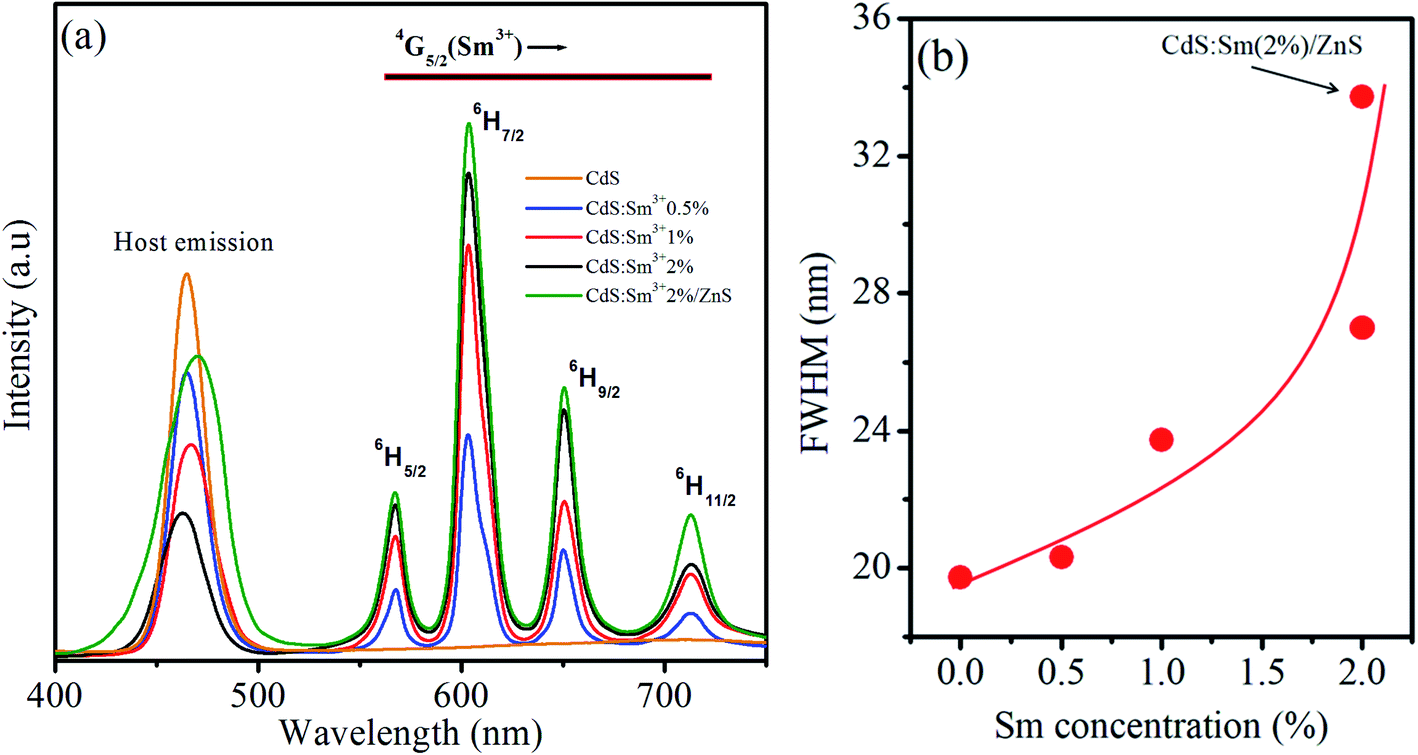
For the CdS QDs doped with Sm3+ (0.5%), the spectrum consists of one band at 465 nm and four new peaks located in the region of 550–750 nm. The peak in the blue region centred at 465 nm is due to the CdS host. The intensity of the peak due to the band edge emission of CdS QDs centred at 465 nm decreases after the incorporation of Sm3+ ions. This quenching is owing to the shallow traps caused by the introduction of new defect levels and lattice defects after Sm doping, which can trap photo-generated electrons and promote the separation of electrons and holes. The intensity of PL depends on various factors including the morphology of the nanostructures, change/energy transfer between the dopant and semiconductor, and the origin of new defect levels. The four new peaks centred at 567 nm, 604 nm, 650 nm, and 713 nm are due to the transitions in Sm3+ ions. These peaks are associated with f–f forbidden transitions of the 4f electrons of Sm3+. It can be seen that the emission band of the CdS host (445–490 nm) overlaps with the 6H5/2 → 4G9/2 and 6H5/2 → 4I11/2,13/2 excitation bands of Sm3+ ions (see Fig. 5 and 6). This indicates an obvious possibility of the energy transfer process from CdS QDs to Sm3+ ions as illustrated in Fig. 7. In this process, Sm3+ ions at the ground state can be excited to 4G9/2 or 4I11/2,13/2 levels through reabsorbing photons that are emitted by the band–band transition. Then, the Sm3+ ions relax non-radiatively to the 4G5/2 level. Finally, they relax to the 6HJ levels by emitting the Sm3+ characteristic radiations in the range from 550 to 750 nm. This energy transfer process also contributes to the luminescent quenching of the CdS host.
 | ||
| Fig. 7 Schematic illustration of the energy transfer mechanism from host CdS to Sm. | ||
As shown in Fig. 6, the most intense peak for Sm-doped CdS QDs is observed at 604 nm, while the weak emissions are observed at 567 and 713 nm. The emission results show that doping II–VI QDs with lanthanides gives the emission spectrum in the entire visible region. When the electromagnetic field interacts with the electron of an atom, the allowed emission transitions occur because of the electronic dipole, electronic quadrupole, or magnetic dipole. The peaks observed at 567, 604, 650, and 713 nm are contributed to the 4G5/2–6H5/2, 4G5/2–6H7/2, 4G5/2–6H9/2, and 4G5/2–6H11/2 transitions of Sm3+ ions states, respectively. Xiao et al.50 observed similar transitions in Sm3+-doped CaWO4 nanoparticles. The emission structure can be described by taking into account that the 6HJ levels are divided into 2J + 1 sublevels in the crystal field.51 The allowed transition for the magnetic dipole follows ΔJ = 0, ±1. Therefore, the first transition 4G5/2–6H5/2 follows the magnetic dipole character and the second transition 4G5/2–6H7/2 follows the magnetic dipole character as it obeys the selection rule, but the electric dipole character dominates in this transition, and 4G5/2–6H9/2 demonstrates pure electric character. Therefore, the transition at 650 nm is hypersensitive to the crystal field.
Knowledge about the local symmetry of the crystal can be gathered by finding the intensity ratio of the electric dipole transition to the magnetic dipole transition. The emission intensity ratio at 650 nm to 567 nm is found to be 1.59, indicating that the electric dipole transition dominates the magnetic dipole transition, thus asymmetry of the Sm3+ ion sites is possible in the crystal structure. For Sm (2%) doped CdS QDs, the change in the ratio of the electric dipole to the magnetic dipole is highest, suggesting an increase in the asymmetry. The relative intensities of these transitions are very sensitive to the variations in the local environment of Sm3+ ions. The energy transfer between CdS QDs and Sm3+ ions takes place via electron exchange or coulombic mechanism and also depends on the distance between the donor and the acceptor.
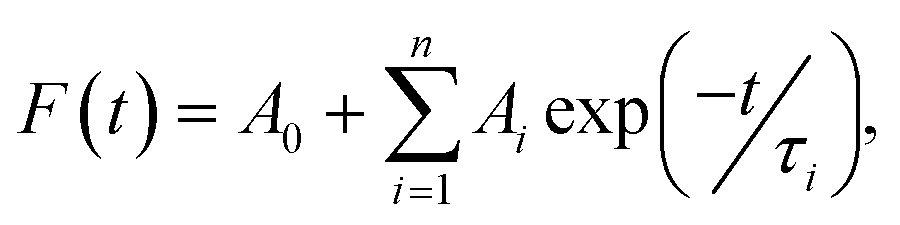
The effect of the concentration of Sm3+ ions on CdS QDs has been studied using luminescent spectra. As the concentration of Sm3+ ions changes (0.5%, 1%, and 2%), the position of the emission peaks remains unchanged, but the intensity is affected. The increase in the concentration of dopant ions in CdS QDs quenches the host emission (peak about 465 nm). This quenching is due to the increasing ion–ion interactions between Sm3+ ions, leading to an increase in the non-radiative process and causing concentration-dependent quenching.52,53 The increase in the concentration of Sm3+ ions in CdS QDs enhances the emission peaks caused by Sm3+ ions. This enhancement in the emission peaks is originated from the growth of luminescent centers. The emission spectrum of CdS:Sm (2%)/ZnS QDs consists of five emission bands. The peak observed at the band edge shows a redshift of ∼5 nm as compared to that of CdS QDs and Sm-doped CdS QDs. This shift is due to the tunneling of charge carriers into the ZnS shell. The peak centred at 470 nm shows an increase in the emission of CdS:Sm after passivating the QDs with the ZnS shell. The spectrum of CdS:Sm (2%)/ZnS QDs also consists of emission peaks of Sm3+ ions with the enhanced emission intensity. Coating the Sm3+-doped CdS QDs with the ZnS shell suppresses the recombination by passivating surface nonradiative recombination sites. A redshift of the emission peak and an enhancement in its FWHM are observed after the CdS QDs were coated with the ZnS shell.
Fig. 6(b) depicts the change in FWHM value with the change in the concentration of dopant and with the formation of the ZnS shell. It can be seen that the FWHM values of all the samples are in a narrow range (from 18 to 34 nm) and that of the CdS:Sm (2%)/ZnS QDs is the highest. The enhancement in the emission of CdS:Sm (2%)/ZnS core/shell QDs can be associated with an inter-band connection between the interface of the core and the disordered shell. The ZnS shell confines the photogenerated e−–h+ to the CdS core interface, resulting in the passivation of the non-radiative transitions and enhancing the luminescence intensity.54 These results indicate that the synthesized QDs are a promising red-emitting material for white-light LED applications.
As shown in Fig. 6, the emission intensity of Sm3+ ions in the CdS:Sm3+/ZnS QDs is higher than that in the CdS:Sm3+ QDs. This behavior may be originated for two reasons. The first one relates to the change of the local environment of Sm3+ ions. Some authors reported that Zn2+ can diffuse into the CdS lattice during the formation of the ZnS shell over the CdS:Sm3+ QD core.55,56 In this case, Zn2+ ions play a role as a modifier component in the CdS matrix. The appearance of the Zn2+ modifier in CdS QDs may increase the asymmetry of the ligand field of Sm3+ ions, leading to an enhancement of the radiative transition probability from 4G5/2 levels,57 i.e., an increase in emission intensity from this level. The second reason relates to the decrease of surface states. It is known that the QDs always contain the surface states which create the continuum energy levels in the band gap of materials. These levels are usually in a wavelength range of 500–750 nm for CdS and ZnS QDs. The energy band of the surface states overlaps the transition energy of the Sm3+ emission bands. Thus, the photons emitted by the Sm3+:4G5/2 → 6HJ (J = 5/2, 7/2, 9/2, and 11/2) transitions may be reabsorbed by the surface states. This process constrains the increase of the Sm3+ luminescent bands. However, coating ZnS shell over CdS:Sm3+ QDs decreases the surface defect, leading to the decrease of the energy transfer process from Sm3+ to the surface states. This creates the increase of the Sm3+:4G5/2 → 6HJ emission bands in the CdS:Sm3+/ZnS QDs in comparison with those of the CdS:Sm3+ QDs.
It can be seen that the increase of the 4G5/2 → 6H11/2 emission band at 713 nm is significantly higher than that of other bands. Coating ZnS shell over CdS:Sm3+ QDs does not remove completely the surface states, i.e., the energy transfer process from Sm3+ to the surface states of both CdS core and ZnS shell still exists in CdS:Sm3+/ZnS QDs. Nevertheless, the lowest energy level of the ZnS surface states in the CdS:Sm3+/ZnS QDs (1.77 eV) is higher than 1.74 eV (713 nm), so the probability of the 713 nm photon absorption is significantly lower than that of the photons having absorption wavelengths of 567, 604 and 650 nm. This is the reason why the increase in the intensity of the 4G5/2 → 6H11/2 transition (713 nm) in the CdS:Sm3+/ZnS QDs is larger than that of other transitions.
 where Ai is the pre-exponential factor, and τi is the lifetime. The average lifetime is calculated using the equation:58,59
 | ||
| Fig. 8 Emission decay curves for CdS:Sm (0.5–2%) and CdS:Sm2%/ZnS QDs under excitation wavelength at 525 nm and the emission wavelength at 604 nm. Solid lines represent the fitting curves to a multiexponential function. | ||
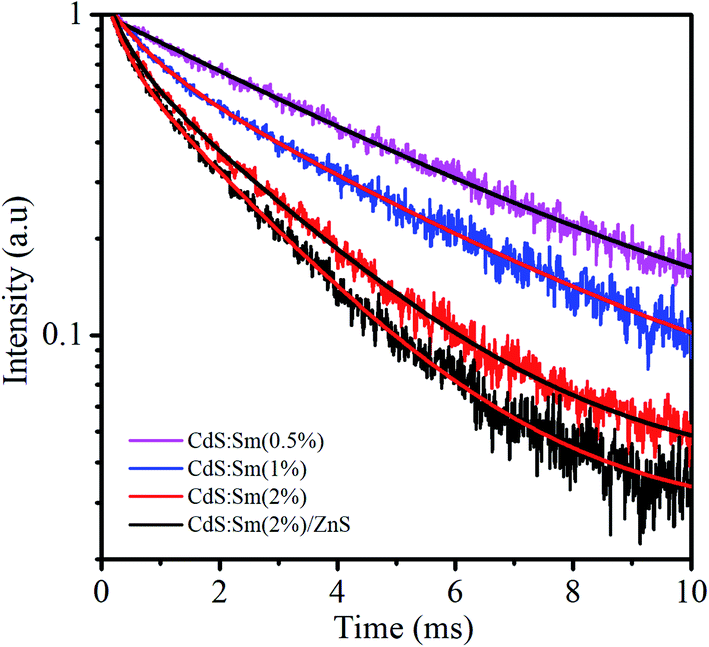
The values of the decay lifetime and fitness of curve R2 obtained by fitting are summarized in Table 3. The fast component (τ1) is associated with luminescence from defect states in the CdS QDs while the slow component (τ2) is ascribed to the 4G5/2–6H7/2 transition of Sm3+ ions.60 For CdS:Sm3+ QDs, it can be seen that the average lifetime decay constant decreases with the increase in Sm concentration. This value is 4.45 ms with an Sm3+ concentration of 0.5%, decreases to 3.75 ms with a concentration of 1%, and falls to 2.09 ms when the dopant concentration is 2%. The long decay time is induced by a forbidden transition of Sm3+ according to a spin selection rule. The lifetime decay of the order of ms is sufficient for applications in displays.61,62
| Sample | τ1 (ms) | τ2 (ms) | 〈τ〉 (ms) | R2 |
|---|---|---|---|---|
| CdS:Sm (0.5%) | 4.45 (50%) | 4.45 (50%) | 4.45 | 0.994 |
| CdS:Sm (1%) | 4.00 (67.9%) | 0.69 (32.1%) | 3.75 | 0.996 |
| CdS:Sm (2%) | 2.45 (63.8%) | 0.39 (36.2%) | 2.09 | 0.997 |
| CdS:Sm (2%)/ZnS | 2.14 (63.6%) | 0.36 (36.4%) | 1.98 | 0.998 |
The quenching of the lifetime of Sm3+:4G5/2 level relates to the energy transfer process through cross-relaxation (CR) between Sm3+ ions.63 Some energy transfer channels between Sm3+ ions are illustrated in Fig. 7. In this process, an Sm3+ ion in excited level (4G5/2) would transfer its energy to a neighbor ion in the ground state (6H5/2), then both two ions enter the energy levels from 6H7/2 to 6F1/2. Finally, they relax to the ground level through a mutilphonon process or an infrared emission. Thus, luminescence and lifetime of 4G5/2 level are quenched.
As mentioned in Section 4.3.2, coating CdS:Sm3+ QDs by ZnS leads to the increase of the radiative transition probability of Sm3+:4G5/2 level and the decrease of energy transfer probability from Sm3+ ion to surface states. It is known that the lifetime of any exciting level is the inverse of the total transition probability (including the radiative and energy transfer processes) from that level.57 The lifetime of 4G5/2 level in CdS:Sm3+/ZnS QDs is smaller than that in CdS:Sm3+ QDs, i.e., the total transition probability from 4G5/2 level in CdS:Sm3+ QDs is enhanced by coating ZnS. This indicates that the increase of Sm3+ radiative probability by Zn2+ diffusion effect has largely dominated the decrease of energy transfer probability from Sm3+ to surface states.
4.4. Effect of storage time on fluorescent properties
To evaluate the optical stability of the synthesized QDs under normal storage conditions (in toluene and darkness), the emission properties of the CdS QDs, Sm (2%) doped CdS QDs and Sm (2%) doped CdS/ZnS QDs were studied after 47 days, and 376 days after fabrication of samples. Fig. 9 shows the effect of aging on the CdS QDs, CdS:Sm (2%) QDs, and CdS:Sm (2%)/ZnS core/shell QDs. The synthesized CdS QDs show a sharp emission peak centred at 465 nm and a broad hump in the range 550–750 nm. The peak at a lower wavelength corresponds to the band edge emission (recombination of holes and electrons), while the peak at a higher wavelength is due to the recombination via surface localized states. In the sample after 47 days of fabrication, the band edge emission peak shifts towards a higher wavelength centred at 466.6 nm and the relative intensity decreases by 17.27%. The intensity of the hump in the range of 550–750 nm increases. Similarly, for the sample after 376 days, the band edge emission peak quenches to a large extent with a large redshift, while the peak at a higher wavelength dominates. The peak at band edge emission is quenched with aging owing to the increase in non-radiative transitions. The intensity of hump at a higher wavelength is enhanced because of the increase in the defect levels.57,59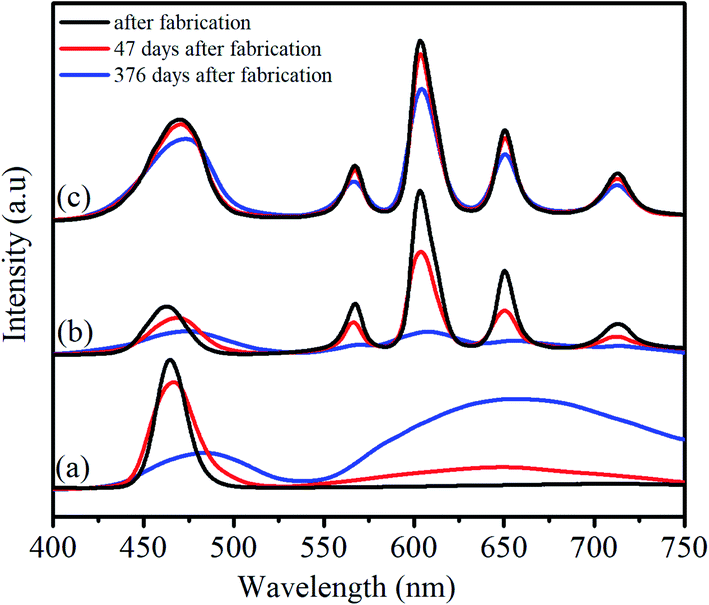 | ||
| Fig. 9 PL spectrum of (a) CdS, (b) CdS:Sm 2%, and (c) CdS:Sm 2%/ZnS QDs according to storage time. | ||
For the CdS:Sm (2%) QDs, the emission spectra of the as-synthesized QDs show a peak at 462.6 nm associated with band edge emission of the CdS host. The peaks observed at 567 nm, 603 nm, 650 nm, and 713 nm correspond to the transitions in energy levels of Sm3+ dopant. After 47 days of fabrication, the relative intensity of all the emission peaks associated with the CdS QDs and Sm3+ ions decreases. After 376 days, the emission peaks are quenched completely, implying the complete degradation of the Sm-doped QDs.
Impressive long-term stability is observed in the case of the CdS:Sm (2%)/ZnS core/shell QDs. After 47 days of fabrication, the relative intensity of the emission peak associated with the band edge emission does not show any significant shift. Besides, the relative intensity at 470 nm only falls by 1.25%. After 376 days of fabrication, there is a small shift of ∼3 nm in the band edge emission peak towards a higher wavelength, and the relative intensity falls by only 5.5%. Thus, the emission studies reveal that core/shell QDs maintain 94.5% of their emission intensity even after 376 days of storage under ambient conditions. There is no significant change in the position of the emission peaks after 47 days of fabrication. A similar trend has been observed for the peaks located in the range of 550–713 nm. Thus, the results indicate that the ZnS shell completely passivates the Sm-doped CdS cores and protects them from oxidative environment and degradation.
5. Conclusion
A series of Sm-doped CdS QDs were synthesized using a facile and simple wet chemical method. The CdS:Sm (2%) QDs were coated with three monolayers of ZnS. The synthesized Sm-doped CdS QDs are spherical with an average size of 4 nm and not affected by the dopant. The synthesized CdS QDs exhibit a cubic structure. The incorporation of dopant follows a substitutional doping mechanism and does not change the structure of the host. With the formation of the ZnS shell over the CdS:Sm (2%) QD core, the particle size of the QDs increases, and characteristic XRD peaks shift toward the higher angles but the cubic structure of QDs remains unchanged. The emission spectra of Sm-doped CdS QDs consist of five peaks including one peak at 465 nm corresponding to the band edge emission of CdS and four peaks at 567 nm, 605 nm, 650 nm, and 713 nm attributed to the f–f transitions in Sm3+ ions dominated by electric dipole 4G5/2–6H9/2 transition at 650 nm. The increase of the dopant concentration significantly reduces the host emission intensity but enhances the emission efficiency of Sm3+ ions due to the ET from host to dopant and the cross-relaxation between Sm3+ ions. The synthesized Sm-doped CdS QDs exhibit broad excitation spectra, therefore the QDs of different colors can be excited using a single wavelength. Raman spectra confirm the formation of single-phase QDs and show that the formation of shell induces strain over the core/shell interface. The effect of aging shows that the formation of ZnS shell gives long term stability with 94.5% of emission efficiency retained after 376 days of storage. The decay lifetime of the fabricated QDs is in the order of milliseconds makes them potential for display applications.Conflicts of interest
There are no conflicts to declare.Acknowledgements
This research is funded by the Vietnam National Foundation for Science and Technology Development (NAFOSTED) under grant number 103.02-2017.350.References
- N. X. Ca, N. Q. Bau, T. L. Phan, V. T. K. Lien, N. T. T. Lieu and N. X. Nghia, J. Alloys Compd., 2017, 697, 401–408 CrossRef CAS.
- N. Amjad and F. Huaxiang, J. Comput. Theor. Nanosci., 2009, 6, 1277–1289 CrossRef.
- N. Zeiri, A. Naifar, S. A. B. Nasrallah and M. Said, Chem. Phys. Lett., 2020, 744, 137215 CrossRef CAS.
- Y. Li, E. C. Y. Liu, N. Pickett, P. J. Skabara, S. S. Cummins, S. Ryley, A. J. Sutherland and P. O'Brien, J. Mater. Chem., 2005, 15, 1238–1243 CAS.
- P. Praus, L. Svoboda, J. Tokarsky, A. Hospodkova and V. Klemm, Appl. Surf. Sci., 2014, 292, 813–822 CrossRef CAS.
- L. Liu, S. Hu, Y. Pan, J. Zhang, Y. Feng and X. Zhang, Beilstein J. Nanotechnol., 2014, 5, 919–926 CrossRef.
- M. Darwish, A. Mohammadi and N. Assi, Mater. Res. Bull., 2016, 74, 387–396 CrossRef CAS.
- C. Li, J. H. Zhao, X. Chen, F. Y. Li, X. L. Zhang, Z. G. Chen and Q. D. Chen, Semicond. Sci. Technol., 2020, 35, 015019 CrossRef CAS.
- F. Xu, Y. Zhao, M. Hu, P. Zhang, N. Kong, R. Liu, C. Liu and S. K. Choid, Chem. Commun., 2018, 54, 9525–9528 RSC.
- X. Wang, S. Chen, S. Thota, Y. Wang, H. Tan, M. Tang, Z. Quan and J. Zhao, J. Phys. Chem. C, 2019, 123, 19238–19245 CrossRef CAS.
- O. Amiri, S. M. H. Mashkani, M. M. Rad and F. Abdvali, Superlattices Microstruct., 2014, 66, 67–75 CrossRef CAS.
- H. Kumar, P. B. Barman and R. R. Singh, Phys. E, 2015, 67, 168–177 CrossRef CAS.
- X. Xu, Y. Yang, H. Jin, B. Pang, R. Yang, L. Yan, C. Jiang, D. Shao and J. Shi, ACS Sustainable Chem. Eng., 2020, 8, 6806–6814 CrossRef CAS.
- S. Bharti, G. Kaur, S. Jain, S. Gupta and S. K. Tripathi, J. Drug Targeting, 2019, 27, 813–829 CrossRef CAS.
- H. T. Van, N. D. Vinh, P. M. Tan, U. T. D. Thuy, N. X. Ca and N. T. Hien, Opt. Mater., 2019, 97, 109392 CrossRef CAS.
- R. P. Panmand, S. P. Tekale, K. D. Daware, S. W. Gosavi, A. Jha and B. B. Kale, J. Alloys Compd., 2020, 817, 152696 CrossRef CAS.
- K. V. Chandekar, M. Shkir, A. Khan and S. AlFaify, Mater. Sci. Semicond. Process., 2020, 118, 105184 CrossRef CAS.
- K. T. Ranjit, H. Cohen, I. Willner, S. Bossmann and A. M. Braun, J. Mater. Sci., 1999, 34, 5273–5280 CrossRef CAS.
- V. X. Quang, P. V. Do, N. X. Ca, L. D. Thanh, V. P. Tuyen, P. M. Tan, V. X. Hoa and N. T. Hien, J. Lumin., 2020, 221, 117039 CrossRef CAS.
- A. G. Khosroshahi and A. Mehrizad, J. Mol. Liq., 2019, 275, 629 CrossRef CAS.
- S. B. Ubale, T. T. Ghogare, V. C. Lokhande, T. Ji and C. D. Lokhande, SN Appl. Sci., 2020, 2, 756 CrossRef CAS.
- N. S. Rao, M. Rajesh, K. Prasad, G. R. Reddy, B. D. P. Raju and S. Dhanapandian, Lumin, 2020, 35, 1–7 CrossRef.
- P. V. Do, V. X. Quang, L. D. Thanh, V. P. Tuyen, N. X. Ca, V. X. Hoa and H. V. Tuyen, Opt. Mater., 2019, 92, 174–180 CrossRef.
- K. Ashwini, C. Pandurangappa, K. Avinash, S. Srinivasan and E. Stefanakos, J. Lumin., 2020, 221, 117097 CrossRef CAS.
- Q. Xiao, Z. Si, Z. Yu and G. Qiu, Mater. Sci. Eng., B, 2007, 137, 189–194 CrossRef CAS.
- J. C. Sin, S. M. Lam, K. T. Lee and A. R. Mohamed, J. Colloid Interface Sci., 2013, 401, 40–49 CrossRef CAS.
- P. M. Tan, N. X. Ca, N. T. Hien, H. T. Van, P. V. Do, L. D. Thanh, V. H. Yen, V. P. Tuyen, Y. Peng and P. T. Tho, Phys. Chem. Chem. Phys., 2020, 22, 6266–6274 RSC.
- N. X. Ca, N. T. Hien, P. M. Tan, T. L. Phan, L. D. Thanh, P. V. Do, N. Q. Bau, V. T. K. Lien and H. T. Van, J. Alloys Compd., 2019, 791, 144–151 CrossRef CAS.
- U. Hotje, C. Rose and M. Binnewies, Sol. Sta. Sci., 2003, 5, 1259–1262 CrossRef CAS.
- G. Chena, B. Yi, G. Zenga, Q. Niua, M. Yana, A. Chena, J. Dua, J. Huanga and Q. Zhang, Colloids Surf., B, 2014, 117, 199–205 CrossRef.
- M. A. Manthrammel, M. Shkir, S. Shafik, M. Anis and S. AlFaify, J. Mater. Res., 2020, 35, 410–421 CrossRef CAS.
- N. X. Ca, N. T. Hien, N. T. Luyen, V. T. K. Lien, L. D. Thanh, P. V. Do, N. Q. Bau and T. T. Pham, J. Alloys Compd., 2019, 787, 823–830 CrossRef CAS.
- P. T. Tho, N. D. Vinh, H. T. Van, P. M. Tan, V. X. Hoa, N. T. Kien, N. T. Hien, N. T. K. Van and N. X. Ca, J. Phys. Chem. Solids, 2020, 139, 109332 CrossRef CAS.
- I. E. Kolesnikov, E. V. Golyeva, M. A. Kurochkin, E. Y. Kolesnikov and E. Lähderanta, J. Lumin., 2020, 219, 116946 CrossRef CAS.
- L. Saravanan, R. Jayavel, A. Pandurangan, L. J. Hsin and M. H. Yuan, Mater. Res. Bull., 2014, 52, 128–133 CrossRef CAS.
- A. Khan, M. Shkir, M. A. Manthrammel, V. Ganesh, I. S. Yahia, M. Ahmed, A. M. El-Tonia, A. Aldalbahi, H. Ghaithan and S. AlFaify, Ceram. Int., 2019, 45, 10133–10141 CrossRef CAS.
- C. V. Reddy, J. Shim and M. Cho, J. Phys. Chem. Solids, 2017, 103, 209–217 CrossRef CAS.
- B. O. Dabbousi, J. R. Viejo, F. V. Mikulec, J. R. Heine, H. Mattoussi, R. Ober, K. F. Jensen and M. G. Bawendi, J. Phys. Chem., 1997, 101, 9463–9475 CrossRef CAS.
- A. B. Sharma, S. K. Sharma, M. Sharma, R. K. Pandey and D. S. Reddy, Spectrochim. Acta, 2009, 72, 285–290 CrossRef CAS.
- B. Schreder, C. Dem, M. Schmitt, A. Materny, W. Kiefer, U. Winkler and E. Umbach, J. Raman Spectrosc., 2003, 34, 100–103 CrossRef CAS.
- P. Balaz, M. Balaz, E. Dutkova, A. Zorkovska, J. Kovac, P. Hronec, J. Kovac Jr, M. Caplovicova, J. Mojzis, G. Mojzisova, A. Eliyas and N. G. Kostova, Mater. Sci. Eng., C., 2016, 58, 1016–1023 CrossRef CAS.
- N. X. Ca, V. T. K. Lien, N. X. Nghia, T. T. K. Chi and T. L. Phan, Nanotechnology, 2015, 26, 445701 CrossRef.
- S. Parani, N. Tsolekile, K. Pandian and O. S. Oluwafemi, J. Mater. Sci.: Mater. Electron., 2017, 28, 11151 CrossRef CAS.
- G. R. Bhand and N. B. Chaure, Mater. Sci. Semicond. Process., 2017, 68, 279–287 CrossRef CAS.
- R. Rajendran, K. Varadharajan and V. Jayaraman, Colloids Surf., A, 2019, 580, 123688 CrossRef CAS.
- R. Rajendran, V. Jayaraman and K. Varadharajan, J. Phys. Chem. Solids, 2019, 129, 261–269 CrossRef CAS.
- N. Kakuta, J. M. White, A. Campion, A. J. Bard, M. A. Fox and S. E. Webber, J. Phys. Chem., 1985, 89, 48–52 CrossRef CAS.
- W. W. Yu, L. Qu, W. Guo and X. Peng, Chem. Mater., 2003, 15, 2854–2860 CrossRef CAS.
- N. X. Ca, H. T. Van, P. V. Do, L. D. Thanh, P. M. Tan, N. X. Truong, V. T. K. Oanh, N. T. Binh and N. T. Hien, RSC Adv., 2020, 10, 25618 RSC.
- Q. Xiao, Q. Zhou and M. Li, J. Lumin., 2010, 130, 1092–1094 CrossRef CAS.
- V. V. Ursaki, V. Lair, L. Zivkovic, M. Cassir, A. Ringuede and O. Lupan, Opt. Mater., 2012, 34, 1897–1901 CrossRef CAS.
- Y. Liu, C. Zhai, K. Zhang, L. Du, M. Zhu and M. Zhang, J. Magn. Magn. Mater., 2020, 503, 166618 CrossRef.
- K. Swapna, S. Mahamuda, A. S. Rao, S. Shakya, T. Sasikala, D. Haranath and G. V. Prakash, Spectrochim. Acta, Part A, 2014, 125, 53 CrossRef CAS.
- C. Zhai, H. Zhang, N. Du, B. Chen, H. Huang, Y. Wu and D. Yang, Nanoscale Res. Lett., 2011, 6, 1–5 Search PubMed.
- D. Shaw, J. Cryst. Growth, 1988, 86, 778 CrossRef CAS.
- Z. Jiang and D. F. Kelley, J. Phys. Chem. C, 2013, 117, 6826–6834 CrossRef CAS.
- B. M. Walsh, Judd-Ofelt theory: principles and practices, Springer, Dordrecht, 2006, pp. 403–433, ISBN 978-1-4020-4789-3, DOI:10.1007/1-4020-4789-4_21.
- N. X. Ca, N. T. Hien, P. N. Loan, P. M. Tan, U. T. D. Thuy, T. L. Phan and Q. B. Nguyen, J. Electron. Mater., 2019, 48, 2593–2599 CrossRef CAS.
- N. T. Hien, T. T. K. Chi, N. D. Vinh, H. T. Van, L. D. Thanh, P. V. Do, V. P. Tuyen and N. X. Ca, J. Lumin., 2020, 217, 116822 CrossRef CAS.
- C.-W. Wang and M. G. Moffitt, Langmuir, 2004, 20, 11784–11796 CrossRef CAS.
- G. Dong, X. Xiao, Y. Chi, B. Qian, X. Liu, Z. Ma, S. Ye, E. Wu, H. Zeng, D. Chen and J. Qiu, J. Phys. Chem. C, 2009, 113, 9595–9600 CrossRef CAS.
- R. Yu, H. M. Noh, B. K. Moon, B. C. Choi, J. H. Jeong, H. S. Lee, K. Jang and S. S. Yi, J. Lumin., 2014, 145, 717–722 CrossRef CAS.
- V. X. Quang, N. N. Dat, V. P. Tuyen, N. M. Khaidukov, V. N. Makhov, L. D. Thanh, N. X. Ca, N. T. Thanh, P. T. T. Nga and P. V. Do, Opt. Mater., 2020, 107, 110049 CrossRef CAS.
| This journal is © The Royal Society of Chemistry 2021 |