 Open Access Article
Spinel LiMn2O4 nanoparticles fabricated by the flexible soft template/Pichini method as cathode materials for aqueous lithium-ion capacitors with high energy and power density
Junyu Xiang†
ab,
Pengxue Zhang†ab,
Shixian Lvab,
Yongjun Maab,
Qi Zhaoab,
Yan Suiab,
Yuncheng Yeab and
Chuanli Qin *ab
*ab
aKey Laboratory of Chemical Engineering Process & Technology for High-efficiency Conversion, College of Heilongjiang Province, Harbin 150080, PR China. E-mail: qinchuanli@hlju.edu.cn
bSchool of Chemistry and Materials Science, Heilongjiang University, Harbin 150080, China
First published on 21st April 2021
Abstract
Spinel LiMn2O4 (LMO) with a three-dimensional structure has become one of the cathode materials that has gained the most interest due to its safety, low price and abundant resources. However, the lithium ion transmission is limited by large particle size and particle agglomeration of LMO. Thus, reducing the particle size and agglomeration of LMO can effectively improve its lithium ion transmission. Here, we synthesized a LMO cathode material with a nanoscale crystal size using the flexible expanded graphite (EG) soft template and Pichini method. EG-controlled particle size and particle agglomeration of LMO is conducive to charge transfer and diffusion of lithium ions between LMO and the electrolyte, meanwhile, there are more redox sites on the nanosized LMO particles, which makes the redox reaction of LMO more thorough during the charge and discharge process, resulting in high capacitance performance. In order to obtain the considerably required lithium-ion capacitors (LICs) with high energy density and power density, we assembled aqueous LMO//activated carbon (AC) LICs with 5 M LiNO3 as the aqueous electrolytes, which are environmentally friendly, safe, low cost and have higher electrical conductivity than organic electrolytes. The optimal LIC has an energy density of 32.63 W h kg−1 at a power density of 500 W kg−1 and an energy density of 8.06 W h kg−1 at a power density of 10![[thin space (1/6-em)]](https://www.rsc.org/images/entities/char_2009.gif) 000 W kg−1, which is higher than most of the LMO-based LICs in previous reports. After 2000 cycles, the specific capacitance retention rate was 75.9% at a current density of 3 A g−1. Therefore, our aqueous LMO//AC LICs synthesized by the soft template/Pichini method have wide prospects and are suitable for low-cost, high-safety and high-power applications.
000 W kg−1, which is higher than most of the LMO-based LICs in previous reports. After 2000 cycles, the specific capacitance retention rate was 75.9% at a current density of 3 A g−1. Therefore, our aqueous LMO//AC LICs synthesized by the soft template/Pichini method have wide prospects and are suitable for low-cost, high-safety and high-power applications.
1. Introduction
Over the past few decades, the economic development of the world has been becoming rapid. Energy resource exhaustion and environmental pollution have become two great challenges to humankind,1 so the research on new energy and energy storage devices is of paramount importance.2,3 At the same time, the development of highly efficient energy storage devices with high power and energy density is becoming a more and more important and urgent issue with the increasing demand for electric vehicles.4,5 It is generally believed that two kinds of traditional electrochemical energy storage systems are lithium-ion batteries (LIBs) and double-layer capacitors (EDLCs).6,7 LIBs have higher energy density,8,9 but cannot meet the demand of high power density.10 On the contrary, EDLCs have higher power density,11,12 but cannot be sufficient to meet the demand of high energy density.13 Hybrid lithium-ion capacitors (LICs) have become the most viable alternative. LICs consist of a battery-type electrode and a capacitor-type electrode.14 The insertion and extraction of lithium ions at lithium-containing cathode make it have high energy, and the excellent power density comes from the absorption and desorption of anions by the activated carbon electrode.15 Therefore, LICs possess high energy density and power density properties simultaneously.Up till now, several Li-ion active cathode materials have been reported, such as LiCoO2, LiFePO4 and LMO.16–18 Due to the characteristics of safe, low price and rich in resources, spinel LMO cathode materials have become a research hotspot in recent years.18–20 Diffusion of lithium ions in spinel LMO is three-dimensional,21 different from olivine LiFePO4 (one-dimensional ion diffusion channel) and layered rock-salt LiCoO2 (two-dimensional ion diffusion channel),22 which is very conducive to the insertion and extraction of lithium ions.23 However, the spinel LMO crystal is deformed during the charge and discharge process, which will cause the degradation of reversible capacity, rate capability, and cycling stability.24,25 Many modification methods have been investigated to improve the performance of spinel LMO materials, such as ion doping, surface coating, and morphology control.18,26 As we know, the particle size and distribution of electrode materials will affect their electrochemical performances, so reducing the particle size and particle agglomeration of LMO can very effectively shorten the lithium-ion transmission distance and improve its electrochemical performances.18,27–29 Graphene as a porous carbon material has been used as a binder-free supercapacitor electrode or as a template to synthesize the anode and cathode material.30–32 Gao et al. prepared three-dimensional graphene framework with orientated laminar structure and interconnected macropores by the hard template-directed ordered assembly, which exhibited high specific surface area, controllable pores, mechanical flexibility and was employed as the binder-free supercapacitor electrode.33 Liu et al. synthesized a nitrogen-doped graphene/MnO2 nanosheet (NGMn) composite using a simple hydrothermal method and nitrogen-doped graphene as a template to induce the growth of layered δ-MnO2, which exhibits a large specific capacitance of about 305 F g−1 at a scan rate of 5 mV s−1.34 Expanded graphite (EG) as another porous carbon material is less expensive than graphene, and its larger interlayer distance facilitates the introduction of other electrode materials. In addition, EG with uniform pores limits the agglomeration and particle size of LMO particles, and then as a soft template can be sacrificed during high-temperature oxidation, thus retaining the performances of active electrode materials. Therefore, from the application point of view, the introduction of EG as a soft template can synthesize pure LMO materials with small particle size and controlled particle agglomeration, which facilitates the charge transfer and diffusion of lithium ions between LMO and electrolyte, meanwhile, there are more redox sites on the nanosized LMO particles, which makes the redox reaction of LMO materials more thorough during the charge and discharge process, resulting in high capacitance performance.35–37
Due to environmentally friendly, safe and low cost, aqueous electrochemical energy storage systems have been widely concerned by many scholars.14,38,39 The higher conductivity of aqueous electrolytes also makes it a more favorable choice than organic electrolytes.40–42 However, compared to organic electrolytes, aqueous electrolytes usually have a much narrower potential window,43 which will greatly affect its energy density and power density.44 Therefore, in order to meet the needs of practical applications, the excellent energy-power output performance can be achieved by broadening the potential window.
Based on all the above, we successfully synthesized LMO electrode material by the flexible soft template/Pichini method, in which the citric acid-assisted Pechini method and the EG soft template method were simultaneously used to fabricate spinel LMO nanoparticles with reduced particle size and particle agglomeration. The LMO nanoparticles have good rate performance, high energy density and high power density. In order to optimize the energy-power output performance, we used 5 M LiNO3 as the electrolyte to assemble aqueous LMO//active carbon (AC) LICs and adjusted the potential window. The energy density and power density of the obtained LMO//AC LICs are significantly higher than those of most reported LICs using LMO as cathode materials. The results show that our aqueous LMO//AC LICs have a promising application prospect and are suitable for low-cost, high-safety, high-power applications.
2. Experimental
2.1 Synthesis of LiMn2O4
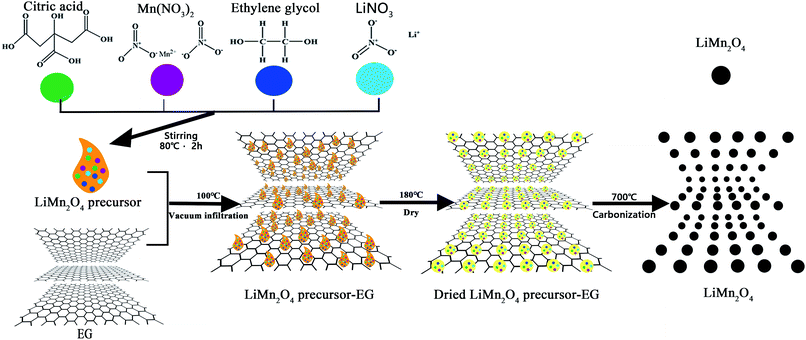
Expandable graphite (carbon content over 99 at%, Qingdao Tianyuan Graphite Co., Ltd.) with a diameter of about 30 μm and an expansion ratio of 300 mL g−1 was put in an oven and heated to 950 °C for about 30 seconds. Then the EG used in subsequent experiments was obtained and its interlayer distance was increased. LMO was synthesized by the citric acid-assisted Pechini method and the EG soft template method. LiNO3 (CP, Shanghai Zhanyun Chemical Co., Ltd.), 50% Mn(NO3)2 solution (AR, Shanghai Aladdin Biochemical Technology Co., Ltd.), citric acid (AR, Tianjin Guangfu Technology Development Co., Ltd.) and ethylene glycol (AR, Tianjin Binhai Kedi Chemical Reagent Co., Ltd.) were mixed in deionized water, and then the solution was stirred at 80 °C for 2 h to obtain a precursor solution. The molar ratio of metal ions, citric acid, and ethylene glycol is 1![[thin space (1/6-em)]](https://www.rsc.org/images/entities/char_2009.gif) :
:![[thin space (1/6-em)]](https://www.rsc.org/images/entities/char_2009.gif) 1
1![[thin space (1/6-em)]](https://www.rsc.org/images/entities/char_2009.gif) :
:![[thin space (1/6-em)]](https://www.rsc.org/images/entities/char_2009.gif) 4. Add a portion of the precursor solution to the EG, and heat it at 100 °C for a period of time in a vacuum environment to ensure that all the precursor has penetrated into EG, and then add another portion of the precursor solution with the same step. Repeat this operation until all addition is complete. The precursor/EG mixture was dried in an oven at 180 °C for 10 h under air. Finally, it was placed in a muffle furnace and calcined at 700 °C for 10 h in an air environment, and then naturally cooled in the furnace to room temperature to obtain the final LMO product. Different amounts (0, 10, 15, 20 and 25 wt%) of EG were used in the experiment and the obtained LMO products are denoted as S1, S2, S3, S4, and S5 respectively. Fig. 1 illustrates the preparation process of LMO.
4. Add a portion of the precursor solution to the EG, and heat it at 100 °C for a period of time in a vacuum environment to ensure that all the precursor has penetrated into EG, and then add another portion of the precursor solution with the same step. Repeat this operation until all addition is complete. The precursor/EG mixture was dried in an oven at 180 °C for 10 h under air. Finally, it was placed in a muffle furnace and calcined at 700 °C for 10 h in an air environment, and then naturally cooled in the furnace to room temperature to obtain the final LMO product. Different amounts (0, 10, 15, 20 and 25 wt%) of EG were used in the experiment and the obtained LMO products are denoted as S1, S2, S3, S4, and S5 respectively. Fig. 1 illustrates the preparation process of LMO.
2.2 Assembly of LiMn2O4//AC LICs
LICs consist of cathode, anode and battery separators, and they were tested in 5 M LiNO3 electrolyte. The active material of the cathode is LMO. The conductive agent is carbon black (ECP-CB-1, Beijing Tebao Conductive Powder Material Development Center, China) and the binder is 5 wt% polytetrafluoroethylene (PTFE) (Shanghai Bueze Industry & Trade Co. Ltd, China). LMO, carbon black and PTFE were dissolved in deionized water at a ratio of 75![[thin space (1/6-em)]](https://www.rsc.org/images/entities/char_2009.gif) :
:![[thin space (1/6-em)]](https://www.rsc.org/images/entities/char_2009.gif) 20
20![[thin space (1/6-em)]](https://www.rsc.org/images/entities/char_2009.gif) :
:![[thin space (1/6-em)]](https://www.rsc.org/images/entities/char_2009.gif) 5 to form a paste and coated on a nickel foam current collector, dried at 60 °C for 24 hours, then pressed with a double roller machine to form a cathode. The active material of the anode is activated carbon (AC, minimum 99% purity, Ningde Xinsen Chemical Co. Ltd, China) whose specific surface area is 2000–3000 m2 g−1. The conductive agent is graphite (ECP-GR1000, Beijing Tebao Conductive Powder Material Development Center, China) and the binder is 5 wt% PTFE. AC, graphite and PTFE were used to produce a anode at a ratio of 90
5 to form a paste and coated on a nickel foam current collector, dried at 60 °C for 24 hours, then pressed with a double roller machine to form a cathode. The active material of the anode is activated carbon (AC, minimum 99% purity, Ningde Xinsen Chemical Co. Ltd, China) whose specific surface area is 2000–3000 m2 g−1. The conductive agent is graphite (ECP-GR1000, Beijing Tebao Conductive Powder Material Development Center, China) and the binder is 5 wt% PTFE. AC, graphite and PTFE were used to produce a anode at a ratio of 90![[thin space (1/6-em)]](https://www.rsc.org/images/entities/char_2009.gif) :
:![[thin space (1/6-em)]](https://www.rsc.org/images/entities/char_2009.gif) 10
10![[thin space (1/6-em)]](https://www.rsc.org/images/entities/char_2009.gif) :
:![[thin space (1/6-em)]](https://www.rsc.org/images/entities/char_2009.gif) 10 in the same manner as the above-mentioned cathode. Insert a battery separator (PPAS-10 (2), Shanghai Shilong Science and Technology Co. Ltd, China) between the cathode and the anode. Then use two plexiglass plates with holes to clamp the cathode and anode from both sides, and use PTFE screws to fix the plexiglass plates and get LICs. The assembled LICs stood for 3 days before testing.
10 in the same manner as the above-mentioned cathode. Insert a battery separator (PPAS-10 (2), Shanghai Shilong Science and Technology Co. Ltd, China) between the cathode and the anode. Then use two plexiglass plates with holes to clamp the cathode and anode from both sides, and use PTFE screws to fix the plexiglass plates and get LICs. The assembled LICs stood for 3 days before testing.
2.3 Material characterization
The X-ray diffraction (XRD, BURKER, D8 ADVANCE, Germany) using Cu-Ka radiation was used to analyze the crystal structure of samples and was performed at 40 kV, 30 mA, and 10–80°. The thermogravimetric analysis (TG, TGA/DSC1, Mettler AG, Switzerland) was used to study the thermal decomposition and crystallization temperature of the precursors, and it was performed at a heating rate of 10 °C min−1 from the room temperature to 900 °C in air atmosphere. The scanning electron microscope (SEM, Philips, FEI Sirion, Netherlands) was used to observe the microscopic morphology of the samples.2.4 Electrochemical measurement
The cyclic voltammetry (CV) used a three-electrode system on the LK98BII computer electrical analysis system (CV, LANLIKE, LK98BII, China) and tested at different potential windows and different scan rates. The three-electrode system is composed of the LMO electrode as a working electrode, platinum electrode as a counter electrode and saturated calomel electrode (SCE) as a reference electrode. The electrolyte is 5 M LiNO3. The specific capacitance (Cpe) of electrode materials was calculated using eqn (1) as follows:45
 | (1) |
The electrochemical impedance measurements (EIS, Zahner, IM6e, Germany) were performed using the same three-electrode system as the CV test. Nyquist plots were obtained with an AC signal of 10 mV over a frequency range of 100 kHz to 10 MHz.
The galvanostatic charge/discharge (GC) measurements of LICs were performed by a battery programmed test instrument (GC Landiandianzi, CT2001A, China) in a potential range of 0–2.0 V in 5 M LiNO3 electrolyte. The mass ratio of the cathode and anode is 1![[thin space (1/6-em)]](https://www.rsc.org/images/entities/char_2009.gif) :
:![[thin space (1/6-em)]](https://www.rsc.org/images/entities/char_2009.gif) 2. The specific capacitance (Cps), Energy density (E) and power density (P) of LICs were calculated using the eqn (2)–(4) as follows:46
2. The specific capacitance (Cps), Energy density (E) and power density (P) of LICs were calculated using the eqn (2)–(4) as follows:46
| Cps = It/ΔUm | (2) |
 | (3) |
| P = UmI/m | (4) |
3. Results and discussion
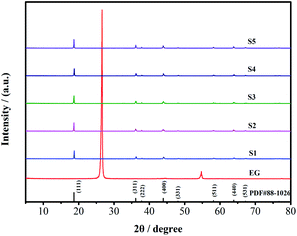
Fig. 2 displays the XRD patterns of the synthesized S1–S5 and as-prepared pure EG. The diffraction peaks of the main crystal planes (111), (311), (222), (400), (331), (511), (440) and (531) of all the LMO samples are at 2θ = 18.6°, 36.1°, 37.8°, 43.9°, 48.1°, 58.2°, 63.9°, and 67.2°, which completely agree with the planes of the standard spinel LMO (JCPDS card no. 88-1026). It means that S1–S5 have been successfully synthesized. The pure EG sample exhibits a major diffraction peak at 2θ = 26.6°, but there is no similar peak found in S1–S5. This shows that EG as the soft template has been completely oxidized and removed during the synthesis of LMO and it does not affect the structure of LMO crystal. The average crystal size (D) of LMO is obtained by the following equation:
β![[thin space (1/6-em)]](https://www.rsc.org/images/entities/char_2009.gif) cos(θ) = κλ/D cos(θ) = κλ/D
| (5) |
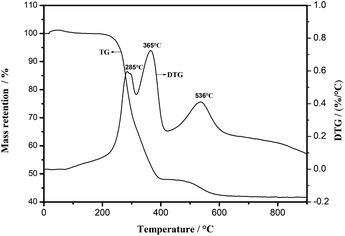
Fig. 3 shows the TG and derivative thermogravimetry (DTG) curves of LMO precursor-EG composite. It can be seen that between 200 °C and 600 °C, the weight of the LMO precursor-EG composite continues to decrease, and the three peaks displayed by the DTG curve at 285 °C, 365 °C and 536 °C represent the rapid conversion of the precursor to LMO material and the rapid oxidation of EG. When the temperature reaches 700 °C at which EG is completely oxidized and the residual weight has been stabilized. So it can be determined that the expected LMO can be obtained at 700 °C.
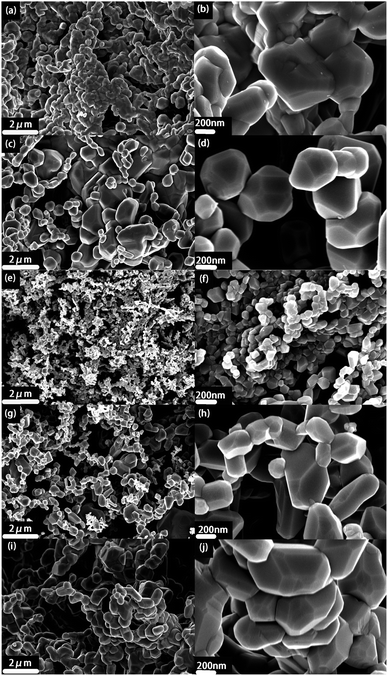
Fig. 4 shows SEM images of S1–S5. From Fig. 4a and b, it can be seen that S1 without EG is composed of submicron-sized particles (about 600–800 nm) due to the fact that there are no restrictions from EG on the growth and coalescence of S1. And SEM images of S2, S4 and S5 (Fig. 4c, d and g–j) also display uneven large particles on the submicron scale, attributed to the insufficient or excessive EG soft template. By comparison, as shown in Fig. 4e and f, S3 with 15 wt% EG soft template exhibits uniform nano-sized particles (about 100 nm). It is due to the fact that during the formation of LMO, the uniform pores of EG limit the growth and agglomeration of particles and the size of the formed LMO particles has been stabilized when EG is completely oxidized. Therefore, uniform nanoscale LMO particles can be obtained by adding 15 wt% EG soft template. The uniform nanoscale LMO particles are conducive to charge transfer and diffusion of lithium ions between LMO and electrolyte. Furthermore, there are more redox sites on the nanosized LMO particles, which makes the redox reaction of LMO more thorough during the charge and discharge process.
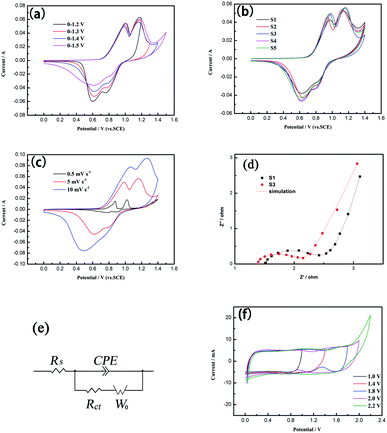
CV measurements were performed with three-electrode systems in 5 M LiNO3 electrolyte. Fig. 5(a) shows the potential window optimization process for the three-electrode system at a scan rate of 5 mV s−1. A cathode peak is incomplete in the 0–1.3 V (vs. SCE) potential window and a significant redundant oxidation peak occurs at 1.5 V, so 0–1.4 V is the optimal potential window range and was selected as the standard for the test of the three-electrode system. Fig. 5(b) shows the CV curves of S1, S2, S3, S4 and S5 at a scan rate of 5 mV s−1 with a potential window of 0–1.4 V. It can be seen that the oxidation peaks of samples are at the potentials of 0.9–1.0 V and 1.1–1.2 V and the reduction peaks are 0.6–0.7 V and 0.8–0.9 V, which can correspond to the two redox reactions of LMO, indicating that there are two steps for the insertion and extraction of Li+ in the LMO spinel phase. The two-step process is shown below:47
| LiMn(III, IV)2O4 ↔ Li0.5Mn(III, IV)2O4 + 0.5Li+ + 0.5 | (6) |
| Li0.5Mn(III, IV)2O4 ↔ Mn(IV)2O4 + 0.5Li+ + 0.5e− | (7) |
Cpe values calculated for these samples based on eqn (1) were shown in Table 1. With the increase of EG, the Cpe values of LMO samples increase first and then decrease, the Cpe value of S3 is the best. This is because an appropriate amount of EG can effectively control the LMO particle size and agglomeration, thus improving the electron transport, ion diffusion ability and Cpe, but excessive EG will affect the formation of well-dispersed LMO precursor in the pores of EG, thereby affecting the improvement of Cpe. Fig. 5(c) shows the CV curves of S3 from 1 mV s−1 to 10 mV s−1. All the curves show two pairs of peaks, corresponding to the insertion and extraction process of Li+. As the scan rate increases, the two pairs of peaks move to both sides, respectively, and the Cpe values decrease as shown in Table 2.
| Samples | S1 | S2 | S3 | S4 | S5 |
|---|---|---|---|---|---|
| Cpe (F g−1) | 726.34 | 742.12 | 800.54 | 733.55 | 737.50 |
| Scan rates | 0.5 mV s−1 | 5 mV s−1 | 10 mV s−1 |
|---|---|---|---|
| Cpe (F g−1) | 828.04 | 800.54 | 751.18 |
In order to detect the charge transfer and ion diffusion capabilities of the optimized S3, EIS tests were performed. Fig. 5(d) and (e) show the Nyquist plots of S1 and S3 fitted by Zview™ software and the corresponding equivalent circuit. The Nyquist plots consist of a semicircle in the high-frequency region and a straight line in the low-frequency region. The semicircle is related to the charge transfer resistance (Rct), at very high-frequen region the intercept of the straight line at x-axis represents the bulk solution resistance (Rs) and at low-frequency region the straight line is related to the mass transfer or diffusion of electrolyte ions. The equivalent circuit diagram consists of Rs, Rct, constant phase element (CPE) and Warburg diffusion element (W0). The Rct values of S1 and S3 are 1.158 Ω and 0.592 Ω, and their Rs values are 1.482 Ω and 1.391 Ω, respectively. The Rct and Rs values of S3 were lower than those of S1. The diameter of the semicircle and the slope of the straight line in Fig. 5(d) can also reflect the same regularity. This shows that S3 exhibits the improved charge transfer and ion diffusion abilities by adding an appropriate amount of EG to control the particle size and particle agglomeration of LMO particles during the synthesis process, which results in high capacitance performance of S3. In order to achieve better energy density and power density of LIC, the process of optimizing the potential window range by the CV tests of the two-electrode system was shown in Fig. 5(f). The potential window range of 0–2.0 V is relatively wide, without water reduction or oxidation processes, while significant redundant oxidation peak occurs at 2.2 V. So 0–2.0 V is the best potential window range for LICs.
GC tests were performed with two-electrode LICs in 5 M LiNO3 electrolyte. Fig. 6(a) shows the GC curves of S1//AC LIC and S3//AC LIC at a current density of 0.5 A g−1. The discharging curves of the two LICs almost symmetrically correspond to the charging curves. It shows that both S1//AC LIC and S3//AC LIC have good electrochemical reversibility. The two-step charge/discharge process can be represented by eqn (8) and (9):47
| LiMn(III, IV)2O4 ↔ Li0.5Mn(III, IV)2O4 + 0.5Li+ + 0.5e− | (8a) |
| AC + 0.5Li+ + 0.5e− ↔ AC−0.5//0.5Li+ | (8b) |
| Li0.5Mn(III, IV)2O4 ↔ Mn(IV)2O4 + 0.5Li+ + 0.5e− | (9a) |
| AC−0.5//0.5Li+ + 0.5Li+ + 0.5e− ↔ AC−//Li+ | (9b) |
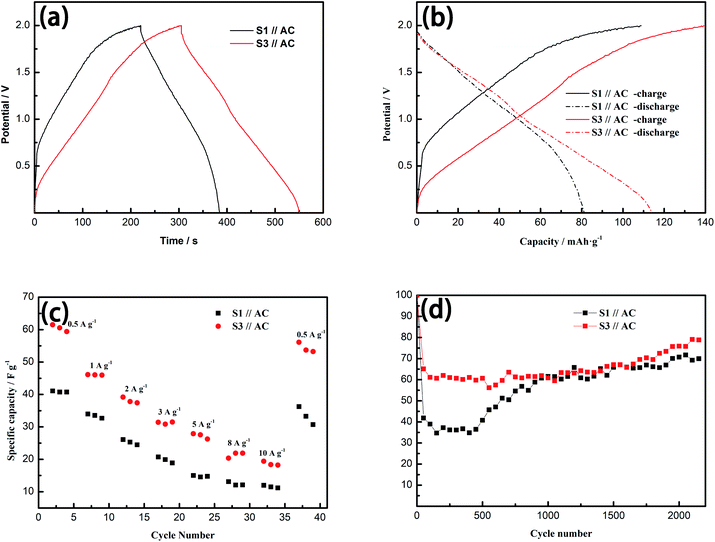 | ||
| Fig. 6 (a) GC curves and (b) voltage profiles at 0.5 A g−1, (c) rate performance from 0.5 A g−1 to 10 A g−1 and (d) cycle performance at 3 A g−1 of S1//AC LIC and S3//AC LIC. | ||
According to eqn (2), Cps of S1//AC LIC and S3//AC LIC at the current density of 0.5 A g−1 are 41.10 F g−1 and 61.49 F g−1. The better electron transport and ion diffusivity of S3 make its higher Cps than S1. The potential profiles of S1//AC LIC and S3//AC LIC were shown in Fig. 6 (b). The discharge capacity of S3//AC LIC can reach 113.8 mA h g−1, higher than 81.3 mA h g−1 of S1//AC LIC.
To further investigate the rate performance of LICs, GC tests were performed on S1//AC LIC and S3//AC LIC in 5 M LiNO3 electrolyte under varying current densities, as displayed in Fig. 6(c). As the current density increases, S3//AC LIC has better performance retention than S1//AC LIC. And when the current density drops back to the original 0.5 A g−1, S3//AC LIC has more stable specific capacitance retention. The cyclic stability of LICs was also tested in 5 M LiNO3 electrolyte by GC measurement. Fig. 6(d) shows the specific capacitance values of S1//AC LIC and S3//AC LIC at a current density of 3A g−1 for 2000 cycles. The specific capacitance values of the two LICs decayed rapidly in the initial 50 cycles, but the attenuation of S3//AC LIC is significantly smaller than that of S1//AC LIC. It is interesting to note that after 50 cycles, the specific capacitance values of the two LICs keep no longer dropping and even start a slow upward trend until the 2000th cycle. This is due to the slow activation process of the electrode material and the sufficient infiltrating of the electrode by the electrolyte in these LICs. After 2000 cycles, the retention rate of S3//AC LIC is 75.9%, higher than that of S1//AC LIC (70.7%). Obviously, S3//AC LIC has long-term electrochemical stability.
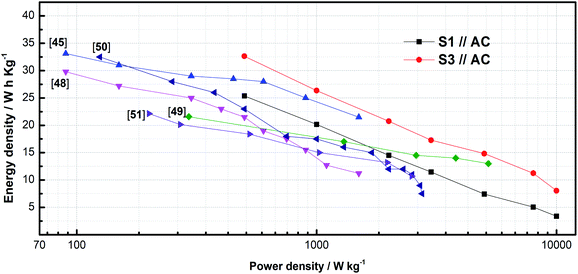
To further explore the advantages of LICs in practical applications, the Ragone plots of E versus P for different LICs were shown in Fig. 7. The values of E and P were obtained by eqn (3) and (4). According to Fig. 7, it can be seen that in the range of P between 500 W kg−1 and 10![[thin space (1/6-em)]](https://www.rsc.org/images/entities/char_2009.gif) 000 W kg−1, E values of S3//AC LIC are much higher than those of S1//AC LIC, especially at high power density. Among them, when P is 500 W kg−1, 5000 W kg−1 and 10
000 W kg−1, E values of S3//AC LIC are much higher than those of S1//AC LIC, especially at high power density. Among them, when P is 500 W kg−1, 5000 W kg−1 and 10![[thin space (1/6-em)]](https://www.rsc.org/images/entities/char_2009.gif) 000 W kg−1, E of S1//AC LIC is 25.38 W h kg−1, 7.43 W h kg−1 and 3.39 W h kg−1, while E of S3//AC LIC is 32.63 W h kg−1, 14.83 W h kg−1, 8.06 W h kg−1. And E of S3//AC LIC at high P is more than twice as much as that of S1//AC LIC. It is worth mentioning that, as far as we know, the S3//AC LIC has better E values than most of the previously reported LMO-based LICs when compared at the same P, including AC//porous LMO (25.02 W h kg−1 at a power density of 900 W kg−1),45 AC//LMO-NH (11.2 W h kg−1 at a power density of 1500 W kg−1),48 BPLMO//AC (13 W h kg−1 at a power density of 5200 W kg−1),49 AC//LMO (10 W h kg−1 at a power density of 2000 W kg−1)50 and LMO/NG (22.15 W h kg−1 at a power density of approximately 200 W kg−1).51 More importantly, S3//AC LIC can still maintain such energy density under high power density, which should be attributed to the improved charge transfer, ion diffusion abilities and more redox sites from the nanosized LMO particles, and a wider operating window of the LIC. Therefore, this should be a promising way to develop LICs with high energy and power density.
000 W kg−1, E of S1//AC LIC is 25.38 W h kg−1, 7.43 W h kg−1 and 3.39 W h kg−1, while E of S3//AC LIC is 32.63 W h kg−1, 14.83 W h kg−1, 8.06 W h kg−1. And E of S3//AC LIC at high P is more than twice as much as that of S1//AC LIC. It is worth mentioning that, as far as we know, the S3//AC LIC has better E values than most of the previously reported LMO-based LICs when compared at the same P, including AC//porous LMO (25.02 W h kg−1 at a power density of 900 W kg−1),45 AC//LMO-NH (11.2 W h kg−1 at a power density of 1500 W kg−1),48 BPLMO//AC (13 W h kg−1 at a power density of 5200 W kg−1),49 AC//LMO (10 W h kg−1 at a power density of 2000 W kg−1)50 and LMO/NG (22.15 W h kg−1 at a power density of approximately 200 W kg−1).51 More importantly, S3//AC LIC can still maintain such energy density under high power density, which should be attributed to the improved charge transfer, ion diffusion abilities and more redox sites from the nanosized LMO particles, and a wider operating window of the LIC. Therefore, this should be a promising way to develop LICs with high energy and power density.
4. Conclusions
We have successfully prepared the LMO material by the flexible soft template/Pichini method. EG-controlled particle size and particle agglomeration of LMO is conducive to charge transfer and diffusion of lithium ions between LMO and electrolyte, and has more redox sites, resulting in high capacitance performance. More importantly, the optimal S3//AC LICs in 5 M LiNO3 electrolyte has an energy density of 32.63 W h kg−1 at a power density of 500 W kg−1 and an energy density of 8.06 W h kg−1 at a power density of 10![[thin space (1/6-em)]](https://www.rsc.org/images/entities/char_2009.gif) 000 W kg−1, which is higher than most of the LMO-based LICs in previous reports. It also has excellent cycle stability and after 2000 cycles, the specific capacitance retention rate was 75.9% at a current density of 3 A g−1. The LICs with environmentally friendly, safe and low-cost LiNO3 aqueous electrolyte have promising high-power application prospects.
000 W kg−1, which is higher than most of the LMO-based LICs in previous reports. It also has excellent cycle stability and after 2000 cycles, the specific capacitance retention rate was 75.9% at a current density of 3 A g−1. The LICs with environmentally friendly, safe and low-cost LiNO3 aqueous electrolyte have promising high-power application prospects.
Conflicts of interest
There are no conflicts to declare.Acknowledgements
This work was supported by the National Natural Science Foundation of China (grant Number 21206034), the Joint Guidance Project of Natural Science Foundation of Heilongjiang Province (grant Number LH2020E103), Outstanding Youth Science Foundation of Heilongjiang University (grant Number JCL201202) and Students Innovation and Entrepreneurship Training Project of China (YJSCX2020-072HLJU).Notes and references
- Y. Chen, A. Li, Z. H. Huang, L. N. Wang and F. Y. Kang, Nanomaterials, 2016, 6, 51 CrossRef PubMed.
- J. Y. Qin, C. Y. Hao, D. H. Wang, F. Wang, X. F. Yan, Y. Zhong, Z. M. Wang, C. H. Hua and X. T. Wang, J. Adv. Res., 2020, 21, 25–34 CrossRef CAS PubMed.
- J. S. Xu and L. Wang, Sci. Rep., 2019, 9, 12557 CrossRef PubMed.
- L. Wang, W. L. Guo, P. Y. Lu, T. Zhang, F. Hou and J. Liang, Front. Chem., 2019, 7, 832 CrossRef CAS PubMed.
- J. Li, J. Q. Guo, P. Y. Li, L. G. Wang and Y. J. Huang, Int. J. Electrochem. Sci., 2017, 12, 3212–3220 CrossRef CAS.
- Z. Q. Xu, M. Q. Wu, Z. Chen, C. Chen, J. Yang, T. T. Feng, E. Paek and D. Mitlin, Adv. Sci., 2019, 6, 1802272 CrossRef PubMed.
- K. Miyashita, T. Kondo, S. Sugai, T. Tei, M. Nishikawa, T. Tojo and M. Yuasa, Sci. Rep., 2019, 9, 17846 CrossRef PubMed.
- B. Zhu, X. Y. Wang, P. C. Yao, J. L. Li and J. Zhu, Chem. Sci., 2019, 10, 7132–7148 RSC.
- B. W. Zhang, T. Sheng, Y. D. Liu, Y. X. Wang, L. Zhang, W. H. Lai, L. Wang, J. P. Yang, Q. F. Gu, S. L. Chou, H. K. Liu and S. X. Dou, Nat. Commun., 2018, 9, 4082 CrossRef PubMed.
- Y. M. Liu, C. Merlet and B. Smit, ACS Cent. Sci., 2019, 5, 1813–1823 CrossRef CAS PubMed.
- R. Agrawal, E. Adelowo, A. R. Baboukani, M. F. Villegas, A. Henriques and C. L. Wang, Nanomaterials, 2017, 7, 198 CrossRef PubMed.
- L. Li, L. H. Chen, W. J. Qian, F. Xie and C. K. Dong, Nanomaterials, 2019, 9, 703 CrossRef CAS PubMed.
- L. Geng, F. F. Yan, C. H. Dong and C. H. An, Nanomaterials, 2019, 9, 777 CrossRef CAS PubMed.
- K. Zhu, H. Y. Zhang, K. Ye, W. B. Zhao, J. Yan, K. Cheng, G. L. Wang, B. F. Yang and D. X. Cao, ChemElectroChem, 2017, 4, 3018–3025 CrossRef CAS.
- M. S. Park, Y. G. Lim, J. W. Park, J. S. Kim, J. W. Lee, J. H. Kim, S. X. Dou and Y. J. Kim, J. Phys. Chem. C, 2013, 117, 11471–11478 CrossRef CAS.
- J. P. Brog, A. Crochet, J. Seydoux, M. J. D. Clift, B. Baichette, S. Maharajan, H. Barosova, P. Brodard, M. Spodaryk, A. Züttel, B. Rothen-Rutishauser, N. H. Kwon and K. M. Fromm, J. Nanobiotechnol., 2017, 15, 58 CrossRef PubMed.
- P. Baranowski, S. Starzonek, A. Drozd-Rzoska, S. J. Rzoska, M. Bockowski, P. Keblinski, T. K. Pietrzak and J. E. Garbarczyk, Sci. Rep., 2019, 9, 16607 CrossRef PubMed.
- Y. Hai, Z. W. Zhang, H. Liu, L. B. Liao, P. Fan, Y. Y. Wu, G. C. Lv and L. F. Mei, Front. Chem., 2019, 7, 437 CrossRef CAS PubMed.
- Y. S. Gao, X. L. Wang, W. S. Yu, G. X. Liu, X. T. Dong and J. X. Wang, RSC Adv., 2019, 9, 21009–21017 RSC.
- C. L. Li, L. C. Zhang, J. F. Yang, Z. M. Xie, T. Zhang, J. X. Wang, Q. F. Fang and X. P. Wang, RSC Adv., 2019, 9, 3436–3442 RSC.
- P. Xue, D. C. Gao, S. Y. Chen, S. Y. Zhao, B. F. Wang and L. Li, RSC Adv., 2014, 4, 52624–52628 RSC.
- K. Akada, T. Sudayama, D. Asakura, H. Kitaura, N. Nagamura, K. Horiba, M. Oshima, E. Hosono and Y. Harada, Sci. Rep., 2019, 9, 12452 CrossRef PubMed.
- J. Li, X. H. Liang, F. Liou and J. Park, Sci. Rep., 2018, 8, 1846 CrossRef PubMed.
- R. Lisovsky, B. Ostafiychuk, I. Budzulyak, V. Kotsyubynsky, A. Boychuk and B. Rachiy, Acta Phys. Pol., A, 2018, 133, 876–878 CrossRef.
- S. Kaewmala, W. Limphirat, V. Yordsri, H. Kim, S. Muhammad, W. S. Yoon, S. Srilomsak, P. Limthongkul and N. Meethong, Sci. Rep., 2019, 9, 427 CrossRef PubMed.
- T. Huang, X. Zheng, G. Fang, Y. Pan, W. Wang and M. Wu, RSC Adv., 2018, 8, 38831–38835 RSC.
- H. W. Lee, P. Muralidharan, R. Ruffo, C. M. Mari, Y. Cui and D. K. Kim, Nano Lett., 2010, 10, 3852–3856 CrossRef CAS PubMed.
- J. Jo, S. Nam, S. Han, V. Mathew, M. H. Alfaruqi, D. T. Pham, S. Kim, S. Park, S. Park and J. Kim, RSC Adv., 2019, 9, 24030–24038 RSC.
- X. D. Luo, Y. Z. Yin, M. Yuan, W. Zeng, G. Lin, B. Huang, Y. W. Li and S. H. Xiao, RSC Adv., 2018, 8, 877–884 RSC.
- Y. N. Xu, Q. L. Wei, C. Xu, Q. D. Li, Q. Y. An, P. F. Zhang, J. Z. Sheng, L. Zhou and L. Q. Mai, Adv. Energy Mater., 2016, 6, 1600389 CrossRef.
- H. Z. Chen, Y. D. Huang, G. Q. Mao, H. Tong, W. J. Yu, J. C. Zheng and Z. Y. Ding, Front. Chem., 2018, 6, 174 CrossRef PubMed.
- W. W. Jiang, H. B. Wang, Z. W. Xu, N. Li, C. Chen, C. Y. Li, J. Li, H. M. Lv, L. Y. Kuang and X. Tian, Chem. Eng. J., 2018, 335, 954–969 CrossRef CAS.
- Y. D. Gao, Y. Y. Zhang, Y. Zhang, L. J. Xie, X. M. Li, F. Y. Su, X. X. Wei, Z. W. Xu, C. M. Chen and R. Cai, J. Energy Chem., 2016, 25, 49–54 CrossRef.
- Y. C. Liu, X. F. Miao, J. H. Fang, X. X. Zhang, S. J. Chen, W. Li, W. D. Feng, Y. Q. Chen, W. Wang and Y. N. Zhang, ACS Appl. Mater. Interfaces, 2016, 8, 5251–5260 CrossRef CAS PubMed.
- Y. Hai, Z. W. Zhang, H. Liu, L. B. Liao, P. Fan, Y. Y. Wu, G. C. Lv and L. F. Mei, Front. Chem., 2019, 7, 437 CrossRef CAS PubMed.
- G. W. Lee, J. H. Ryu, W. Han, K. H. Ahn and S. M. Oh, J. Power Sources, 2010, 195, 6049–6054 CrossRef CAS.
- Y. Z. Fu, Y. S. Su and A. Manthiram, J. Electrochem. Soc., 2012, 159, A1420–A1424 CrossRef CAS.
- M. S. Zhao, B. Zhang, G. L. Huang, H. Y. Zhang and X. P. Song, J. Power Sources, 2013, 232, 181–186 CrossRef CAS.
- J. Yu, C. Mu, X. Y. Qin, C. Shen, B. Y. Yan, H. G. Xue and H. Pang, Adv. Mater. Interfaces, 2017, 4, 1700279 CrossRef.
- K. Kim, Y. Ando, A. Sugahara, S. Ko, Y. Yamada, M. Otani, M. Okubo and A. Yamada, Chem. Mater., 2019, 31, 5190–5196 CrossRef CAS.
- Q. Qu, L. J. Fu, X. Y. Zhan, D. Samuelis, J. Maier, L. Li, S. Tian, Z. H. Li and Y. P. Wu, Energy Environ. Sci., 2011, 4, 3985–3990 RSC.
- H. Kim, J. Hong, K. Y. Park, H. Kim, S. W. Kim and K. Kang, Chem. Rev., 2014, 114, 11788–11827 CrossRef CAS PubMed.
- K. Krishnamoorthy, P. Pazhamalai, S. Sahoo, J. H. Lim, K. H. Choi and S. J. Kim, ChemElectroChem, 2017, 4, 3302–3308 CrossRef CAS.
- A. Byeon, M. Boota, M. Beidaghi, K. V. Aken, J. W. Lee and Y. Gogotsi, Electrochem. Commun., 2015, 60, 199–203 CrossRef CAS.
- H. W. Xiao, Y. R. Wang, K. Xie, S. Q. Cheng and X. Z. Cheng, J. Alloys Compd., 2018, 738, 25–31 CrossRef CAS.
- J. Li, X. Zhang, R. F. Peng, Y. J. Huang, L. Guo and Y. C. Qi, RSC Adv., 2016, 6, 54866–54873 RSC.
- F. X. Wang, S. Y. Xiao, X. W. Gao, Y. S. Zhu, H. P. Zhang, Y. P. Wu and R. Holze, J. Power Sources, 2013, 242, 560–565 CrossRef CAS.
- F. X. Wang, S. Y. Xiao, Y. S. Zhu, Z. Chang, C. L. Hu, Y. P. Wu and R. Holze, J. Power Sources, 2014, 246, 19–23 CrossRef CAS.
- L. Chen, W. Zhai, L. Chen, D. P. Li, X. X. Ma, Q. Ai, X. Y. Xu, G. M. Hou, L. Zhang, J. K. Feng, P. C. Si and L. J. Ci, J. Power Sources, 2018, 392, 116–122 CrossRef CAS.
- Y. G. Wang and Y. Y. Xia, Electrochem. Commun., 2005, 7, 1138–1142 CrossRef CAS.
- Y. Y. Liu, D. Zhang, Y. Shang, Y. Liu and J. J. Zhang, J. Electrochem. Soc., 2015, 162, A2123–A2130 CrossRef CAS.
Footnote |
| † These authors contributed equally to this work. |
| This journal is © The Royal Society of Chemistry 2021 |

