 Open Access Article
New triorganotin(IV) compounds with aromatic carboxylate ligands: synthesis and evaluation of the pro-apoptotic mechanism†
Faisal Rashid‡
 a,
Noor Uddin‡
 b,
Saqib Ali*b,
Ali Haider*b,
Syed Ahmad Tirmizib,
Paula L. Diaconescu
 c and
Jamshed Iqbal
 *a
*a
aCentre for Advanced Drug Research COMSATS University Islamabad, Abbottabad Campus, Abbottabad-22060, Pakistan. E-mail: drjamshed@cuiatd.edu.pk; jamshediqb@gmail.com
bDepartment of Chemistry, Quaid-i-Azam University, 45320-Islamabad, Pakistan. E-mail: drsa54@hotmail.com; ahaider@qau.edu.pk
cDepartment of Chemistry and Biochemistry, University of California, Los Angeles607 Charles E. Young Drive East, Los Angeles, CA 90095, USA
First published on 21st January 2021
Abstract
Three new organotin(IV) carboxylate compounds were synthesized and structurally characterized by elemental analysis and FT-IR and multinuclear NMR (1H, 13C, 119Sn) spectroscopy. Single X-ray crystallography reveals that compound C2 has a monoclinic crystal system with space group P21/c having distorted bipyramidal geometry defined by C3SnO2. The synthesized compounds were screened for drug-DNA interactions via UV-Vis spectroscopy and cyclic voltammetry showing good activity with high binding constants. Theoretical investigations also support the reactivity of the compounds as depicted from natural bond orbital (NBO) analysis using Gaussian 09. Synthesized compounds were initially evaluated on two cancer (HeLa and MCF-7) cell lines and cytotoxicity to normal cells was evaluated using a non-cancerous (BHK-21) cell line. All the compounds were found to be active, with IC50 values less than that of the standard drug i.e. cisplatin. The cytotoxic effect of the most potent compound C2 was confirmed by LDH cytotoxicity assay and fluorescence imaging after PI staining. Apoptotic features in compound C2 treated cancer cells were visualized after DAPI staining while regulation of apoptosis was observed by reactive oxygen species generation, binding of C2 with DNA, a change in mitochondrial membrane potential and expression of activated caspase-9 and caspase-3 in cancer cells. Results are indicative of activation of the intrinsic pathway of apoptosis in C2 treated cancer cells.
Introduction
Apoptosis is a highly conserved process of cell death, which is strictly regulated and makes the cell undergo its own death.1,2 In multicellular organisms, it is an important mechanism that destroys unnecessary or superfluous cells during growth or neutralizes potentially harmful cells with DNA disruption, thus preventing carcinogenesis.3,4 Different extrinsic and intrinsic triggers such as DNA-damage, mitochondrial dysfunction, production of reactive oxygen species and activation of caspases can activate apoptosis.5Reactive oxygen species (ROS) are usually small, short-lived and highly reactive molecules.6 They may be free radicals derived from oxygen such as superoxide anion and radical hydroxyl or non-radical molecules like hydrogen peroxide (H2O2) which cause apoptosis.7,8 Lactate dehydrogenase (LDH) belongs to family of NAD+ dependent enzymes and is responsible for the interconversion of pyruvate and lactate under normal conditions.9 Extracellular release of cytosolic LDH indicates increased permeability of cell and is a marker of cell death.10 Mitochondria are energy producing organelles of the cell which have various other functions too like biogenesis of intermediates for various biochemical processes,11 contribution in biochemical synthesis of hormones,12 thermogenesis13 and induction of apoptosis through intrinsic pathway after release of mitochondrial cytochrome c.14,15 They also have transiently stored calcium to facilitate in maintaining cellular homeostasis.16 Mitochondria have their own DNA (mtDNA) which is maternally inherited.17 Triorganotin(IV) compounds are well known in targeting mitochondria by three mechanisms through ion (Cl−/OH−) exchange across membranes, hydrolysis of ATP and swelling of mitochondria.18 Mitochondria become abnormally swollen with disorganized cristae after treatment with an agent targeting mitochondria in cells. Mitochondrial dysfunction leads to reduction in mitochondrial membrane potential and increased permeability leads to release of cytochrome c and hence apoptosis.14,15,19
Caspases are a family of protease enzymes playing essential role in apoptosis and inflammation.20 They all work together and maintain homeostasis in body by regulating apoptosis.21 Caspase-9 is an important apoptosis marker and present on CASP9 gene. Caspase-9 is initiator in mitochondrial apoptotic pathway, which is activated when cytochrome c is released from mitochondria. Afterwards caspase-9 performs its initiation action by activating “effectors-caspases” such as caspase-3 and caspase-7 which eventually cause apoptosis.22 Caspase 3 is mainly known for initiating the apoptosis in the cells of multicellular organisms.23 Tin metal complexes have been shown to induce caspase dependent apoptosis in cancer cells.24
Metal complexes have largely been employed in medicinal chemistry as bioactive molecules which are effective carbonic anhydrase inhibitors,25 antimicrobial,26 and anticancer27 agents. Various metals can be used to achieve libraries of these metallodrugs with structural diversities. Cisplatin, a platinum-based lead molecule in chemotherapy, inaugurated the era of metal-based therapeutics. In recent times, other metal complexes containing Mn, Zn, Ni, Cd, Co, Cu, and Zn have successfully been investigated to obtain therapeutics.28–30 The organic motifs of these metallodrugs are also vital to define and among a large choice of ligands sulfonamide, imidazole, 2′,2-bipyridine and 1′,10-phenanthroline are typically used to shelter the complexation of metals. In 1929, the antitumor activity of organolead and organotin(IV) complexes was checked in mouse which produced results with slight contradiction.31 Later in 1972, it was confirmed that triphenytin acetate retard the growth of tumor cells in mice, not the chlorides.31 Subsequently, enormous number of organotin compounds were synthesized and tested in vitro and in vivo for various cancerous cells, like murine leukemia (P388 and L1210).32 In the last two decades a series of organotin(IV) carboxylates have been synthesized with phenyl, butyl, methyl derivatives and were screened for biological studies especially antitumor studies.33
In the present study, triorganotin(IV) complexes with aromatic carboxylate ligand were designed and synthesized. Further, their anticancer potential was explored against cancer cell lines (HeLa and MCF-7), while safety profile was investigated by testing the same compounds for normal cells (BHK-21). The pro-apoptotic mechanism of the active compound was explored through fluorescence microscopy, analysis of cell cycle, activation of caspase-9 and -3, production of reactive oxygen species, release of lactate dehydrogenase, DNA binding studies and by measuring mitochondrial membrane potential in C2 treated cancer cells.
Results and discussion
Synthesis and structural characterization
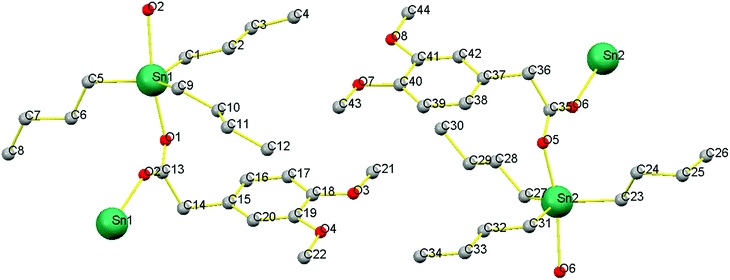
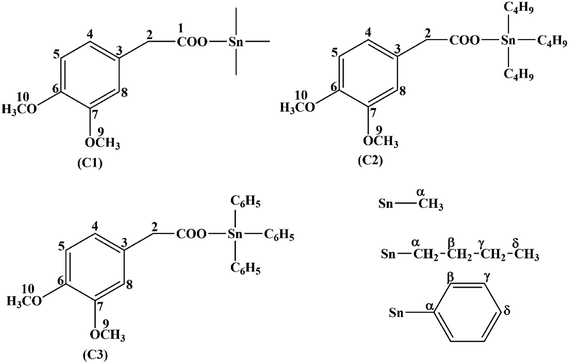
The synthesized carboxylate compounds (C1–C3) were characterized through CHN analysis, FT-IR, multinuclear (1H, 13C, 119Sn) NMR and single X-ray crystallographic techniques. The melting point indicated the purity of the compounds. The structures of the compounds (C1–C3) along with numbering scheme are shown in Fig. 2. FT-IR spectra of the synthesized compounds were recorded in the range of 4000 to 400 cm−1. In the IR spectra of compounds C1–C3, the disappearance of OH group in the range of 3400 to 3300 cm−1 confirm the formation of complexes. The sharp band detected at 1727 cm−1 (C1), 1740 cm−1 (C2) and 1736 cm−1 (C3) is assigned to carbonyl group (C![[double bond, length as m-dash]](https://www.rsc.org/images/entities/char_e001.gif) O). For the binding mode of (COO) to metal was calculated from the difference of asymmetric and symmetric stretching frequencies of carboxylate moiety. The magnitude of Δν falls in the range 230–250 cm−1 showing monodentate nature of the binding.34,35 The absorption bands in the range 424–450 cm−1 for compounds 1–3 attribute to stretching frequency of (Sn–O) linkage further confirmed the formation of the compounds.
O). For the binding mode of (COO) to metal was calculated from the difference of asymmetric and symmetric stretching frequencies of carboxylate moiety. The magnitude of Δν falls in the range 230–250 cm−1 showing monodentate nature of the binding.34,35 The absorption bands in the range 424–450 cm−1 for compounds 1–3 attribute to stretching frequency of (Sn–O) linkage further confirmed the formation of the compounds.
The NMR (1H, 13C) were recorded on Bruker-300 MHz in deuterated DMSO showing all the information for alkyl/aryl groups attach to Sn, its multiplicity and resonance intensities. The integrated values obtained from the spectra agree with proposed structures. In proton (1H) spectra, the absence of acidic proton signals indicates the deprotonation and proposes the binding of oxygen atom to the Sn(IV) center. nJ(Sn–H) couplings observed in 1H NMR and the angle (θ) values (108°–114°) i.e. for C–Sn–C were used in Lockhart equation to deduce the geometry around Sn(IV) center. The 13C NMR spectra further supported the 1H NMR data and presented the methyl, butyl and phenyl signals in C1–C3 attached to Sn(IV) atom respectively, in the expected chemical shift region. In case of butyl derivative, up field shifting of the alkyl groups (αC) attached to Sn(IV) center compared to that of free ligand is observed due to transfer of electron density from ligand to Sn(IV) atom. The Sn(IV) carbon coupling constants nJ(119Sn–13C) is one of the significant parameters for the determination of structures of organotin(IV) compounds and by applying these constants in Lockhart's equation, we get the geometry around Sn(IV) atom in solution.36,37 The compound C1 exhibited nJ(119/117Sn–13C) of 446 and 435 Hz respectively, owing the tetrahedral geometry around Sn(IV) center in solution. Similarly, compound C2 and C3, the nJ(119/117Sn–13C) values are 336, 321 Hz and 615, 588 Hz indicating the four-coordination geometry in solution. The 119/117Sn chemical shifts for the synthesized compounds (C1–C3) are comparable for the coordinated geometry around tin atom and in consonance with that of literature values. Multi NMR spectra are given in ESI (see Fig. S1–S3†).
Chemistry of the crystals
The crystal data and refinement parameters of C1 is shown in Table S1,† while selected bond lengths and bond angles are mentioned in Table 1. C1 has monoclinic crystal system having space group P21/c and adopted distorted trigonal-bipyramidal geometry defined by C3SnO2, where, C3 are the carbon atoms of tributyl groups of organotin moiety and O2 are the oxygen atoms of carboxylate ligand. It is worth mentioning that complex 1 exists as two independent molecules 1a (having Sn1 atoms) and 1b (having Sn2 atoms) in one unit cell (Fig. 1). However, in the trigonal-bipyramidal geometry, distortion around metal center is quantified by τ value viz 0.777 (1a) and 0.743 (1b) [τ = (β − α)/60 and β > α, are the largest angles around coordination center and τ = 1.0, for an ideal trigonal-bipyramidal and τ = 0.0 for an ideal square pyramidal geometry] which shows greater degree of distortion in 1b than that of 1a.38,39 This can be due to greater asymmetric binding of carboxylate ligand in 1b compared to 1a [Δ(Sn–O) = (Sn–Olarge − Sn–Oshort) 0.247 Å for 1a and 0.275 Å for 1b].| Type of bond | Sn1 | Type of angle | Sn1 | Type of bond | Sn2 | Type of angle | Sn2 |
|---|---|---|---|---|---|---|---|
| Sn1–O1 | 2.173(3) | O1–Sn1–O2 | 169.62(10) | Sn2–O5 | 2.168(3) | O5–Sn2–O6 | 167.92(10) |
| Sn1–O2 | 2.420(3) | C1–Sn1–C5 | 116.86(16) | Sn2–O6 | 2.443(3) | C23–Sn2–C27 | 123.34(18) |
| Sn1–C1 | 2.130(4) | C1–Sn1–C9 | 123.35(16) | Sn2–C23 | 2.150(4) | C23–Sn2–C31 | 113.74(17) |
| Sn1–C5 | 2.148(4) | C5–Sn1–C9 | 118.49(17) | Sn2–C27 | 2.139(5) | C27–Sn2–C31 | 120.55(18) |
| Sn1–C9 | 2.138(4) | O1–Sn1–C1 | 87.54(13) | Sn2–C31 | 2.122(4) | O5–Sn2–C23 | 99.81(15) |
| O1–C13 | 1.280(5) | O1–Sn1–C5 | 98.47(13) | O5–C35 | 1.276(5) | O5–Sn2–C27 | 97.22(15) |
| O2–C13 | 1.241(5) | O1–Sn1–C9 | 95.51(14) | O6–C35 | 1.245(5) | O5–Sn2–C31 | 87.87(15) |
| C13–C14 | 1.529(5) | O2–Sn1–C1 | 82.92(13) | C35–C36 | 1.526(6) | O6–Sn2–C23 | 90.44(14) |
| O2–Sn1–C5 | 89.51(13) | O6–Sn2–C27 | 82.22(15) | ||||
| O2–Sn1–C9 | 86.40(13) | O6–Sn2–C31 | 82.13(14) | ||||
| O1–C13–O2 | 124.5(4) | O5–C35–O6 | 123.5(4) |
Moreover, the equatorial sites are engaged by butyl groups of organotin moiety having Sn–C [{Sn1–C1 = 2.130(4) Å, Sn1–C5 = 2.148(4) Å, Sn1–C9 = 2.138(4) Å for 1a} and {Sn2–C23 = 2.150(4) Å, Sn2–C27 = 2.139(5) Å, Sn2–C31 = 2.122(4) Å for 1b}] bond lengths marginally unalike. The C–Sn–C angles are in the range of 116.86–123.35° for 1a and 113.74–123.34° for 1b and are close to the ideal value of 120° for trigonal plane. However, the axial positions are occupied by carboxylate ligand bridging to two Sn-centers with unequal Sn–O bond lengths [{Sn1–O1 = 2.173(3), Sn1–O2 = 2.420(3) for 1a} and {Sn2–O5 = 2.168(3) and Sn2–O6 = 2.443(3) for 1b}]. The effect of disparity in carboxylate binding toward metal centre (0.247 Å for 1a and 0.275 Å for 1b) is also revealed in C–O bond as smaller C–O bonding [1.241(5) for 1a and 1.245(5) for 1b] correspond to larger Sn–O bond [2.420(3) for 1a and 2.443(3) for 1b] and vice versa [C–O = {1.280(5) Å }(1a), {1.276(5) Å }(1b) and Sn–O = {2.173(3) Å }(1a), {2.168(3) Å} (1b)]. This feature may be due to shifting of electronic charge density from C–O bond toward metal center. However, it has been observed that the butyl groups of organotin moiety are slanting toward greater Sn–O bond as represented by O–Sn–C angles [{O2–Sn1–C1 = 82.92(13), O2–Sn1–C5 = 89.51(13), O2–Sn1–C9 = 86.40(13)}(1a) and {O6–Sn2–C23 = 90.44(14), O6–Sn2–C27 = 82.22(15), O6–Sn2–C31 = 82.13(14)}(1b)]. This can be due to bond pair-bond pair electronic repulsion in penta-coordinated structures. However, greater leaning of butyl groups in 1b toward larger Sn–O bond length than 1a may be due to closer approach of oxygen atom from oppositely present Sn–O bond [Sn1–O1 = 2.173(3) in 1a and Sn2–O5 = 2.168(3) in 1b].
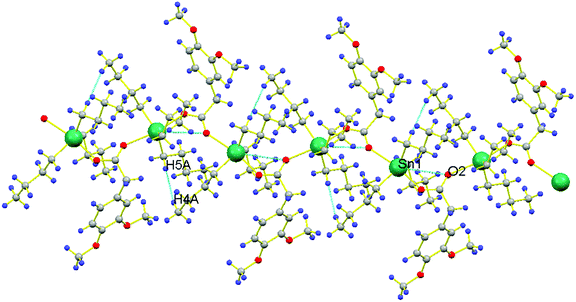
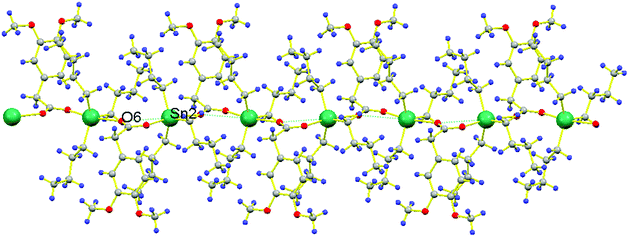
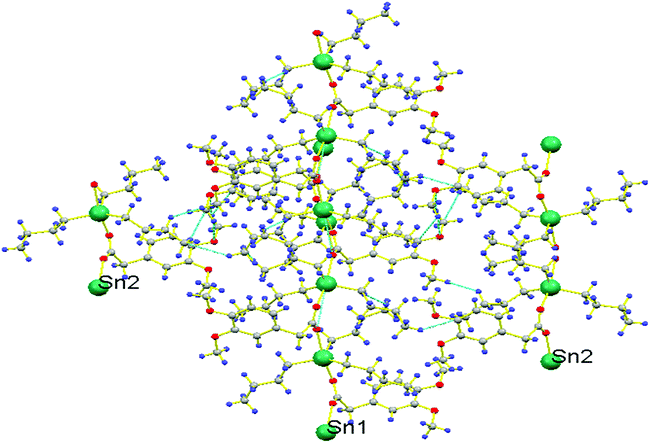
Another significant feature of 1a and 1b is their superamolecular packing supported by various secondary bond forces. In both independent co-existing molecules, the carboxylate moiety is also acting as bridging ligand between two Sn(IV) centers and generating zig-zag pattern of a polymeric 1D chain. While substituted phenyl groups of adjacent carboxylate ligands are located at alternative positions of 1D chain and are perpendicular to each other. However, in 1a, each polymeric chain is sustained by various intramolecular O⋯O{O1⋯O2 = 2.230 Å}, H⋯Sn{H9(A,B)⋯Sn1 = 2.623 Å, H10A⋯Sn1 = 3.090 Å, H6A⋯Sn1 = 3.205 Å, H6B⋯Sn1 = 3.277 Å, H1(A,B)⋯Sn1 = 2.624 Å, H2A⋯Sn1 = 3.213 Å, H2B⋯Sn1 = 3.106 Å, H5A⋯Sn1 = 2.633 Å, H5B⋯Sn1 = 2.632 Å} and C⋯Sn{C10⋯Sn1 = 3.121 Å, C6⋯Sn1 = 3.131 Å, C2⋯Sn1 = 3.067 Å} interactions. Additionally, 1D polymeric chains of 1a are also sustained by H⋯H {H5A⋯H4A = 2.311 Å} interactions (Fig. 2). While, in 1b, interamolecular interactions comprised of various O⋯O{O5⋯O6 = 2.220 Å}, H⋯Sn{H23A⋯Sn2 = 2.643 Å, H23B⋯Sn2 = 2.642 Å, H24A⋯Sn2 = 3.122 Å, H24B⋯Sn2 = 3.247 Å, H27A⋯Sn2 = 2.618 Å, H27B⋯Sn2 = 2.620 Å, H28A⋯Sn2 = 3.184 Å, H28B⋯Sn2 = 3.320 Å, H31A⋯Sn2 = 2.616 Å, H31B⋯Sn2 = 2.615 Å, H32A⋯Sn2 = 3.227 Å, H32B⋯Sn2 = 3.123 Å},C⋯Sn{C24⋯Sn2 = 3.092 Å, C28⋯Sn2 = 3.141 Å, C32⋯Sn2 = 3.073 Å}. The existence of C⋯Sn and H⋯Sn non-covalent interactions both in 1a and 1b can be the consequence of axially bonded oxygen atoms which boosts Lewis acidity of Sn centre. However, the presence of π⋯Sn interactions [{C13⋯Sn1 = 3.096 Å, 3.468 Å in 1a} and {C35⋯Sn2 = 3.079 Å in 1b}] can be the consequence of π-electrons on carbon atom of C–O bond. While the participation of oxygen atom from C–O bond in various non-covalent interactions [O⋯Sn{O2⋯Sn1 = 3.342 Å}, O⋯C{O2⋯C1 = 3.020 Å, O2⋯C9 = 3.127, 3.212 Å, O2⋯C14 = 2.420 Å} and O⋯H{O2⋯H14A = 2.506 Å in 1a} and O⋯Sn{O6⋯Sn2 = 3.303 Å} (Fig. 3), O⋯C{O6⋯C31 = 3.009 Å, O6⋯C27 = 3.022 Å, O6⋯C36 = 2.419 Å} and O⋯H{O6⋯H31A = 2.715 Å, O6⋯H27B = 2.716 Å, O6⋯H36B = 2.496 Å, O6⋯H28B = 2.564 Å in 1b}] can be attributed by greater electronic density due to multiple bond character in C–O bond [O2–C13 = 1.241(5) in 1a and O6–C35 = 1.245(5) in 1b] and its weaker association with Sn metal [Sn1–O2 = 2.420(3) 1a and Sn2–O6 = 2.443(3) in 1b] as compared to second Sn–O bond [Sn1–O1 = 2.173(3) in 1a and Sn2–O5 = 2.168(3) in 1b]. Moreover, polymeric chains of 1a are also connected with 1b by non-covalent interactions like C⋯H{C30⋯H8B = 2.889 Å, C21⋯H30A = 2.867 Å}, π⋯H{C18⋯H43A = 2.855 Å}, H⋯H{H22B⋯H29B = 2.378 Å} and O⋯H{O7⋯H21C = 2.668 Å, O3⋯H43A = 2.582 Å} to further cement the supramolecular architecture (Fig. 4).
Natural bond orbital (NBO) analysis
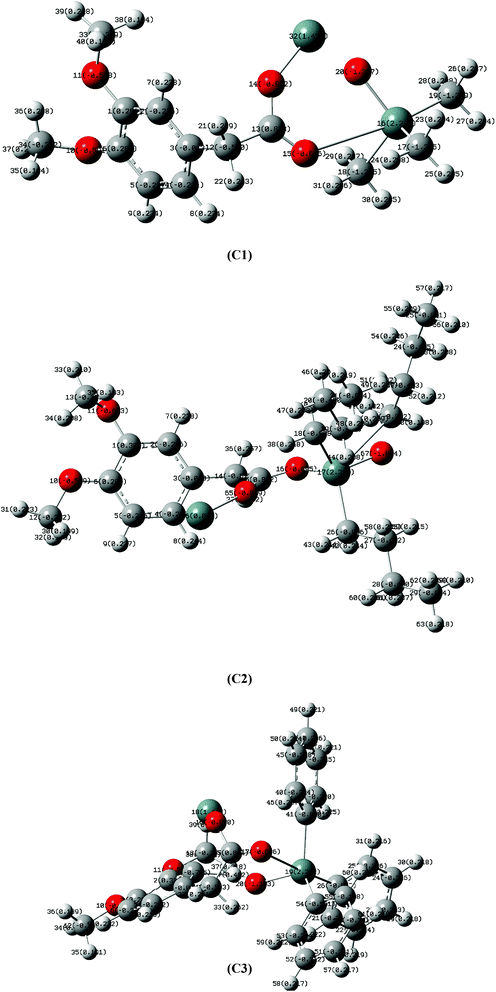
In order to evaluate the reactivity and Lewis acid character of Sn center, natural bond orbital (NBO) analysis were perform through density functional theory (DFT) showing electronic charge density on each atom as shown in Fig. 5. There is a positive charge on Sn(IV) atom (C1, C2 and C3) and negative charge on oxygen atoms attached to Sn(IV) atom attributed to the shifting of electron density from metal to ligand. In compound C2, Sn(IV) has greater positive charge than in C1 which means less amount of electronic density has been shifted to the coordinated oxygen. As a result, weaker Sn–O bond compared to C1 i.e. due to butyl bulky nature in C2 and phenyl in C3. Moreover, in compound C2 fewer negative charges on directly attached carbon atoms (C19, C32, C45) of butyl groups than those of methyl groups (C19, C23, C27) in compound C1 demonstrates greater electron donating power of former than the later ones as shown in Table 2. The reactivity of organotin(IV) compounds is due to their Lewis acid character and is also explained by NBO analysis, where R3 groups attached to Sn atom are electron donating. The maximum electron donating and lipophilic character can be seen in case of butyl group which is more electron donating than methyl and phenyl group. Therefore, butyl substitution yields more stable and active derivatives than phenyl substitution while ethyl substitution demonstrates more activity than methyl substitution. This may be attributed to nature of bonding between Sn and alkyl groups. Furthermore, the mode of interaction is electrostatic in which the compound interacts with the phosphate group of DNA strand, also known as side wise interaction. This type of interaction is more supported by C2 with butyl substitution. This is further supported by the experimental results.| Atom | NBO charges | Atom | NBO charges | Atom | NBO charges |
|---|---|---|---|---|---|
| C1 | C2 | C3 | |||
| Sn16 | 2.239 | Sn17 | 2.383 | Sn19 | 2.272 |
| O14 | −0.972 | O16 | −0.895 | O16 | −0.970 |
| O15 | −0.655 | O65 | −0.819 | O17 | −0.606 |
| C13 | 0.873 | C15 | 0.872 | C15 | 0.841 |
| C17 | −1.225 | C18 | −0.988 | C26 | −0.567 |
| C18 | −1.225 | C22 | −0.022 | C41 | −0.600 |
| C19 | −1.229 | C26 | −0.986 | C54 | −0.561 |
Electrochemical studies
The synthesized compounds (C1–C3) were screened for redox activity using GC (glassy carbon) as working electrode, platinum (Pt) wire as counter electrode and saturated Ag/AgCl as reference electrode in 90% DMSO solvent. The voltammogram for all the compounds shows the oxidation peak, which is around 1.35 V due to oxidation of hydroxyl group present on aromatic ring in these compounds, represented in Fig. 6. All the compounds show irreversible oxidation peak attributed to the stability of compounds in solution. The compounds were screened against drug-ssDNA (ss-salmon sperm) interaction as shown in Fig. 7. Upon addition of varying concentration of DNA, decrease in peak current was observed for compounds (C1–C3). Due to the presence of DNA, certain changes occurred in the electrochemical response and respective current–potential parameters indicating the compound-DNA presence in the system. These changes, along with a shift toward more positive potential, denote the electrostatic mode of interaction between the compounds and DNA.40,41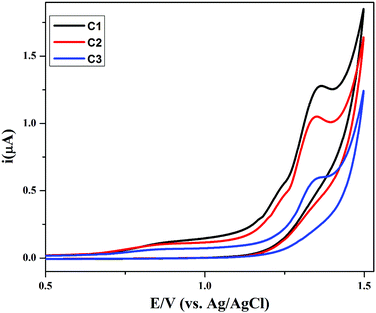 | ||
| Fig. 6 Cyclic voltammograms of compounds C1–C3 (1 mM each) recorded at GCE in an argon saturated DMSO + 0.1 M TBAP solution using a 50 mV s−1 scan rate at 25 °C. | ||
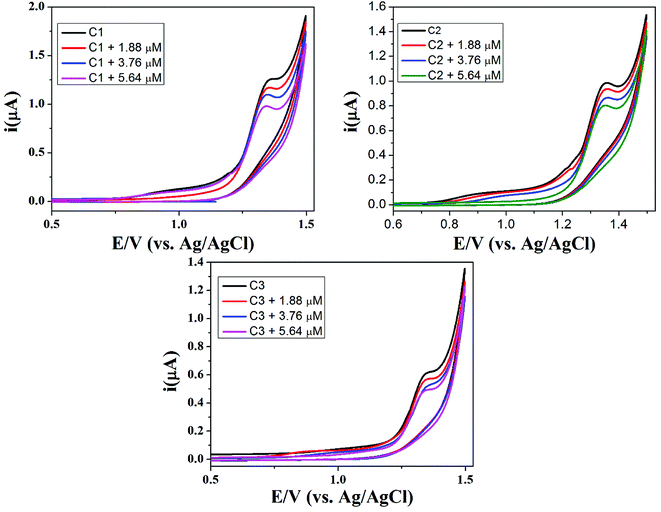 | ||
| Fig. 7 Cyclic voltammograms of 1 mM DMSO solutions of C1, C2 and C3 without DNA, in the presence of 1.86 μM DNA, 3.76 μM DNA and 5.64 μM DNA on glassy carbon electrode at a scan rate of 50 mV s−1. | ||
Furthermore, for confirmation of DNA interaction with compounds, cyclic voltammogram was recorded at different scan rates, to find the diffusion coefficient (Do) whose significance is the formation of large of ions in solution. Anodic peak current vs. square root of scan rate (v1/2) plot was drawn for all the compounds before and after the addition of ss-DNA. The decrease in peak current along with slight shift of positive potential indicate the electrostatic mode of interaction which can be seen in Fig. 7. The decrease in slope after the addition of ss-DNA indicates the drug-DNA adduct formation with slower rate in diffusion process and can be seen in diffusion coefficient Table 3.
| Compound | Do (cm2 s−1) (without DNA) | Do (cm2 s−1) (with DNA) | K (M−1) | s (bp) |
|---|---|---|---|---|
| C1 | 2.86 × 10⁻⁵ | 2.08 × 10⁻⁵ | 2.84 × 10⁴ | 4.50 |
| C2 | 1.50 × 10⁻⁵ | 1.18 × 10⁻⁵ | 2.02 × 10⁴ | 4.00 |
| C3 | 9.22 × 10⁻⁵ | 7.11 × 10⁻⁵ | 1.35 × 10⁴ | 3.5 |
In support of above argument, binding constant (K) also known as stability constant was calculated by using the following equation.42
| 1/[DNA] = K(1 − A)/(1 − I/Io) − K |
| Cb/Cf = K[DNA]/2s |
Differential pulse voltammetry
In view of measuring electron transfer, differential pulse voltammetry was performed for all the compounds having peak currents in the order of C1 > C2 > C3 as shown in Fig. 8. The electron transfer (ET) process in all the compounds, is in close agreement with its simple and planar structures. However, there is lethargic ET process in case C3 due to bulky nature of compound that cased hindrance to the ET process. From the full width at half maximum (FWHM), the experimental W1/2 values (≈155 mV) of all the compounds propose the one electron transfer process. These values are slightly larger than the theoretical values i.e. 90 mV for one electron process, which may be due to n uncompensated resistance.45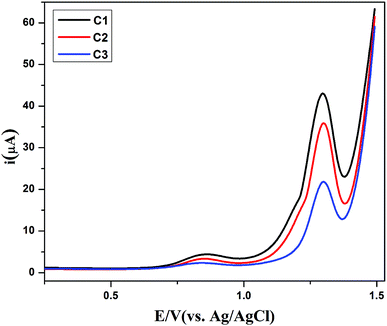 | ||
Fig. 8 Differential pulse voltammograms of the compounds C1 ( ), C2 ( ), C2 ( ) and C3 ( ) and C3 ( ) in 1 mM (15 mL DMSO) solutions, each recorded in their argon saturated 0.1 M TBAP at 25 °C. ) in 1 mM (15 mL DMSO) solutions, each recorded in their argon saturated 0.1 M TBAP at 25 °C. | ||
DNA binding studies
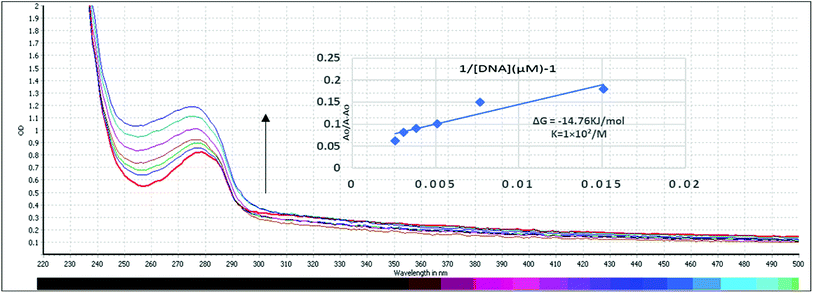
Ability of compound C2 to interact with HS-DNA was studied in absence and presence of increasing concentrations of DNA. By increasing DNA concentration, it is quite clear that a hyperchromicity with blue shift from 279 nm to 275 nm was observed showing a non-covalent interaction with Gibbs free energy of ΔG = −14.76 kJ mol−1 as shown in Fig. 9. The mode of interaction is electrostatic in which the compound interacts with the phosphate group of DNA strand, also known as side wise interaction. As, butyl substitution yields more stable and active derivatives than phenyl substitution while ethyl substitution demonstrates more activity than methyl substitution. This may be attributed to nature of bonding between Sn and alkyl groups, where butyl further supports the side wise interactions as can be seen by experimental results. The graph Ao/A − Ao vs. 1/[DNA] was plotted to find the binding constant and Gibb's free energy that indicate the spontaneity of the reaction. More negative the value is, the more spontaneity of the reaction will be and vice versa.Cell viability (MTT) assay
Apoptosis also known as programmed cell death, is activated when intracellular signals are received by cell regarding any unusual condition like DNA damage, protein damage, deprivation of growth factor and cytokine.46,47 Keeping in mind the anticancer activity of Schiff base derivatives, previously reported by our group, cell viability studies were carried out with newly synthesized complexes. MTT is well established in vitro assay for determination of cytotoxicity of compounds using cell lines where viable cells are estimated on basis of conversion of water-soluble dye into water insoluble formazan crystals due to metabolic activity of reductases in living cells. Formed formazan crystals are dissolved by solubilizing solution and optical density is measured. Greater the color intensity greater will be the viability of cells and vice versa.48–50 This assay is usually utilized for initial screening and determination of IC50 values of active compounds. MTT assay was performed on human cervical cancer cells (HeLa), human breast cancer cells (MCF-7) and non-cancerous baby hamster kidney (BHK-21) cells. The standard anticancer drug (cisplatin) was used as the positive control and the results are shown in Table 4. Excellent growth inhibition of cells was obtained for C2 complex carrying n-butyl ligand as linker with an IC50 values having lower micro-molar range for both MCF-7 (0.19 ± 0.05 μM) and HeLa cell lines (3.25 ± 0.19 μM) and the values were effective more than the positive control, cisplatin. Rest two complexes having methyl (C1) and phenyl (C3) linkers also caused significant cell growth inhibition against HeLa cell lines but for MCF-7 cell line, C1 exhibited very poor inhibition. For this reason, compound C2 was selected for further studies.| Codes | HeLa | MCF-7 | BHK-21 |
|---|---|---|---|
| IC50 values ± SEM (μM)/% inhibition | |||
| C1 | 9.23 ± 0.22 | 3.01% | 3.02 ± 0.14 |
| C2 | 3.25 ± 0.19 | 0.19 ± 0.05 | 0.92 ± 0.07 |
| C3 | 5.908 ± 0.58 | 0.42 ± 0.01 | 1.47 ± 0.08 |
| Cisplatin | 11.3 ± 0.78 | 6.2 ± 0.72 | 24.69 ± 0.37 |
Three Sn(IV) complexes (C1–C3) were examined for their anticancer activity. All the compounds showed good cytotoxic activity for MCF-7 and HeLa cells with IC50 values reported in Table 4. For the examination of safety profile of the tested compounds, cytotoxicity was also evaluated against BHK-21 cells and IC50 values were provided in Table 4. Cytotoxic activity was found higher in cancer cells as compared to normal cells.
Anti-proliferative potential of triorganotin(IV) carboxylates depicted that in both cancer cell lines methyl substitution yielded least potent compound (C1), while butyl substitution yielded most potent compound (C2). Phenyl substitution yielded less potent compound (C3) than (C2). The type and number of alkyl substitutions plays vital role in biological activities of organotin(IV) metal complexes. Butyl substitution yields more stable and active derivatives than phenyl substitution while ethyl substitution demonstrates more activity than methyl substitution. This may be attributed to nature of bonding between Sn and alkyl groups. Alkylation in such compounds is obliging to induce alkyl radicals which produce synergistic apoptotic effect along with ROS in cancer cells. These findings are in relevance to order of reactivity for organotin compounds as mentioned in the literature.51
Estimation of release of lactate dehydrogenase (LDH)
Cytotoxic potential of compound was observed through detection of leaked lactate dehydrogenase in culture media of HeLa and MCF-7 cells. LDH is leaked into extracellular fluid when integrity of cell membrane is lost. As shown in Fig. 10, compound C2 has shown about 50% and nearly 80% cytotoxicity in both HeLa and MCF-7 cells at IC50 and 2 × IC50 values respectively. C2 showed excellent cytotoxicity for cancer cells which has confirmed MTT results.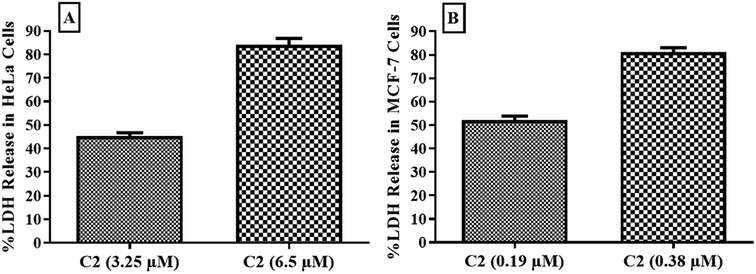 | ||
| Fig. 10 Cytotoxic effect of compound C2 observed in (A) HeLa and (B) MCF-7 cells by estimation of released LDH. Error bars represent standard deviation of three replicates. | ||
Analysis of cell cycle by flow cytometry
Selected compound C2 was further studied and evaluated for its ability to interfere in cell cycle regulation in cancer cells. As shown in Fig. 11, compound has shown different DNA content at different stages of cell cycle progression as compared to untreated cells. Compound caused an arrest in G2/M phase that's why lower DNA content in G0/G1 phase has been found, showing that compound C2 have caused cell cycle arrest at G2/M phase which is in compliance with a previous study.52Microscopic analysis of apoptosis
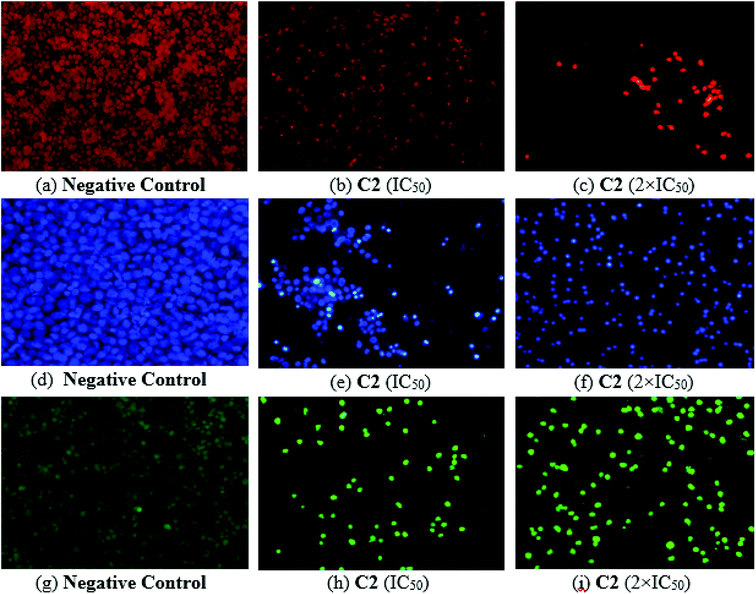
Organotin and Schiff base complexes are important in cancer therapy due to their apoptosis inducing characteristics.46 Propidium iodide PI is a fluorescent molecule that attach with the DNA. PI binds with DNA in the dead cells because the plasma membrane of dead cells becomes permeable for foreign molecules.53 Similarly, DAPI staining is used to check out apoptosis in cells.54,55 PI and DAPI staining were performed and images were captured (Fig. 12) which were compared and analyzed. DNA fragmentation, nuclear condensation and cell shrinkage were detected while untreated cells showed no change in morphology. Cytotoxic potential of compound C2 was confirmed by morphological observations using propidium iodide (PI) and 4′,6-diamidino-2-phenylindole (DAPI) as staining dyes.Investigation of intracellular reactive oxygen species production
Organotin compounds usually possess the ability to produce reactive oxygen species in cancer cells.46 Exogenous and endogenous stimuli can generate ROS in cells. Endogenous ROS development, particularly superoxide anion, are generated mainly during the activity of the mitochondrial electron transport chain.56 When antioxidant detoxification processes do not maintain low accepted ROS rates, excess cellular ROS levels may be deleterious and trigger oxidative stress.6 Large amount of cellular ROS levels can damage proteins, nucleic acids, lipids, membranes, and organelles such as mitochondria and directly associated with both carcinogenic and anticarcinogenic mechanisms.57,58 The ability of compound C2 to induce reactive oxygen species was observed in HeLa cells using 2′,7′-dichlorofluorescin diacetate (H2DCF-DA) which produced a fluorescent probe dichlorofluorescein (DCF) when came in contact to reactive oxygen species. Fluorescence produced was detected by green filter of fluorescence microscope at wavelength of 530 nm after exciting at 488 nm. Compound C2 has ability to produce ROS in cancer cells to show its anticancer property as shown in Fig. 12 and hence ability to induce oxidative stress related apoptosis.Apoptosis assessment by caspase-9 and -3 activity
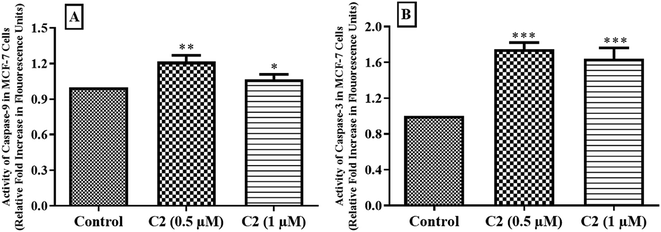
Cysteine proteases are enzymes present in the cell and have numerous functions. These caspases are mainly involved in apoptosis. After receiving apoptotic signals, some precursors of caspases are generated to activate initiator caspases which in turn activate executioner caspases.59 This process increases intracellular Ca2+ ion concentration and successively regulate the activation of DNA binding transcription factor, and as a result ROS production. Afterwards, the release of cyt-c from mitochondrial membrane causes activation of initiator (caspase-8 & 9) and executioner (caspase-3 & 7) and hence induces apoptosis.60 Production of caspases after treatment with compound C2 in MCF-7 cells was measured. Compound C2 was tested at its IC50 and 2 × IC50 values. It was observed that about 1.2 fold and about 1.08 fold increase in caspase-9 generation, while a 1.7 fold and about 1.6 fold increase in generation of caspase-3 at its IC50 and 2 × IC50 values, respectively in MCF-7 cells (Fig. 13) which indicated that compound has role in inducing apoptosis.Measurement of mitochondrial membrane potential (ΔΨm)
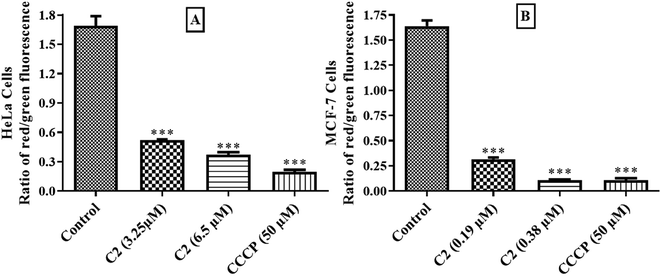
Mitochondria are cell power house which mainly produce energy for cells. Some of the antiproliferative agents are able to directly target mitochondria and cause a decrease in mitochondrial membrane potential which leads to mitochondrial dysfunction and consequently apoptosis through intrinsic pathway.19 In cancer cells, mutations in mitochondrial genes cause alterations in bioenergetics and biosynthesis that's why cancer cells adopt glycolysis to meet their needs and high lactate production is seen in these cells.19,61 Cancer cells need higher energy which is produced by mitochondria. Dysfunctioning of mitochondria in cancer cells is gaining popularity and molecules targeting mitochondria are now being discovered.62 In this experiment, cells treated with 1% DMSO were used as negative control and cell treated with carbonyl cyanide m-chlorophenylhydrazone (CCCP) at its 50 μM final concentration as positive control. As in Fig. 14, compound (C2) has shown a dose dependent decrease in red/green ratio in both HeLa and MCF-7 cells indicating that C2 also targets mitochondria to achieve apoptosis in cancer cells which resembles to a previous study.63Experimental
Materials and methods
Reagents i.e. 3,4-dimethoxybenzoic acid, sodium bicarbonate, trimethyltin(IV) chloride, tributyltin(IV) chloride and triphenyltin(IV) chloride were procured from Aldrich (USA) and were used without additional purification. All the solvents used were purchased from E. Merck (Germany) and dried according to the standard procedure given in literature.64 The characterization techniques used for the synthesized compounds are CHN analysis, FT-IR, NMR (1H, 13C and 119Sn) and single crystal X-ray diffraction. Melting points of the synthesized compounds were determined using Gallenkamp (UK) electrothermal melting point apparatus. Bruker Tensor II was used to record the FT-IR spectra, 1H, 13C NMR spectra were recorded on Bruker-300 MHz FT-NMR and for 119Sn NMR, Bruker DRX-500 MHz Spectrometer was used. DMSO-d6, CDCl3 and acetontirle-d3 were used as solvents for NMR measurements.65 The resonant frequency of the nucleus compared to magnetic field denoted as chemical shift is shown in ppm while the J (coupling constants) values are given in Hertz. The spin multiplicities of signals for 1H NMR are given as (s = singlet, d = doublet, t = triplet, m = multiplet). Crystal analysis was conducted using Bruker Smart Apex II single X-ray diffractometer (MoKα source).Synthesis of sodium salt of the ligand and organotin(IV) complexes
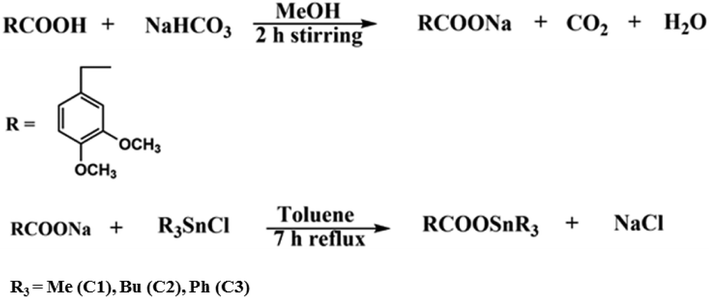
For the synthesis of the sodium salt of the ligand, equimolar aqueous solution of sodium hydrogen carbonate (NaHCO3) was added dropwise to the methanolic suspension of HL and stirred for two hours at room temperature to get a clear solution. The solution was then rotary evaporated under reduced pressure. The white product obtained was vacuum dried. For the synthesis of organotin(IV) carboxylate complexes, equimolar suspended solution of sodium salt of ligand was taken in two neck round bottom flask and solution of triorganotin(IV) chloride (R3SnCl) was added drop wise, then refluxed for 7 h in dry toluene. The solution was cooled at room temperature, filtered and rotavap at low pressure to get the desired product. The product was then recrystallized in hexane: chloroform (3![[thin space (1/6-em)]](https://www.rsc.org/images/entities/char_2009.gif) :
:![[thin space (1/6-em)]](https://www.rsc.org/images/entities/char_2009.gif) 1). Fig. 15 shows the schematic method of the desired syntheses of the sodium salts of the ligand and organotin(IV) complexes while Fig. 16 shows the numbering scheme of the compounds.
1). Fig. 15 shows the schematic method of the desired syntheses of the sodium salts of the ligand and organotin(IV) complexes while Fig. 16 shows the numbering scheme of the compounds.
Synthesis of trimethylstannyl 2-(3,4-dimethoxyphenyl)acetate (C1)
Yield: 88%; mp: 180–182 °C; mol. wt: 346.02; anal. calc. for C12H18O4Sn: C, 41.62(41.48); H, 5.24(5.01); IR (cm−1): 1727, m (νC![[double bond, length as m-dash]](https://www.rsc.org/images/entities/char_e001.gif) O), 1576, (νCOOasym), 1362, (νCOOsym), 572, m (νSn–C), 427, m (νSn–O). 1H NMR (DMSO-d6, ppm, 300 MHz): 6.83 (d, 1H, H5 3J[1H–1H] = 7.2 Hz), 6.71 (s, 1H, H8), 3.37 (s, 3H, H9), 3.70 (s, 3H, H10), 3.28 (s, 2H, H2), 0.55 (s, 3H, Sn–CH3 2J[119/117Sn–1H] = 58 Hz, 56 Hz). 13C NMR (DMSO-d6, ppm, 75 MHz): 175.45 (C1), 43.02 (C2), 130.09 (C3), 121.36 (C4), 112.02 (C5), 147.54 (C6), 148.73 (C7), 113.34 (C8), 55.94 (C9), 55.94 (C10), 0.62 (Cα), 1J[119/117Sn–13Cα] = 525, 502 Hz, 119Sn (acetonitrile-d3, ppm 186 MHz) = 90.0; solubility; acetonitrile, DMSO, CHCl3.
O), 1576, (νCOOasym), 1362, (νCOOsym), 572, m (νSn–C), 427, m (νSn–O). 1H NMR (DMSO-d6, ppm, 300 MHz): 6.83 (d, 1H, H5 3J[1H–1H] = 7.2 Hz), 6.71 (s, 1H, H8), 3.37 (s, 3H, H9), 3.70 (s, 3H, H10), 3.28 (s, 2H, H2), 0.55 (s, 3H, Sn–CH3 2J[119/117Sn–1H] = 58 Hz, 56 Hz). 13C NMR (DMSO-d6, ppm, 75 MHz): 175.45 (C1), 43.02 (C2), 130.09 (C3), 121.36 (C4), 112.02 (C5), 147.54 (C6), 148.73 (C7), 113.34 (C8), 55.94 (C9), 55.94 (C10), 0.62 (Cα), 1J[119/117Sn–13Cα] = 525, 502 Hz, 119Sn (acetonitrile-d3, ppm 186 MHz) = 90.0; solubility; acetonitrile, DMSO, CHCl3.
Synthesis of tributylstannyl 2-(3,4-dimethoxyphenyl)acetate (C2)
Yield: 85%; mp: 200–202 °C; mol. wt: 472.16; anal. calc. for C21H36O4Sn: C, 53.38(52.97); H, 7.68(7.51). IR (cm−1): 1740, m (νC![[double bond, length as m-dash]](https://www.rsc.org/images/entities/char_e001.gif) O), 1596, (νCOOasym), 1337, (νCOOsym), 511, m (νSn–C), 427, m (νSn–O). 1H NMR (CDCl3, ppm, 300 MHz); 7.44 (s, 1H, H8), 7.19–7.22 (d, 1H, H5 3J[1H–1H] = 7.5 Hz), 7.28–7.27 (d, 1H, H4 3J[1H–1H] = 2.8 Hz), 3.88 (s, 3H, H9), 3.87 (s, 3H, H10), 3.56 (s, 2H, H2), 1.65 (t, 6H, Hα, 3J[1H–1H] = 8.0 Hz), 1.58 (m, 6H, Hβ), 1.27 (m, 6H, Hγ), 0.89 (t, 9H–Hδ), 3J[1H–1H = 7.28 Hz]. 13C NMR (CDCl3, ppm, 75 MHz): 177.23 (C1), 41.71 (C2) 112.35 (C3), 121.31 (C4), 101.08 (C5), 147.72 (C6), 148.70 (C7), 108.27 (C8), 55.87 (C9), 55.74 (C10) 16.45 (Cα, 1J[119/117Sn–13Cα] = 336, 328 Hz), 27.03 (Cβ), 27.88 (Cγ, 1J[119Sn–13Cγ] = 65 Hz), 13.69 (Cδ), 119Sn (acetonitrile-d3, ppm 186 MHz) = 112.2: solubility: acetonitrile, DMSO, CHCl3.
O), 1596, (νCOOasym), 1337, (νCOOsym), 511, m (νSn–C), 427, m (νSn–O). 1H NMR (CDCl3, ppm, 300 MHz); 7.44 (s, 1H, H8), 7.19–7.22 (d, 1H, H5 3J[1H–1H] = 7.5 Hz), 7.28–7.27 (d, 1H, H4 3J[1H–1H] = 2.8 Hz), 3.88 (s, 3H, H9), 3.87 (s, 3H, H10), 3.56 (s, 2H, H2), 1.65 (t, 6H, Hα, 3J[1H–1H] = 8.0 Hz), 1.58 (m, 6H, Hβ), 1.27 (m, 6H, Hγ), 0.89 (t, 9H–Hδ), 3J[1H–1H = 7.28 Hz]. 13C NMR (CDCl3, ppm, 75 MHz): 177.23 (C1), 41.71 (C2) 112.35 (C3), 121.31 (C4), 101.08 (C5), 147.72 (C6), 148.70 (C7), 108.27 (C8), 55.87 (C9), 55.74 (C10) 16.45 (Cα, 1J[119/117Sn–13Cα] = 336, 328 Hz), 27.03 (Cβ), 27.88 (Cγ, 1J[119Sn–13Cγ] = 65 Hz), 13.69 (Cδ), 119Sn (acetonitrile-d3, ppm 186 MHz) = 112.2: solubility: acetonitrile, DMSO, CHCl3.
Synthesis of triphenylstannyl 2-(3,4-dimethoxyphenyl)acetate (C3)
Yield: 79%; mp: 212–214 °C; mol. wt.: 532.06: anal. calc. for C27H24O4Sn: C, 60.89(60.74); H, 4.55(4.39): IR (cm−1): 1736, m (νC![[double bond, length as m-dash]](https://www.rsc.org/images/entities/char_e001.gif) O), 1613, (νCOOasym), 1369, (νCOOsym), 557, m (νSn–C),441, m (νSn–O): 1H NMR (DMSO, d3, ppm, 300 MHz): 7.62 (s, 1H, H8), 7.74 (m, 1H, H5), 7.73–7.72 (d, 1H, H4 3J[1H–1H] = 3.4 Hz), 3.71 (s, 3H, H9), 3.58 (s, 3H, H10), 3.33 (s, 2H, H2), 7.51 (m, 1H–Hβ), 7.27 (m, 1H–Hγ), 7.47 (m, 1H–Hδ). 13C NMR (CDCl3, ppm, 75 MHz): 170.43 (C1), 43.16 (C2), 129.18 (C3), 128.35 (C4), 108.11 (C5), 146.65 (C6), 137.94 (C7), 108.11 (C8), 55.98 (C9), 55.61 (C10), 137.33 (Cα, 1J[119/117Sn–13Cα] = 615, 588 Hz), 131.21 (Cβ), 136.16 (Cγ), 131.21 (Cδ), 119Sn (acetonitrile-d3, ppm 186 MHz) = −51: solubility: acetonitrile, DMSO, CHCl3.
O), 1613, (νCOOasym), 1369, (νCOOsym), 557, m (νSn–C),441, m (νSn–O): 1H NMR (DMSO, d3, ppm, 300 MHz): 7.62 (s, 1H, H8), 7.74 (m, 1H, H5), 7.73–7.72 (d, 1H, H4 3J[1H–1H] = 3.4 Hz), 3.71 (s, 3H, H9), 3.58 (s, 3H, H10), 3.33 (s, 2H, H2), 7.51 (m, 1H–Hβ), 7.27 (m, 1H–Hγ), 7.47 (m, 1H–Hδ). 13C NMR (CDCl3, ppm, 75 MHz): 170.43 (C1), 43.16 (C2), 129.18 (C3), 128.35 (C4), 108.11 (C5), 146.65 (C6), 137.94 (C7), 108.11 (C8), 55.98 (C9), 55.61 (C10), 137.33 (Cα, 1J[119/117Sn–13Cα] = 615, 588 Hz), 131.21 (Cβ), 136.16 (Cγ), 131.21 (Cδ), 119Sn (acetonitrile-d3, ppm 186 MHz) = −51: solubility: acetonitrile, DMSO, CHCl3.
Computational details
The computational calculations were accomplished by DFT approach to optimize the structures in the gas phase [2].66 The Gaussian 09 package was used to visualize all the theoretical results.67 The chemical shift (δ) values were calculated from the optimized geometries by employing Gauge Independent Atomic Orbital (GIAO) with B3LYP functional and LANL2DZ basis set.68 Natural bond orbital (NBO) analysis was performed using similar functional and basis set to check the charge density on individual atom.Cyclic voltammetry
Redox activity of the synthesized compounds was done on Corrtest CS Electrochemical Workstation, China. Equimolar concentrations (1 mM each) for all compounds were taken in 80% dimethyl sulfoxide solution having 0.1 M TBAP (tetrabutyl ammonium perchlorate) as supporting electrolyte using three electrode electrochemical cell. The glassy carbon (GC) was used as working electrode with surface area 3 mm (0.03 cm2), Ag/AgCl as reference electrode and platinum wire as counter electrode. Prior to experimental work, working electrode (GC) was washed several times with aq. Al2O3 on a nylon pad with double distilled water.DNA binding studies
DNA interaction with foremost effective compound C2 were performed following a published strategy.69,70 Lyophilized Herring sperm DNA (Sigma Aldrich, USA) was weighed and its stock solution was prepared by dissolving 5 mg of lyophilized powder in 10 mL of distilled water which was then estimated for purity by taking ratio of absorption at 260 and 280 nm. Ratio was found in between 1.6 and 1.9 which indicated that DNA is pretty pure to carry out assay. Different concentrations of compound from 0 to 400 μM were first allowed to react with a fixed DNA concentration in order to obtain a reasonable concentration of compound that can be tested with varying DNA concentrations to evaluate DNA binding. End concentration of test compound C2 in each well of 96-well UV microplate was kept 200 μM with varying (from 0 μM to 396 μM) end concentration of hs-DNA. After an incubation of 30 min in dark at room temperature, the UV absorption spectra were recorded using a FLUOstar Omega microplate reader (BMG Labtech, Germany).Cell culture
Breast cancer (MCF-7, ATCC® HTB-22™) cells, cervical cancer (HeLa, ATCC® CCL-2™) cells and Baby Hamster Kidney (BHK-21, ATCC® CCL-10™) were gifted by Dr Syed Shahzad ul Hussan from Lahore University of Management Sciences (LUMS). Main stocks of these cells were cryopreserved at −196 °C. DMEM (Dulbecco's modified Eagles Medium), RPMI (Rosewell Park Memorial Institute Medium), fetal bovine serum (FBS) and penicillin streptomycin (Pen/Strep) were purchased from Gibco, USA. MCF-7 cells were grown in DMEM supplemented with 15% FBS and 1% Pen/Strep while HeLa and BHK-21 cells were grown in RPMI supplemented with 10% FBS and 1% Pen/Strep. Different dyes like 3-(4,5-dimethylthiazolyl-2)-2,5-diphenyltetrazolium bromide (MTT), propidium iodide (PI), 4′,6-diamidino-2-phenylindole (DAPI), 2′,7′-dichlorodihydrofluorescein diacetate (H2DCF-DA) and 5′,5′,6′,6′-tetrachloro-1′,1′,3′,3′-iodide (JC-1) dyes were purchased from Sigma Aldrich, USA.MTT cell viability assay
Cytotoxic capability of compounds was determined in MCF-7 and HeLa cells by MTT cell viability assay as described earlier,71,72 while BHK-21 cells were used to study effect of these compounds on non-cancerous cells. Briefly, 1 × 10⁴ cells per well in a sterile 96-well culture microtiter plate were seeded and incubated in a 5% CO2 incubator at 37 °C for 24 hours. Compounds were initially tested at 100 μM end concentration and then their dilutions were made to calculate IC50 values while 1% DMSO was used as control. After 24 hours, cells were treated with 0.2 mg mL−1 MTT reagent for 4 hours. 10% acidified SDS (sodium dodecyl sulfate) solubilizing solution in propanol (1![[thin space (1/6-em)]](https://www.rsc.org/images/entities/char_2009.gif) :
:![[thin space (1/6-em)]](https://www.rsc.org/images/entities/char_2009.gif) 1) was added to solubilize formazan crystals. After 30 minutes on gyratory shaker, plate was placed in microplate reader to measure optical density. IC50 values were calculated from three independent experiments as previously reported.73
1) was added to solubilize formazan crystals. After 30 minutes on gyratory shaker, plate was placed in microplate reader to measure optical density. IC50 values were calculated from three independent experiments as previously reported.73
Estimation of release of lactate dehydrogenase (LDH)
Release of an endogenous enzyme lactate dehydrogenase into extracellular fluid i.e. culture medium upon treatment with the compound C2 at concentrations of 3.25 μM and 6.5 μM was assessed by Pierce LDH Cytotoxicity Assay Kit (Thermo Scientific). Briefly, 1 × 10⁴ cells were seeded in a clear, flat bottom, sterile, polystyrene 96-well culture plate, kept overnight in incubator and treated with the compound. After 24 hours, plate was centrifuged at 1500 rpm for 3 minutes and supernatant was transferred to a new sterile 96-well plate. After addition of substrate mix, plate was placed in dark for 30 minutes at room temperature and absorbance was measured at 490 nm and 680 nm. Cytotoxicity was measured as described earlier.74Microscopic analysis of apoptosis
Morphological analysis of cells was performed using fluorescence imaging technique. Briefly, 2 × 10⁵ cells per well were incubated overnight and treated with compound (C2) at 3.25 μM and 6.5 μM concentrations. After 24 hours, cells were washed with sterile PBS (phosphate buffered saline) and fixed with 4% formalin and 0.1% Triton X-100. Then 10 μL of propidium iodide (PI) or 4′,6-diamidino-2-phenylindole (DAPI) dye was added and kept in dark for 10 minutes. Images were captured as previously reported.70Determination of intracellular reactive oxygen species (ROS) production
The ROS production in HeLa cells after treatment with compound (C2) was visualized by fluorescence microscope. Cells (2 × 10⁵) were treated with 3.25 μM and 6.5 μM end concentration of the compound. After 24 hours, cells were fixed, treated with 2′,7′-dichlorodihydrofluorescein diacetate (H2DCF-DA) dye, placed in dark for 10 minutes and observed under fluorescence microscope as previously reported.75Cell cycle analysis assay
Effect of potent compound on distribution of cell cycle was analyzed by flow cytometer. Briefly, HeLa cells (2 × 10⁵ cells per mL) were seeded, given an overnight incubation and treated for 24 hours by compound (C2) at 3.25 μM and 6.5 μM concentrations. Pellet was obtained after harvesting the cells and washed three times with PBS. Cells were allowed to fix in 70% ethanol and kept at −20 °C for 24 hours. Cell pellet obtained after centrifugation was re-suspended in propidium iodide solution, kept in dark for 30 minutes and analysed as earlier mentioned.76Apoptosis assessment by caspase-9 and -3 activity
Activation of apoptosis inducer by active compound (C2) was assessed using fluorometric assay kit by Abcam. 10 × 105 cells were incubated for overnight and then treated with compound (C2) at concentrations of 3.25 μM and 6.5 μM. After an 18 hours treatment, cells were harvested and lysed. After determination of protein content, lysate was treated with substrates in fluorometric assay kit (Abcam) and fluorescence was measured as previously reported.73Measurement of mitochondrial membrane potential (ΔΨm)
Apoptotic agents which target mitochondria cause a decrease in mitochondrial membrane potential. 1 × 10⁵ cells were seeded and treated with compound at its 3.25 μM and 6.5 μM concentrations. After 24 hours, cells were harvested, treated with 0.25 μM JC-1 (5′,5′,6′,6′-tetrachloro-1′,1′,3′,3′-iodide) dye, shifted to a black-well 96-wells plate, kept in dark for 20 minutes and emission of fluorescence was measured at 590 nm for j-aggregates and 520 nm for j-monomers. Results were calculated as previously reported.77Conclusion
Three new triorganotin(IV) compounds with aromatic carboxylate ligands were synthesized, spectroscopically characterized and were evaluated for their antiproliferative properties using two cancerous (Hela and MCF-7) and a non-cancerous (BHK-21) cell line. All compounds showed antitumoral property while most potent compound C2 was evaluated for its pro-apoptotic mechanism. Compound C2 has induced apoptosis at micromolar concentration in cancer cells which was visualized by fluorescence microscopy using PI and DAPI staining, noticed through high ROS production using H2DCF-DA analyzed by cell cycle arrest through flow cytometry, detected by caspase-9 and -3 activation and identified by a decrease in mitochondrial membrane potential. Compound C2 has good in vitro antiproliferative potential which should be further evaluated by animal studies. The most potency of C2 is due to the lipophilic and electron donating ability of butyl group that interact with the tumor cells. As Sn(IV) center has a Lewis acid character, proven by NBO analysis, the quest for electrons is fulfilled by the butyl group attached to Sn(IV) atom. The UV-Vis spectroscopy and cyclic voltammetry further revealed electrostatic interaction mode which is more supported by butyl groups and is proven by the interaction of DNA with the C2 with high binding constant values.Conflicts of interest
There are no conflicts to declare.Acknowledgements
We are thankful to Sumera Zaib for her assistance in the drafting of the manuscript. PLD acknowledges support from NSF Grant CHE-1809116.References
- M. Redza-Dutordoir and D. A. Averill-Bates, Biochim. Biophys. Acta Mol. Cell Res., 2016, 1863, 2977 CrossRef CAS.
- J. F. R Kerr, A. H. Wyllie and A. R. Currie, Br. J. Cancer, 1972, 26, 239 CrossRef.
- P. Pallepati and D. A. Averill-Bates, Free Radicals Biol. Med., 2012, 48, 749 Search PubMed.
- S. Fulda, A. M. Gorman, O. Hori and A. Samali, Int. J. Cell Biol., 2010, 2010, 1 Search PubMed.
- Y. Kasahara, K. Iwai, A. Yachie, K. Ohta, A. Konno, H. Seki, T. Miyawaki and N. Taniguchi, Am. J. Hematol., 1997, 89, 1748 CAS.
- B. Halliwell, Trends Pharmacol. Sci., 2011, 32, 125 CrossRef CAS.
- R. Mirzayans, B. Andrais, P. Kumar and D. Murray, Int. J. Mol. Sci., 2016, 17, 708 CrossRef.
- C. C. Winterbourn, Free Radicals Biol. Med., 2015, 80, 164 CrossRef CAS.
- C. J. Valvona, H. L. Fillmore, P. B. Nunn and G. J. Pilkington, Brain Pathol., 2016, 26, 3 CrossRef CAS.
- B. Méry, J. B. Guy, A. Vallard, S. Espenel, D. Ardail, C. Rodriguez-Lafrasse, C. Rancoule and N. Magne, J. Cell Death, 2017, 10, 1 Search PubMed.
- D. M. Medeiros, Methods, 2008, 46, 288 CrossRef CAS.
- W. L. Miller, Mol. Cell. Endocrinol., 2013, 379, 62 CrossRef CAS.
- B. B. Lowell and B. M. Spiegelman, Nature, 2000, 404, 652 CrossRef CAS.
- J. Lopez and S. W. G. Tait, Br. J. Cancer, 2015, 112, 957 CrossRef CAS.
- C. Garrido, L. Galluzzi, M. Brunet, P. E. Puig, C. Didelot and G. Kroemer, Cell Death Differ., 2006, 13, 1423 CrossRef CAS.
- L. Contreras, I. Drago, E. Zampese and T. Pozzan, Biochim. Biophys. Acta, Bioenerg., 2010, 1797, 607 CrossRef CAS.
- R. E. Giles, H. Blanc, H. M. Cann and D. C. Wallace, Proc. Natl. Acad. Sci. U. S. A., 1980, 77, 6715 CrossRef CAS.
- C. Pellerito, L. Nagy, L. Pellerito and A. Szorcsik, J. Organomet. Chem., 2006, 691, 1733 CrossRef CAS.
- S. Vyas, E. Zaganjor and M. C. Haigis, Cell, 2016, 166, 555 CrossRef CAS.
- M. Olsson and B. Zhivotovsky, Cell Death Differ., 2011, 18, 1441 CrossRef CAS.
- G. S. Salvesen, Essays Biochem., 2002, 38, 9 CrossRef CAS.
- M. H. Cardone, N. Roy, H. R. Stennicke, G. S. Salvesen, T. F. Franke, E. Stanbridge, S. Frisch and J. C. Reed, Science, 1998, 282, 1318 CrossRef CAS.
- A. G. Porter and R. U. Jänicke, Cell Death Differ., 1999, 6, 99 CrossRef CAS.
- M. S. S. Khan, M. A. Salam, R. S. Haque, A. M. S. Abdul Majid, A. S. B. Abdul Majid, M. Asif, M. K. A. Basheer and Y. M. Tabana, Cogent Biol., 2016, 2, 1154282 CrossRef.
- M. Bouchouit, S. Bouacida, B. Zouchoune, H. Merazig, S. Bua, Z. Bouaziz, M. Le Borgne, C. T. Supuran and A. Bouraiou, J. Enzyme Inhib. Med. Chem., 2018, 33, 1150 CrossRef CAS.
- L. Viganor, O. Howe, P. McCarron, M. McCann and M. Devereux, Curr. Top. Med. Chem., 2017, 17, 1280 CrossRef CAS.
- I. E. Leon, J. Fernando Cadavid-Vargas, A. Laura Di Virgilio and S. Beatriz Etcheverry, Curr. Med. Chem., 2017, 24, 112 CrossRef CAS.
- J. R. Diaz, M. Fernández Baldo, G. Echeverría, H. Baldoni, D. Vullo, D. B. Soria, C. T. Supuran and G. E. Camí, J. Enzyme Inhib. Med. Chem., 2016, 31, 51 CrossRef CAS.
- A. Pontoriero, N. Mosconi, L. Monti, S. Bellú, P. A. Williams, M. Raimondi, B. Lima, G. E. Feresin, B. Nerli and M. Rizzotto, Chem.-Biol. Interact., 2017, 278, 152 CrossRef CAS.
- F. Briganti, S. Tilli, G. Mincione, F. Mincione, L. Menabuoni and C. T. Supuran, J. Enzyme Inhib., 2000, 15, 185 CrossRef CAS.
- A. Alama, B. Tasso, F. Novelli and F. Sparatore, Drug Discov. Today, 2009, 14, 500 CrossRef CAS.
- L. Kelland, Nat. Rev. Cancer, 2007, 7, 573 CrossRef CAS.
- A. Khan, S. Parveen, A. Khalid and S. Shafi, Inorg. Chim. Acta, 2020, 505, 119464 CrossRef CAS.
- M. Vornefeld, F. Huber, H. Preut, G. Ruisi and R. Barbieri, Appl. Organomet. Chem., 1992, 6, 75 CrossRef CAS.
- M. Nath, S. Pokharia, G. Eng, X. Song and A. Kumar, J. Organomet. Chem., 2003, 669, 109 CrossRef CAS.
- T. P. Lockhart and W. F. Manders, Inorg. Chem., 1986, 25, 892 CrossRef CAS.
- P. Harrison, Annu. Rep. Prog. Chem., Sect. A: Inorg. Chem., 1986, 83, 105 RSC.
- A. W. Addison, T. N. Rao, J. Reedijk, J. van Rijn and G. C. Verschoor, J. Chem. Soc., Dalton Trans., 1984, 7, 1349 RSC.
- F. J. Mejia-Rivera, J. G. Alvarado-Rodríguez, N. Andrade-López, J. Cruz-Borbolla and V. Jancik, Inorg. Chem. Commun., 2018, 97, 44 CrossRef CAS.
- M. Iqbal, I. Ahmad, S. Ali, N. Muhammad, S. Ahmed and M. Sohail, Polyhedron, 2013, 50, 524 CrossRef CAS.
- M. Shabbir, Z. Akhter, I. Ahmad, S. Ahmed, H. Ismail, B. Mirza, V. Mckee and M. Bolte, Bioelectrochem, 2015, 104, 85 CrossRef CAS.
- M. Shabbir, Z. Akhter, I. Ahmad, S. Ahmed, M. Bolte and V. McKee, Bioorg. Chem., 2017, 75, 224 CrossRef CAS.
- N. Arshad and S. I. Farooqi, Appl. Biochem. Biotechnol., 2018, 186, 1090 CrossRef CAS.
- M. Aslanoglu and G. Ayne, Anal. Bioanal. Chem., 2004, 380, 658 CrossRef CAS.
- N. Uddin, F. Rashid, S. Ali, S. A. Tirmizi, I. Ahmad, S. Zaib, M. Zubair, P. L. Diaconescu, M. N. Tahir, J. Iqbal and A. Haider, J. Biomol. Struct. Dyn., 2019, 38, 1 Search PubMed.
- S. Ali, S. Shahzadi and I. ud-Din, Iran. J. Sci. Technol. A., 2018, 42, 505 CrossRef.
- M. O. Hengartner, Nature, 2000, 407, 770 CrossRef CAS.
- P. Kumar, A. Nagarajan and P. D. Uchil, Cold Spring Harb. Protoc., 2018, 2018, 095505 Search PubMed.
- J. C. Stockert, A. Blázquez-Castro, M. Cañete, R. W. Horobin and A. Villanueva, Acta Histochem., 2012, 114, 785 CrossRef CAS.
- M. K. Ediriweera, K. H. Tennekoon and S. R. Samarakoon, J. Appl. Toxicol., 2019, 39, 38 CrossRef CAS.
- S. K. Hadjikakou and N. Hadjiliadis, Coord. Chem. Rev., 2009, 253, 235 CrossRef CAS.
- M. Asanagi, S. Yamada, N. Hirata, H. Itagaki, Y. Kotake, Y. Sekino and Y. Kanda, J. Toxicol. Sci., 2016, 41, 207 CrossRef CAS.
- L. C. Crowley, A. P. Scott, B. J. Marfell, J. A. Boughaba, G. Chojnowski and N. J. Waterhouse, Cold Spring Harb. Protoc., 2016, 2016, 087163 Search PubMed.
- R. Mandelkow, D. Guembel, H. Ahrend, A. Kaul, U. Zimmermann, M. Burchardt and M. Stope, Anticancer Res., 2017, 37, 2239 CrossRef CAS.
- M. J. Gayoso, Microsc. Res. Tech., 2012, 75, 849 CrossRef.
- Y. S. Bae, H. Oh, S. G. Rhee and Y. Do Yoo, Mol. Cell, 2011, 32, 491 CrossRef CAS.
- K. Brieger, S. Schiavone, F. J. Miller and K. H. Krause, Swiss Med. Wkly., 2012, 142, w13659 CAS.
- C. R. Reczek and N. S. Chandel, Annu. Rev. Cancer Biol., 2017, 1, 79 CrossRef.
- G. M. Cohen, Biochem. J., 1997, 326, 1 CrossRef CAS.
- A. Degterev, M. Boyce and J. Yuan, Oncogene, 2003, 22, 8543 CrossRef CAS.
- D. C. Wallace, Nat. Rev. Cancer, 2012, 12, 685 CrossRef CAS.
- P. Lu, B. J. Bruno, M. Rabenau and C. S. Lim, J. Controlled Release, 2016, 240, 38 CrossRef CAS.
- Q. Li, X. Liu, S. Cheng, R. Zhang, Y. Shi and C. Ma, RSC Adv., 2016, 6, 32484 RSC.
- W. L. Armarego, Purification of laboratory chemicals, Butterworth-Heinemann, 2017 Search PubMed.
- H. E. Gottlieb, V. Kotlyar and A. Nudelman, J. Org. Chem., 1997, 62, 7512 CrossRef CAS.
- S. Alyar, T. Şen, Ü. Ö. Özmen, H. Alyar, Ş. Adem and C. Şen, J. Mol. Struct., 2019, 1185, 416 CrossRef CAS.
- M. J. Frisch, G. W. Trucks, H. B. Schlegel, M. A. Robb, J. A. Montgomery, T. Vreven, K. N. Kudin, J. C. Burant, J. M. Millam, S. S. Iyengar, J. Tomasi and V. Barone, GAUSSIAN 3 (Revision C.02), Inc., Wallingford CT, 2004 Search PubMed.
- W. Kutzelnigg, U. Fleischer and M. Schindler, NMR basic principles and progress, Springer-Verlag, Berlin, 1990 Search PubMed.
- M. Sirajuddin, S. Ali, A. Haider, N. A. Shah, A. Shah and M. R. Khan, Spectrochim. Acta, Part A, 2012, 94, 134 CrossRef CAS.
- J. Iqbal, S. A. Ejaz, A. Saeed, M. al-Rashida and J. Iqbal, Eur. J. Pharmacol., 2018, 832, 11 CrossRef CAS.
- T. Mosmann, J. Immunol. Methods, 1983, 65, 55 CrossRef CAS.
- M. Niks and M. Otto, J. Immunol. Methods, 1990, 130, 149 CrossRef CAS.
- N. Uddin, F. Rashid, S. Ali, S. A. Tirmizi, I. Ahmad, S. Zaib, M. Zubair, P. L. Diaconescu, M. N. Tahir, J. Iqbal and A. Haider, J. Biomol. Struct. Dyn., 2019, 38, 1 Search PubMed.
- C. Scifo, V. Cardile, A. Russo, R. Consoli, C. Vancheri, F. Capasso, A. Vanella and M. Renis, Oncol. Res., 2004, 14, 415 CrossRef.
- H. S. Shah, S. A. Joshi, A. Haider, U. Kortz and J. Iqbal, RSC Adv., 2015, 5, 93234 RSC.
- S. S. Hamdani, B. A. Khan, S. Hameed, F. Rashid, S. Zaib, K. Ahmad, E. U. Mughal and J. Iqbal, Med. Chem., 2019, 15, 892 CrossRef CAS.
- Q. Al-anbaky, Z. Al-karakooly, S. P. Kilaparty, M. Agrawal, Y. M. Albkuri, A. B. RanguMagar, A. Ghosh and N. Ali, Int. J. Toxicol., 2016, 35, 672 CrossRef CAS.
Footnotes |
| † Electronic supplementary information (ESI) available. CCDC 2019832. For ESI and crystallographic data in CIF or other electronic format see DOI: 10.1039/d0ra06695h |
| ‡ These authors contributed equally to the work. |
| This journal is © The Royal Society of Chemistry 2021 |

