 Open Access Article
Creative Commons Attribution 3.0 Unported Licence
Disruption of mitochondrial redox homeostasis by enzymatic activation of a trialkylphosphine probe†
Jade
Nguyen
ab,
Alina
Tirla
a and
Pablo
Rivera-Fuentes
 *ab
*ab
aLaboratory of Organic Chemistry, ETH Zurich, Vladimir-Prelog-Weg 3, 8093 Zurich, Switzerland. E-mail: pablo.riverafuentes@epfl.ch
bInstitute of Chemical Sciences and Engineering, EPF Lausanne, CH C2 425, Station 6, 1015 Lausanne, Switzerland
First published on 26th February 2021
Abstract
Redox homeostasis is essential for cell function and its disruption is associated with multiple pathologies. Redox balance is largely regulated by the relative concentrations of reduced and oxidized glutathione. In eukaryotic cells, this ratio is different in each cell compartment, and disruption of the mitochondrial redox balance has been specifically linked to metabolic diseases. Here, we report a probe that is selectively activated by endogenous nitroreductases, and releases tributylphosphine to trigger redox stress in mitochondria. Mechanistic studies revealed that, counterintuitively, release of a reducing agent in mitochondria rapidly induced oxidative stress through accumulation of superoxide. This response is mediated by glutathione, suggesting a link between reductive and oxidative stress. Furthermore, mitochondrial redox stress activates a cellular response orchestrated by transcription factor ATF4, which upregulates genes involved in glutathione catabolism.
Introduction
Intracellular reduction–oxidation (redox) balance is primarily regulated by the relative concentrations of glutathione (GSH) and its oxidized, disulfide-bonded dimer (GSSG).1 Multiple physiological processes, ranging from cell signaling to protein folding, depend on redox homeostasis. Consequently, several pathological conditions such as cancer,2 diabetes3 and neurodegenerative diseases4 have been associated with redox imbalance. In eukaryotes, this homeostasis is controlled at the level of subcellular compartments and each organelle possesses its own redox environment.5 Being able to modulate the GSH/GSSG ratio in an organelle-specific manner would allow us to investigate the relationship between cellular redox stress responses and the spatial origin of the imbalance, enriching our understanding of subcellular compartmentalization of redox signaling.Mitochondria perform multiple essential tasks in the cell that depend on redox modulation. Disruption of this homeostasis leads to pathologies such as insulin resistance, obesity and type II diabetes.6 Whereas the effects of oxidative stress in mitochondria have been thoroughly investigated,7 reductive stress has remained significantly underexplored. An important advance in this area was the development of enzymes that can control the ratios of oxidized and reduced nicotinamide adenine dinucleotide (NAD+/NADH)8 and their phosphate derivatives (NADP+/NADPH).9 Small molecules that could induce reductive stress by directly affecting the ratio of GSH/GSSG would provide additional information of how cells respond to reductive stress through modulation of this essential redox buffer.
We envisioned that the GSH/GSSG ratio could be manipulated by direct reduction of the disulfide bond in GSSG. This disulfide can be efficiently and rapidly reduced to GSH by trialkylphosphine derivatives, which have no appreciable reactivity against other amino acids.10,11 We hypothesized that we could achieve mitochondria-specific reductive stress by taking advantage of the activity of enzymes that are present only in these organelles to trigger the release of tributylphosphine from a masked precursor. Here, we report the development of such probe, its validation in live human cells, and its application to characterize the cellular response to mitochondrial reductive stress.
Results and discussion
Design, synthesis and enzymatic activation of a biocompatible trialkylphosphine probe
To induce reductive stress selectively in mitochondria, we envisioned a probe that could release the reducing agent tributylphosphine and a reporter fluorophore after activation by endogenous nitroreductases (NTRs) that are naturally overexpressed in mitochondria.12,13 We developed tributylphosphonium probe 1 with a nitro group as the enzymatically activatable trigger (Scheme 1A). Upon enzymatic reaction, the strong electron-withdrawing nitro group is converted to an amine. This electron-rich substituent donates electron density to the π-conjugated system, cleaving the weak C–P bond to release the reducing agent tributylphosphine (PBu3) and fluorescent reporter 2 (Scheme 1A). | ||
| Scheme 1 (A) Mechanism of enzymatic activation of probe 1 and release of PBu3 and fluorescent reporter 2. (B) Synthesis of probes 1 and 3. | ||
Probe 1 was synthesized in three steps, and probe 3 in two steps, in overall moderate yields (Scheme 1B). Methylation of 2,3,3-trimethylindolenine (4) by microwave irradiation yielded indoleninium 5. Probe 3 and dye 2 were obtained by Knoevenagel condensation of 5 with 4-nitrobenzaldehyde and 4-aminobenzaldehyde respectively. The phosphonium moiety was introduced by conjugate addition of n-tributyl phosphine to probe 3 to afford probe 1 in high yield.
Probe 1 displayed no significant fluorescence prior to enzymatic activation because the tributylphosphonium moiety interrupts the conjugation of the π-system (Scheme 1A and Table S1†). Reporter dye 2, in contrast, displays strong absorption and fluorescence in the visible range (Scheme 1A, Table S1 and Fig. S1†). To test the efficacy of the design, probe 1 was exposed to a purified bacterial NTR. As expected, this enzyme reduced the nitro group of probe 1, producing reporter 2 with concomitant release of tributylphosphine (Fig. S2†). Probe 3, which is an analogue of probe 1 that lacks tributylphosphine, was also converted to fluorophore 2 by bacterial NTR (Fig. S2†). Probe 3, which cannot release tributylphosphine, is an excellent negative control to study the effects of reductive stress induced by probe 1.
Cellular uptake, organelle specificity and redox modulation
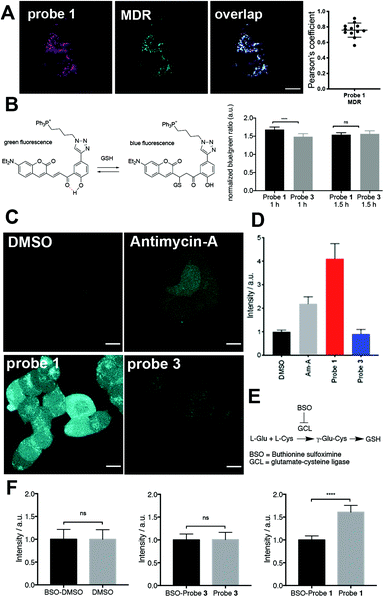
Confocal microscopy experiments employing live HEK293 cells revealed that both probes 1 and 3 are activated exclusively in mitochondria (Fig. 1A, Fig. S3 and Movie S1†). Owing to the different cellular uptake of probes 1 and 3 (Fig. S4†), we performed titration experiments to estimate which incubation conditions produced similar intracellular concentrations of dye 2, the enzymatic product of both probe 1 and 3 (Fig. S5†). We determined that incubation of cells with probe 1 and 3 at concentrations of 15 μM and 5 μM, respectively, resulted in similar intracellular concentrations of dye 2. Under the conditions of all subsequent experiments (incubation of less than 2 h), these concentrations did not induce significant toxicity in HEK293 cells (Fig. S6†).We tested whether release of tributylphosphine from probe 1 increased the concentration of GSH in mitochondria. To assess the redox state in mitochondria, we used a glutathione-specific, mitochondria-targeted Grx1-roGFP2 fusion protein sensor.14 This genetically encoded biosensor reacts rapidly to changes in GSH/GSSG ratio and is ratiometric by excitation. We observed a change towards a more oxidized state after treatment with probe 1 after a 30 min incubation (Fig. S7†), corresponding to an increase in ratio of integrated fluorescence intensities (500–530 nm) measured upon excitation at 405 or 488 nm. The change towards a more oxidized state can be observed using H2O2 (Fig. S8a†). However, the change in 405/488 nm ratio towards a more reduced state can only be observed by treating cells with high concentrations (5 mM) of the strong reducing agent DL-dithiothreitol (DTT) (Fig. S8b†). We hypothesized that the lack of sensitivity towards a more reduced state could prevent the observation of an initial reductive stress response from probe 1. To address this issue and study the glutathione redox state more thoroughly, we developed a mitochondria-targeted fluorescent sensor based on a reported cytosolic probe (Fig. 1B and Fig. S9–S12†).15 We chose this probe because it emits at short wavelengths and does not overlap with the emission of reporter dye 2. In this case, the probe is ratiometric by excitation and emission and an increase in blue/green ratio indicates a shift towards a more reduced state. Cells incubated for 1 h with probe 1 displayed significantly increased mitochondrial GSH/GSSG ratio compared to control probe 3 (Fig. 1B). After 1.5 h, this effect faded, suggesting that redox homeostasis had been restored. Additionally, we did not find a significant difference in GSH/GSSG ratio between cells treated with control probe 3 or DMSO only (Fig. S12†). The good sensitivity toward reduced state but slow kinetics of this sensor could explain that we indeed observe a reductive stress response but with a delayed signal.
With these two redox sensors we could show that activation of probe 1 in mitochondria releases a strong reducing agent capable of transforming GSSG into GSH and despite its initial reductive stress response, it led to oxidative stress after longer incubation times. This response was not a consequence of reduction of the nitro group in probe 1 because control probe 3 did not induce any noticeable change in redox status compared to DMSO (Fig. S12†). So how can a reducing agent induce oxidative stress? Previous studies have reported that an increase in GSH may lead to oxidative stress through accumulation of intracellular superoxide (O2−),16 which would explain our observations. We used a fluorescent indicator of intracellular O2− to test this hypothesis.17
We employed Antimycin-A, an inhibitor of complex III that induces mitochondrial O2− production,17 as positive control and DMSO as negative control. Cells treated with probe 1 displayed significantly higher O2− accumulation than cells treated with probe 3 (Fig. 1C and D). Similar results were obtained even when control probe 3 was used at the same extracellular concentration as probe 1 (15 μM, Fig. S13†), which leads to a much higher intracellular concentration of probe 3 (Fig. S4 and S5†). Moreover, to test whether the increase in O2− induced by probe 1 depends on the total concentration of GSH, we blocked its synthesis by inhibiting γ-glutamylcysteine synthetase (glutamate–cysteine ligase) using buthionine sulfoximine (BSO, Fig. 1E).18 In cells treated with both BSO and probe 1, we observed a significant decrease in O2− levels compared to cells treated only with probe 1 (Fig. 1F). In contrast, BSO did not have an effect on the levels of O2− in cells treated with either control probe 3 or DMSO (Fig. 1F). This observation supports the hypothesis that the observed oxidative stress induced by probe 1 is a consequence of O2− accumulation mediated by excess GSH.
In addition, we explored whether tributylphosphine also reduced disulfide bonds in proteins. Whereas tributylphosphine can reduce GSSG rapidly, breaking disulfide bonds in proteins is greatly hindered by steric bulk.10 If probe 1 was able to break disulfide bonds from proteins, it would increase the amount of free, nucleophilic thiols in the proteome of the treated cells. Using an iodoacetamide alkyne as a general electrophilic probe, and a fluorescent reporter,19 we determined that the proteomes of cells treated with probes 1, 3, or DMSO did not display significantly increased or decreased availability of free, nucleophilic thiols (Fig. S14†), confirming that tributylphosphine reduces the unhindered disulfide bond in GSSG preferentially.
Morphological changes, mitochondrial damage and mitophagy
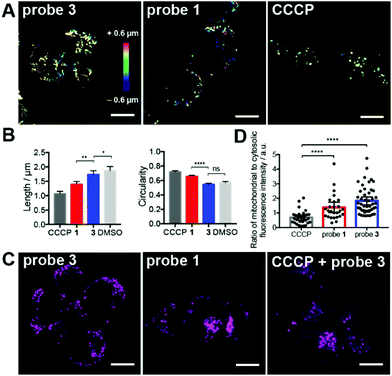
Three-dimensional confocal microscopy revealed that probe 1, but not 3, induced drastic changes in the morphology of mitochondria (Fig. 2A). These changes were evaluated by quantitative image analysis (see ESI† for details) and revealed that mitochondria of cells treated with probe 1 displayed shorter length, greater circularity (Fig. 2B), and smaller aspect ratio (Fig. S15†).These mitochondrial morphologies are reminiscent of those of depolarized mitochondria, for example, after treatment with the protonophore carbonyl cyanide m-chlorophenyl hydrazone (CCCP, Fig. 2A).20 CCCP is a mitochondrial uncoupler that induces membrane depolarization.20 Depolarized mitochondria leak cationic dyes, such as 2, to the cytosol, which can be observed in cells incubated with CCCP (Fig. 2C). In contrast, cells treated with probe 1 retained most of reporter dye 2 in mitochondria, demonstrating that release of tributylphosphine does not induce significant mitochondrial membrane depolarization (Fig. 2D). Notably, CCCP also induced a much larger decrease in mitochondrial area compared to probe 1 (Fig. S15†), suggesting that redox stress induced by trialkylphosphine triggers morphological changes, but not necessarily fragmentation or degradation.
Importantly, the effects of probe 1 on mitochondria could not be reproduced using an untargeted trialkyphosphine. For example, treatment of cells with the membrane-permeant but untargeted trimethyl 3,3′,3′′-phosphanetriyltripropionate (tmTCEP) did not show any significant changes in mitochondrial length compared to the control probe 3 (Fig. S16†). A slight increase in circularity was observed after treatment with tmTCEP compared to probe 3, but this change was not as pronounced as with the mitochondrial stressors probe 1 and CCCP (Fig. S16†). The fact that neither probe 3 nor tmTCEP led to morphological changes indicates that this phenotype is caused by trialkylphosphine generated within mitochondria.
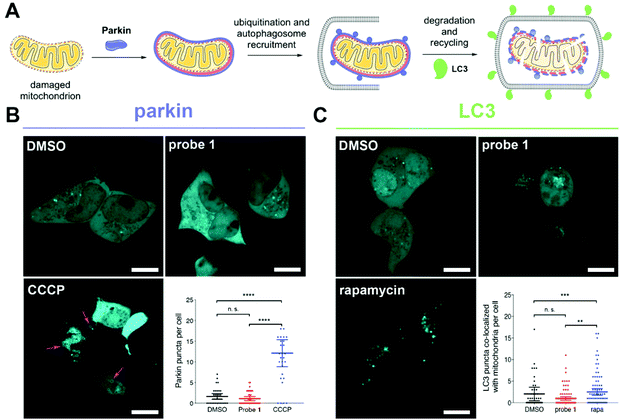
Severely damaged mitochondria undergo degradation and recycling through a selective autophagic process known as mitophagy.21 This process involves recruitment of the ubiquitin ligase parkin to the membrane of depolarized mitochondria,22 ubiquitination, engulfment by the autophagosome, and degradation of the organelle (Fig. 3A).23 To assess whether reductive stress induced by probe 1 triggers mitophagy, we transfected cells with either parkin or the autophagosomal marker LC3 fused to the bright fluorescent protein mTurquoise2 (Fig. S17 and Table S2†). No recruitment of parkin to the mitochondrial membrane was observed in cells treated with probe 1. In contrast, cells treated with CCCP recruited parkin efficiently (Fig. 3B).
We also analyzed the number of LC3 punctae (autophagosomes) that co-localized with mitochondria in cells under various treatments using a custom-made algorithm for image analysis (Fig. 3C and ESI†). We did not find a significant difference between cells treated with probe 1 or DMSO, whereas cells treated with rapamycin, which triggers autophagy, displayed more co-localized punctae (Fig. 3C).24 These observations indicate that mitochondrial redox stress induced by tributylphosphine does not trigger mitophagy, suggesting that a cellular stress response might mitigate the effects of this disruption of redox homeostasis.
Transcriptional response
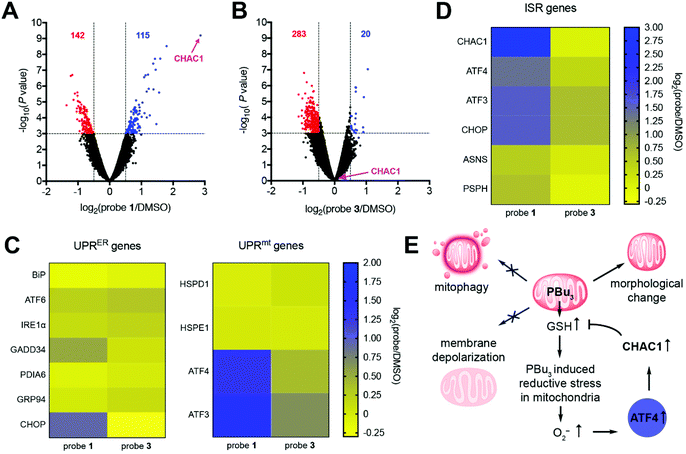
To gain further understanding of how the cell reacts to mitochondrial redox stress, we performed global mRNA sequencing and differential gene expression analysis. This study revealed that cells treated with probe 1 displayed significant upregulation of several genes, particularly γ-glutamyl cyclotransferase (CHAC1), compared to DMSO-treated cells (Fig. 4A). On the other hand, probe 3 induced the upregulation of fewer genes compared to DMSO treatment (Fig. 4B) and the products of these genes had very different cellular and molecular functions compared to probe 1 (Fig. S18†). This comparison confirms that redox stress induced by tributylphosphine is responsible for the upregulation of genes observed with probe 1. CHAC1 regulates redox homeostasis through degradation of GSH,25 suggesting that the cell responds to redox stress by promoting the depletion of excess GSH produced by tributylphosphine. CHAC1 is a component of the PERK branch of the unfolded protein response in the endoplasmic reticulum (UPRER).26 In our case, however, upregulation of CHAC1 is not mediated by the UPRER, because probe 1 did not trigger upregulation of the ER stress marker BiP (Fig. 4C), which is involved in all three branches of the UPRER pathway.26 In addition, other classical activators of the UPRER such as ATF6 or IRE1α, or target genes of this response, such as chaperone GRP94, phosphatase GADD34, or disulfide isomerase PDIA6 were not affected by either probe 1 or 3 (Fig. 4C). These results indicate that upregulation of CHAC1 is not triggered by the UPRER, further confirming the organelle selectivity of probe 1.The UPR in mitochondria (UPRmt) can be activated by employing the mitochondria-specific HSP90 inhibitor gamitrinib-triphenylphosphonium (GTPP), which leads to upregulation of genes HSPD1 and HSPE1.27 Activation of tributylphosphine in mitochondria did not alter transcription of either of these genes (Fig. 4C). Additionally, GTPP induces parkin-mediated mitophagy,28 whereas probe 1 does not (Fig. 3B). These results suggest that redox stress induced by trialkylphosphine does not trigger the UPRmt, or at least not in the way that chaperone inhibitors such as GTPP do.
Our mRNA sequencing results revealed that transcription factors ATF4, ATF3 and CHOP were upregulated by probe 1 (Fig. 4D). These observations are consistent with a recent multi-omics characterization of the stress response to inhibitors of mitochondrial import, translation, membrane potential, or oxidative phosphorylation.29 These inhibitors triggered the integrated stress response (ISR), which is regulated by ATF4 and activates CHAC1.29 This study, however, also reported significant upregulation of genes involved in amino acid metabolism, such as asparagine synthetase (ASNS) and phosphoserine phosphatase (PSPH).29 These genes were only mildly upregulated by redox stress induced by probe 1 (Fig. 4D). Therefore, even though tributylphosphine shares some common features with various mitochondrial inhibitors, for example increased production of O2− (Fig. 1C and D),16 the cellular response that it elicits is unique and seems to address the GSH/GSSG imbalance through CHAC1 upregulation (Fig. 4E).
Conclusions
GSSG is the primary target of tributylphosphine due to its fast reactivity10,11 and abundance1 and is therefore preferentially reduced to GSH compared to other disulfide bonds in proteins (Fig. S14†). When activated in mitochondria, however, tributylphosphine induces oxidative stress through the accumulation of O2−. These increased levels of O2− are positively correlated with the total GSH present in the cell, supporting previous observations of GSH-mediated O2− accumulation.16 This redox imbalance does not depolarize mitochondria or activate stress responses like the UPRER, UPRmt, or mitophagy. Instead, it activates the ATF4-ATF3-CHOP cascade, which upregulates the CHAC1 gene (Fig. 4E). These observations are consistent with reports of mitochondrial oxidation triggered by glutathione-dependent reductive stress16 and activation of ATF4 by O2−.18Our results indicate that trialkylphosphines, a broad family of compounds that have been largely neglected in chemical biology, can expand the chemical space of small molecules that are used to modulate redox biology, with potential impact in the development of new therapies. For example, CHAC1 upregulation has been reported to deplete GSH levels in triple-negative breast cancer cells, making them more susceptible to necroptosis and ferroptosis during cystine starvation.30 In this work, we demonstrated that even though trialkylphosphines are highly reducing and often water-insoluble compounds, they can be transformed into chemical probes for biological use by developing strategies to tune their reactivity, mask their reducing power, target them to specific organelles, and release them selectively.
Conflicts of interest
The authors have no conflicts to declare.Acknowledgements
We thank Elias Halabi (ETH Zurich) for providing the pmTurquoise2-LAMP1 plasmid, Zacharias Thiel (ETH Zurich and EPF Lausanne) for providing the superoxide sensor probe HKSOX-1 and Bertran Rubi (ETH Zurich) for assistance with the LC-MS SIM method. We thank the Scientific Center for Optical and Electron Microscopy (ScopeM) at ETH Zurich and the Bioimaging and Optics Platform (BIOP) of EPF Lausanne for access to confocal microscopes. mRNA library generation, sequencing, and preliminary bioinformatic analyses were carried out at the Functional Genomics Center Zurich. This work was supported by ETH Zurich, EPF Lausanne and the Swiss National Science Foundation (SNSF grants 200021_165551 and PCEGP2_186862).Notes and references
- D. P. Jones, Methods Enzymol., 2002, 348, 93–112 CAS.
- T. C. Jorgenson, W. Zhong and T. D. Oberley, Cancer Res., 2013, 73, 6118–6123 CrossRef CAS.
- M. R. Hayden and J. R. Sowers, Antioxid. Redox Signal., 2007, 9, 865–867 CrossRef CAS.
- M. A. Smith, C. A. Rottkampa, A. Nunomura, A. K. Raina and G. Perry, Biochim. Biophys. Acta, Mol. Basis Dis., 2000, 1502, 139–144 CrossRef CAS.
- D. P. Jones and Y.-M. Go, Diabetes, Obes. Metab., 2010, 12, 116–125 CrossRef CAS.
- J. Szendroedi, E. Phielix and M. Roden, Nat. Rev. Endocrinol., 2012, 8, 92–103 CrossRef CAS.
- M. T. Lin and M. F. F. Beal, Nature, 2006, 443, 787–795 CrossRef CAS.
- D. V. Titov, V. Cracan, R. P. Goodman, J. Peng, Z. Grabarek and V. K. Mootha, Science, 2016, 352, 231–236 CrossRef CAS.
- V. Cracan, D. V. Titov, H. Shen, Z. Grabarek and V. K. Mootha, Nat. Chem. Biol., 2017, 13, 1088–1095 CrossRef CAS.
- J. A. Burns, J. C. Butler, J. Moran and G. M. Whitesides, J. Org. Chem., 1991, 56, 2648–2650 CrossRef CAS.
- A. Tirla and P. Rivera-Fuentes, Angew. Chem., Int. Ed., 2016, 55, 14709–14712 CrossRef CAS.
- A. Chevalier, Y. Zhang, O. M. Khdour, J. B. Kaye and S. M. Hecht, J. Am. Chem. Soc., 2016, 138, 12009–12012 CrossRef CAS.
- Z. Thiel and P. Rivera-Fuentes, Angew. Chem., Int. Ed., 2019, 58, 11474–11478 CrossRef CAS.
- M. Gutscher, A. L. Pauleau, L. Marty, T. Brach, G. H. Wabnitz, Y. Samstag, A. J. Meyer and T. P. Dick, Nat. Methods, 2008, 5, 553–559 CrossRef CAS.
- G. J. Kim, K. Lee, H. Kwon and H. J. Kim, Org. Lett., 2011, 13, 2799–2801 CrossRef CAS.
- H. Zhang, P. Limphong, J. Pieper, Q. Liu, C. K. Rodesch, E. Christians and I. J. Benjamin, FASEB J., 2012, 26, 1442–1451 CrossRef CAS.
- J. J. Hu, N.-K. Wong, S. Ye, X. Chen, M.-Y. Lu, A. Q. Zhao, Y. Guo, A. C.-H. Ma, A. Y.-H. Leung, J. Shen and D. Yang, J. Am. Chem. Soc., 2015, 137, 6837–6843 CrossRef CAS.
- P. S. Lange, J. C. Chavez, J. T. Pinto, G. Coppola, C.-W. Sun, T. M. Townes, D. H. Geschwind and R. R. Ratan, J. Exp. Med., 2008, 205, 1227–1242 CrossRef CAS.
- E. Weerapana, C. Wang, G. M. Simon, F. Richter, S. Khare, M. B. D. Dillon, D. A. Bachovchin, K. Mowen, D. Baker and B. F. Cravatt, Nature, 2010, 468, 790–797 CrossRef CAS.
- E. A. Liberman, V. P. Topaly, L. M. Tsofina, A. A. Jasaitis and V. P. Skulachev, Nature, 1969, 222, 1076–1078 CrossRef CAS.
- J. S. Riley and S. W. G. Tait, Biol. Chem., 2016, 397, 617–635 CAS.
- D. Narendra, A. Tanaka, D.-F. Suen and R. J. Youle, J. Cell Biol., 2008, 183, 795–803 CrossRef CAS.
- J. J. Lemasters, Redox Biol., 2014, 2, 749–754 CrossRef CAS.
- K. Insil, S. Rodriguez-Enriquez and J. J. Lemasters, Arch. Biochem. Biophys., 2007, 462, 245–253 CrossRef.
- R. R. Crawford, E. T. Prescott, C. F. Sylvester, A. N. Higdon, J. Shan, M. S. Kilberg and I. N. Mungrue, J. Biol. Chem., 2015, 290, 15878–15891 CrossRef CAS.
- M. Schröder and R. J. Kaufman, Annu. Rev. Biochem., 2005, 74, 739–789 CrossRef.
- C. Münch and J. W. Harper, Nature, 2016, 534, 710–713 CrossRef.
- F. C. Fiesel, E. D. James, R. Hudec and W. Springer, Oncotarget, 2017, 8, 106233–106248 CrossRef.
- P. M. Quirós, M. A. Prado, N. Zamboni, D. D'Amico, R. W. Williams, D. Finley, S. P. Gygi and J. Auwerx, J. Cell Biol., 2017, 216, 2027–2045 CrossRef.
- M. Chen, S. Wang, C. Hsu, P. Yin, T.-S. Yeh, H. Lee and L. Tseng, Oncotarget, 2017, 8, 114588–114602 CrossRef.
Footnote |
| † Electronic supplementary information (ESI) available. See DOI: 10.1039/d0ob02259d |
| This journal is © The Royal Society of Chemistry 2021 |


