A novel nanosphere-in-nanotube iron phosphide Li-ion battery anode displaying a long cycle life, recoverable rate-performance, and temperature tolerance†
Jinyun
Liu
 *a,
Ting
Zhou
a,
Yan
Wang
a,
Tianli
Han
a,
Chaoquan
Hu
 *bc and
Huigang
Zhang
*bc
aKey Laboratory of Functional Molecular Solids, Ministry of Education, Anhui Provincial Engineering Laboratory for New-Energy Vehicle Battery Energy-Storage Materials, College of Chemistry and Materials Science, Anhui Normal University, Wuhu, Anhui 241002, P. R. China. E-mail: jyliu@ahnu.edu.cn
bNational Laboratory of Solid State Microstructures, College of Engineering and Applied Sciences, Nanjing University, Nanjing, Jiangsu 210093, P. R. China. E-mail: hgzhang@nju.edu.cn
cState Key Laboratory of Multiphase Complex Systems, Institute of Process Engineering, Chinese Academy of Sciences, Beijing 100190, P. R. China
First published on 18th August 2021
Abstract
Currently, non-ideal anodes restricts the development of long-term stable Li-ion batteries. Several currently available high-capacity anode candidates are suffering from a large volumetric change during charge and discharge and non-stable solid interphase formation. Here, we develop a novel nanosphere-confined one-dimensional yolk–shell anode taking iron phosphide (FeP) as a demonstrating case study. Multiple FeP nanospheres are encapsulated inside an FeP nanotube through a magnetic field-assisted and templated approach, forming a nanosphere-in-nanotube yolk–shell (NNYS) structure. After long-term 1000 cycles at 2 A g−1, the NNYS FeP anode shows a good capacity of 560 mA h g−1, and a coulombic efficiency of 99.8%. A recoverable rate-performance is also obtained after three rounds of tests. Furthermore, the capacities and coulombic efficiency remain stable at temperatures of −10 °C and 45 °C, respectively, indicating good potential for use under different conditions.
Introduction
Li-ion batteries (LIBs) are used widely because of their advantages including high working voltage, small self-discharge, good energy-density, non-memory effect, etc.1–4 Nevertheless, the low capacity of graphite anodes restrict the development of higher energy-density LIBs than currently available; while many high-capacity anode candidates suffer from a large volumetric change in charge–discharge, leading to fast capacity decay.5–7 In order to solve the issues, researchers are seeking emerging anodes.8–10 Transition metal compounds, such as oxides, sulfides and phosphides, which have high theoretical capacities, are considered as alternative anodes.11–14 Among them, phosphide anodes are promising. However, the large volumetric change and agglomeration during cycling reduce the cycle life and rate-performance.15,16It is considered that transition metal phosphates with a hollow structure can effectively alleviate the volumetric change during charge–discharge. Mo et al. prepared a carbon-coated NiCoP hollow nanoflower by a solvent reaction thermal method,17 showing a capacity of 819.4 mA h g−1 at 0.2 A g−1. Du and co-workers reported Ni2P nanoparticles in carbon nanofibers,18 which delivered a capacity of 850 mA h g−1 after cycling 450 times at 0.2 A g−1. However, some hollow structures such as hollow spheres are non-efficient for the rapid transport of electrons and ions. One-dimensional (1D) structures improve the transport efficiency of ions and electrons; however, the change in volume still needs more investigation. Chen et al. developed a core–shell CoP@N-doped carbon@TiO2 with a carbon framework, which alleviated the volumetric change of CoP particles.19 The composite exhibited a capacity of 706 mA h g−1 after 200 cycles. So far, since the common preparation approaches are complicated, the development of 1D yolk–shell anodes remains a challenge.
Here, we develop a novel 1D nanosphere-in-nanotube yolk–shell (NNYS) FeP as a high-performance anode. As shown in Fig. 1, at first, Fe3O4 nanospheres were synthesized hydrothermally, which were subsequently aligned by in situ coating of SiO2. After that, FeOOH was grown on the 1D Fe3O4@SiO2, forming Fe3O4@SiO2@FeOOH which was then etched by a basic solution to remove SiO2. The yolk–shell Fe3O4@void@FeOOH was phosphatized by a thermal treatment,20–22 finally forming NNYS FeP. It possesses the following features: the 1D structure improves the transport of electrons and ions compared to the common yolk–shell spheres, which enhances the rate-performance and the voids in the yolk–shell structure accommodate the volumetric change, reducing the capacity decay efficiently. The results show that the prepared NNYS FeP anode exhibits good electrochemical performance including a stable capacity after 1000 cycles, low- and high-temperature tolerance, and a reversible rate-performance.
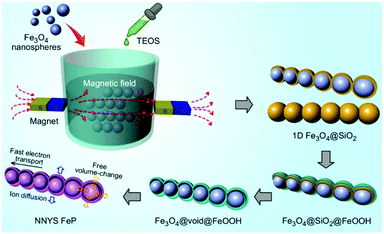 | ||
| Fig. 1 The preparation process of the NNYS FeP through a magnetic field-assisted and templated approach. | ||
Experimental section
Synthesis of Fe3O4 nanospheres
Typically, 4.3 g of FeCl3·6H2O, 4 g of NaAc and 1.0 g of trisodium citrate dehydrate were dispersed in ethylene glycol to form a 70 mL solution. Then, it was placed in a Teflon-lined stainless steel autoclave and kept at 200 °C for 10 h. Finally, the as-obtained sample was collected, washed, and dried for further use.Preparation of 1D Fe3O4@SiO2
The Fe3O4 nanospheres (0.05 g) obtained above were ultrasonically dispersed in anhydrous ethanol (240 mL), and ammonia (30 mL) was added to it under strong stirring for 10 min. Then, 2 mL of tetraethylorthosilicate (TEOS) was added drop by drop and stirred for 15 min under low mechanical agitation (350 rpm). The solution was placed in a static magnetic field for 100 s. Finally, the solution was left for 12 h, washed and dried in an oven.Synthesis of yolk–shell Fe3O4@void@FeOOH
The Fe3O4@SiO2 (0.1 g) was ultrasonically dispersed in 40 mL of deionized water, and then iron acetylacetone (0.2 g) and urea (1.0 g) were added to it. After dispersion for 5 min, they were transferred into an autoclave and maintained at 160 °C for 6 h. Then, the sample was added to 25 mL of H2O and 10 mL of NH3·H2O. The solution was hydrothermally treated at 150 °C for 8 h to remove SiO2.Preparation of NNYS FeP
Typically, NaH2PO2·H2O (1.0 g) was placed in a ceramic boat upstream in a tube furnace, while another boat containing 50 mg of Fe3O4@void@FeOOH was placed downstream. The sample was calcined at 350 °C for 1 h under an argon gas atmosphere.Characterization
Field-emission scanning electron microscopy (SEM, Hitachi S-8100) and high-resolution transmission electron microscopy (HRTEM, HT-7700) were employed to observe the samples. The X-ray diffraction (XRD) pattern was recorded using a Bruker D8 X-ray diffractometer. A Micromeritics ASAP 2460 analyser was used to measure the specific surface area and pore-size distribution. X-ray photoelectron spectroscopy (XPS, ESCALAB 250) was used to study the composition.Electrochemical tests
The electrochemical properties of NNYS FeP were evaluated using a coin cell system. All cells were assembled in a glove box. The sample (65 wt%), conductive carbon black (25 wt%) and binder (CMC, 10 wt%) were mixed and coated on Cu foil. After drying in a vacuum oven at 80 °C for 12 h, they were cut into 12 mm-diameter discs. The loading of the NNYS FeP anode was 1 mg cm−2. The electrolyte contained 1 M LiPF6 in ethylene carbonate and diethyl carbonate (volume ratio = 1![[thin space (1/6-em)]](https://www.rsc.org/images/entities/char_2009.gif) :
:![[thin space (1/6-em)]](https://www.rsc.org/images/entities/char_2009.gif) 1). The electrochemical performance of the cells was measured using a CT-4008 tester (Shenzhen Neware Technology Co., Ltd). Cyclic voltammetry (CV) profiles and electrochemical impedance spectra (EIS) were recorded using an electrochemical workstation (CHI-660E).
1). The electrochemical performance of the cells was measured using a CT-4008 tester (Shenzhen Neware Technology Co., Ltd). Cyclic voltammetry (CV) profiles and electrochemical impedance spectra (EIS) were recorded using an electrochemical workstation (CHI-660E).
Results and discussion
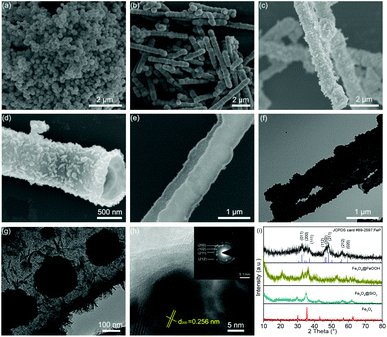
Fig. 2a shows the Fe3O4 nanospheres with a diameter of 200 nm synthesized through a hydrothermal route. In Fig. 2b, the SEM image of Fe3O4@SiO2 shows a 1D structure formed by Fe3O4 nanospheres. The formation mechanism is as follows: under a magnetic field, Fe3O4 nanospheres self-assemble along the direction of magnetic force, and then the formed 1D structure is fixed by in situ coating SiO2 by the hydrolysis of TEOS. The TEM images of Fe3O4@SiO2 in Fig. S1 (ESI)† show that the thickness of the SiO2 layer is about 100 nm. Fig. 2c shows the SEM image of Fe3O4@SiO2@FeOOH. The Fe3O4@SiO2@FeOOH after manually breaking by grinding (Fig. S2a and b, ESI)† shows that the FeOOH layer is 50 nm-thick, approximately. Fig. S2c and d (ESI)† show that the Fe3O4 nanospheres are connected by SiO2 with the FeOOH layer as a shell. The yolk–shell Fe3O4@void@FeOOH after etching SiO2 using an ammonia solution is shown in Fig. 2d and Fig. S3 (ESI).† The 1D yolk–shell structure is well maintained after thermal phosphorization, as shown in Fig. 2e and Fig. S4 (ESI).†Fig. 2f and g show a shell thickness of about 50 nm. The HRTEM image (Fig. 2h) shows that the distance of the lattice is 0.256 nm, which corresponds to the (200) plane of FeP. The inset SAED diagram exhibits four diffraction rings, which match with the (200), (102), (211), and (212) lattice planes of FeP, respectively, further confirming the XRD results. In addition, Fe3O4 (Fig. S5a, ESI),† Fe3O4@SiO2@FeOOH (Fig. S5b, ESI),† and yolk–shell FeP nanospheres (Fig. S5c and d, ESI)† were prepared by the same method, which were used as control materials for electrochemical performance evaluation. The XRD patterns (Fig. 2i) are assigned to the Joint Committee on Powder Diffraction standards card #79-0417 (Fe3O4), #81-0464 (FeOOH), and #89-2597 (FeP), respectively. The line-scanning image of the NNYS FeP is shown in Fig. 3a. Fig. 3b and c show the elemental distribution of Fe and P. The line-scanning curves (Fig. 3d) indicate an equal stoichiometric ratio between Fe and P.
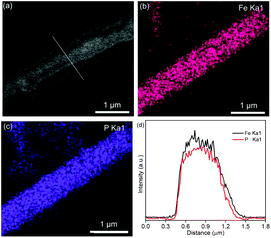 | ||
| Fig. 3 (a) SEM and (b and c) mapping images of the NNYS FeP. (d) The corresponding line-scanning profiles. | ||
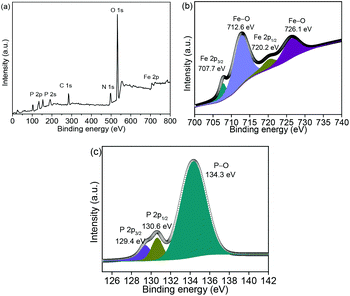
Fig. 4a shows the Fe 2p, O 1s, N 1s, C 1s, P 2s, and P 2p spectra in the XPS survey spectrum. The XPS spectrum of Fe 2p (Fig. 4b) shows two small peaks at 707.7 and 720.2 eV, which correspond to the Fe 2p3/2 and Fe 2p1/2 in FeP, respectively.23–25 The other peaks at 712.6 and 726.1 eV are related to the surface oxidation because of sample exposure in air. The peaks at 129.4 and 130.6 eV are associated with P 2p3/2 and P 2p1/2, respectively, as shown in Fig. 4c. The peak at 134.3 eV orginates from the P–O bond on the surface exposed to air.26–28 Fig. S6 (ESI)† shows that the BET surface area is 16.6 m2 g−1; while several mesopores of approximately 2–4 nm are detected in the NNYS FeP, which are significant for the electrolyte penetration.29–32
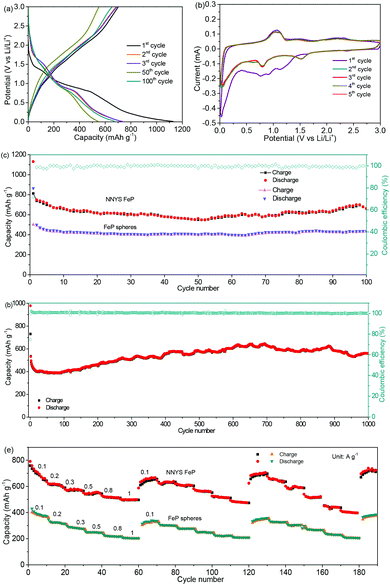
The galvanostatic charge and discharge profiles at 0.5 A g−1 are presented in Fig. 5a. The capacities of the NNYS FeP anode at the 1st, 2nd, 3rd, 50th, and 100th cycles are 1130, 748, 739, 561, and 661 mA h g−1, respectively. The first five CV curves are shown in Fig. 5b. At the initial cathodic scan, three reduction peaks were observed at 0.76, 0.92, and 1.14 V, which correspond to the insertion of Li+ in FeP to form LixFeP:33–35
| FeP + xLi+ + xe− ↔ LixFeP (x = 0 – 3). | (1) |
The cathodic peak at 0.52 V is assigned to the reduction of LixFeP to Fe and Li3P:
| LixFeP + (3 − x)Li+ + (3 − x)e− ↔ Fe + Li3P, | (2) |
After cycling 100 times at 0.5 A g−1, the NNYS FeP shows a capacity of 661 mA h g−1 and a coulombic efficiency of 99.8%, as shown in Fig. 5c. The cycling performance is much better compared to the yolk–shell FeP nanospheres. The long-term cycling performance is presented in Fig. 5d. After 1000 cycles at 2 A g−1, the capacity is maintained at 560 mA h g−1, and the coulombic efficiency exceeds 99.6%. It is considered that the initial capacity loss is ascribed to the non-stable SEI film formation.42,43 Because the activity of nanomaterials is activated gradually,44 the capacity increases slightly. Fig. S7 (ESI)† shows the corresponding charge–discharge curves. In Fig. 5e, the rate-performance was tested three times by changing the current rates from 0.1 to 0.2, 0.3, 0.5, 0.8, and 1 A g−1. The capacity of the NNYS FeP recovers to 697 mA h g−1 when the rate is returned to 0.1 A g−1 after cycling three times. Moreover, the rate-performance of the NNYS FeP is better compared to the yolk–shell FeP nanospheres, which is ascribed to the 1D structure that improves the transport of electrons and ions. The FeP anode exhibits a good rate-performance upon three rounds of cycling at 1, 1.5, 2, 2.5, and 3 A g−1 as shown in Fig. S8 and S9 (ESI),† indicating that the capacity shows good recoverability even at high rates. In addition, the good electrochemical performance of the NNYS FeP is compared to some FeP-based anodes (Table S1, ESI).†
For the evaluation of the electrochemical performance under different conditions, the anode was measured at charge/discharge rates of 0.3/0.6 A g−1 and 0.6/0.3 A g−1. Fig. 6a and b show the capacities of 806 and 827 mA h g−1, and coulombic efficiencies of 99.2% and 99.7%, respectively. The stable performance at different charging/discharging rates would be important for the practical applications of power management systems for secondary batteries, which would be able to achieve a prolonged cycling life and a high real capacity. The electrochemical stability of the NNYS FeP at different temperatures is also studied. In Fig. 7a, the capacities are 463 and 514 mA h g−1 at −10 °C and 45 °C after cycling 100 times at 0.2 A g−1, respectively. After cycling 300 times at 0.5 A g−1 (Fig. 7b), the capacities are 420 and 452 mA h g−1 at −10 °C and 45 °C, respectively. Stable electrochemical properties at different rates and temperatures indicate an applicable potential.
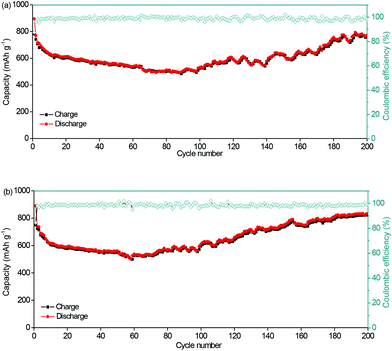 | ||
| Fig. 6 Cycling performance of the NNYS FeP anode at charge/discharge rates of (a) 0.3/0.6 A g−1 and (b) 0.6/0.3 A g−1. | ||
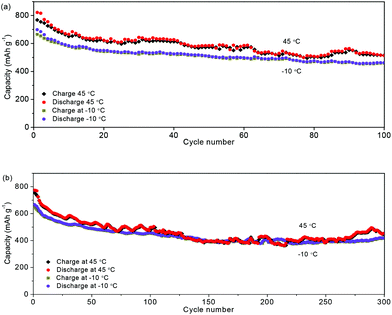 | ||
| Fig. 7 Capacities of the NNYS FeP cycling at −10 °C and 45 °C at different rates: (a) 0.2 A g−1 and (b) 0.5 A g−1. | ||
The EIS spectra at different discharge–charge potentials are shown in Fig. 8. Fig. 8a shows the potentials corresponding to the EIS spectra. In Fig. 8b, the total resistances (Rtot) are equal to the sum of the interface and the charge transfer resistance.45,46Fig. 8c shows the Nyquist plots within one cycle at different charging and discharging potentials, and the insets show the equivalent circuit. At the initial stage, the increasing Rtot is ascribed to the SEI formation, and then it decreases as the discharging potential decreases.47 The initially high value is caused by the oxidation reaction, which occurs during the charging process.48 Subsequently, the resistance increases depending on the increase of the potential, as shown in Table S2 (ESI).† Fig. S10 (ESI)† shows the EIS spectra of the NNYS FeP and yolk–shell FeP spheres before and after cycling. The inset shows the fitted equivalent circuits. Compared to the FeP nanosphere anode (169.8 Ω), the charge transfer resistance of the NNYS FeP anode is 71.1 Ω (Fig. S10a, ESI†). Fig. S10b (ESI)† shows that the resistance of NNYS FeP increases to 123.8 Ω after 100 cycles, while that of the FeP nanospheres increases to 287.1 Ω.
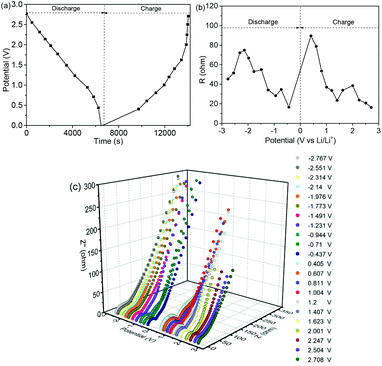 | ||
| Fig. 8 (a) Potentials for recording EIS spectra. (b) Relationship of Rtotvs. potential. (c) EIS Nyquist plots at one cycle. | ||
The CV profiles of the NNYS FeP at rates ranging from 0.1 to 1.0 mV s−1 are shown in Fig. 9a. The equations, i = avb and log(i) = b![[thin space (1/6-em)]](https://www.rsc.org/images/entities/char_2009.gif) log(v) + log(a), where i and v are the peak current and rate, respectively, indicate the capacitive and diffusion-controlled behaviors.49–51 When the variable parameter b is 0.5, it indicates a diffusion-controlled process. In contrast, when b is 1, it shows a capacitive response.52,53 In Fig. 9b, the fitted b values are 0.7672, 0.7863, 0.9383, and 0.8298, respectively, indicating a high capacitive contribution to lithium storage.54Fig. 9c shows the contribution of capacitance and diffusion that can be quantified using the equation: i (V) = k1v + k2v1/2, indicating that the ratio of the contribution increases as the scanning rate increases.55 The NNYS structure provides rapid kinetics for the capacitive contribution. Additionally, Fig. 9d shows the currents of anodic and cathodic peaks fitted to the square root of rate. The diffusion coefficient DLi+ is further calculated based on Ip = 2.6 × 10⁵n3/2AD1/2Cv1/2, where n is the electrode area and A stands for the effective area of the disc-like electrode in contact with the electrolyte. The diffusion coefficients are 4.107 × 10⁻¹⁴, 6.09 × 10⁻¹⁴, 4.415 × 10⁻¹⁴, and 6.869 × 10⁻¹⁴ cm2 s−1, respectively, which indicate that the NNYS FeP anode has good diffusivity.56,57
log(v) + log(a), where i and v are the peak current and rate, respectively, indicate the capacitive and diffusion-controlled behaviors.49–51 When the variable parameter b is 0.5, it indicates a diffusion-controlled process. In contrast, when b is 1, it shows a capacitive response.52,53 In Fig. 9b, the fitted b values are 0.7672, 0.7863, 0.9383, and 0.8298, respectively, indicating a high capacitive contribution to lithium storage.54Fig. 9c shows the contribution of capacitance and diffusion that can be quantified using the equation: i (V) = k1v + k2v1/2, indicating that the ratio of the contribution increases as the scanning rate increases.55 The NNYS structure provides rapid kinetics for the capacitive contribution. Additionally, Fig. 9d shows the currents of anodic and cathodic peaks fitted to the square root of rate. The diffusion coefficient DLi+ is further calculated based on Ip = 2.6 × 10⁵n3/2AD1/2Cv1/2, where n is the electrode area and A stands for the effective area of the disc-like electrode in contact with the electrolyte. The diffusion coefficients are 4.107 × 10⁻¹⁴, 6.09 × 10⁻¹⁴, 4.415 × 10⁻¹⁴, and 6.869 × 10⁻¹⁴ cm2 s−1, respectively, which indicate that the NNYS FeP anode has good diffusivity.56,57
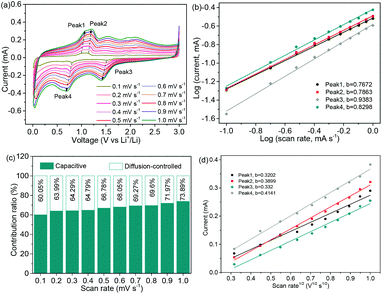 | ||
| Fig. 9 (a) CV profiles of the NNYS FeP at a series of rates. (b) Plots of log (i) vs. log (v). (c) Contribution ratios. (d) Plots of peak currents vs. square root of rates. | ||
In addition, SEM and TEM were conducted on the post-cycled samples, while XPS was also performed. Fig. S11 (ESI)† shows that the NNYS structure remains robust after cycling 100 times. The XPS spectrum of the post-cycled NNYS FeP exhibits the Fe, P, and C peaks, as shown in Fig. 10a. The Fe 2p spectrum (Fig. 10b) shows four peaks at 710.2, 714.6, 719.1, and 724.4 eV, corresponding to Fe 2p3/2, Fe–O, Fe 2p1/2, and Fe–O, respectively. In Fig. 10c, the three peaks of P 2p at 129.6, 130.6, and 133.1 eV are assigned to P 2p3/2, P 2p1/2, and P–O, respectively. The C 1s spectrum is presented in Fig. 10d, which would be from the carbon black and sodium carboxymethyl cellulose binder.
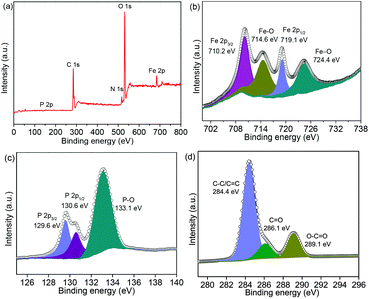 | ||
| Fig. 10 XPS spectra of the NNYS FeP after 100 cycles at 0.2 A g−1: (a) survey spectrum, (b) Fe 2p, (c) P 2p, and (d) C 1s. | ||
Conclusions
In summary, we develop a novel NNYS FeP anode, which shows a long cycle life of 1000 cycles, a stable coulombic efficiency exceeding 99.8%, and a recoverable rate-performance. Moreover, the NNYS FeP exhibits stable electrochemical performance during the charge–discharge at −10 °C and 45 °C, showing significant potential for use in real environments. The improved performance is attributed to the special NNYS structure, which improves the electron and ion transport, and provides an appropriate space enabling the free volumetric change during charge–discharge. It is expected that the NNYS engineering design presented here and the high electrochemical performance enable it to find important applications for developing emerging energy-storage materials and secondary battery systems.Conflicts of interest
There are no conflicts to declare.Acknowledgements
This work was supported by the Science and Technology Major Project of Anhui Province (18030901093), the Key Research and Development Program of Wuhu (2019YF07), the Natural Science Research Project for Universities in Anhui Province (KJ2018ZD034), and the National Natural Science Foundation of China (21776121).Notes and references
- Q. Liu, B. Xiao, J.-B. Cheng, Y. C. Li, Q. Z. Li, W. Z. Li, X. f. Xu and X. F. Yu, ACS Appl. Mater. Interfaces, 2018, 10, 37135–37141 CrossRef CAS PubMed.
- M. Agostini, S. Brutti and J. Hassoun, ACS Appl. Mater. Interfaces, 2016, 8, 10850–10857 CrossRef CAS PubMed.
- G. Lombardo, B. Ebin, M. R. St. J. Foreman, B. M. Steenari and M. Petranikova, ACS Sustainable Chem. Eng., 2019, 7, 13668–13679 CrossRef CAS.
- D. Jin, H. Kang, H. W. Do, G. Kim, T. Kim, S. Kim, S. Choi, J. Won, I. Park, K. Jung and W. Shim, Nano Lett., 2021, 21, 5345–5352 CrossRef CAS PubMed.
- Z. H. Xie, M. Z. Rong and M. Q. Zhang, ACS Appl. Mater. Interfaces, 2021, 13, 28737–28748 CrossRef CAS PubMed.
- X. Han, Z. Zhang, H. Chen, Q. Zhang, S. Chen and Y. Yang, ACS Appl. Mater. Interfaces, 2020, 12, 44840–44849 CrossRef CAS PubMed.
- G. Shao, D. A. H. Hanaor, J. Wang, D. Kober, S. Li, X. Wang, X. Shen, M. F. Bekheet and A. Gurlo, ACS Appl. Mater. Interfaces, 2020, 12, 46045–46056 CrossRef CAS PubMed.
- S. Venkateshwaran, T. Partheeban, M. Sasidharan and S. M. Senthil Kumar, Energy Fuels, 2021, 35, 2683–2691 CrossRef CAS.
- A. F. Harper, M. L. Evans and A. J. Morris, Chem. Mater., 2020, 32, 6629–6639 CrossRef CAS PubMed.
- S. K. Sundriyal and Y. Sharma, Appl. Surf. Sci., 2021, 560, 150055 CrossRef CAS.
- Y. Yang, H.-R. Yang, H. Seo, K. Kim and J.-H. Kim, J. Alloys Compd., 2021, 872, 159640 CrossRef CAS.
- Z. Liu, J. Chen, X. Fan, Y. Pan, Y. Li, L. Ma, H. Zhai and L. Xu, J. Alloys Compd., 2021, 871, 159531 CrossRef CAS.
- S. Wan, X. Liu, L. Fu, C. Zhou, H. Chen, G. Li, S. Cao and Q. Liu, J. Alloys Compd., 2021, 870, 159407 CrossRef CAS.
- Y. H. Kwon, K. Minnici, J. J. Park, S. R. Lee, G. Zhang, E. S. Takeuchi, K. J. Takeuchi, A. C. Marschilok and E. Reichmanis, J. Am. Chem. Soc., 2018, 140, 5666–5669 CrossRef CAS PubMed.
- M. Mousavi, R. Abolhassani, M. Hosseini, E. Akbarnejad, M. H. Mojallal, S. Ghasemi, S. Mohajerzadeh and Z. Sanaee, Nanotechnology, 2021, 32, 285403 CrossRef CAS PubMed.
- Z. Yang, Y. Du, Y. Yang, H. Jin, H. Shi, L. Bai, Y. Ouyang, F. Ding, G. Hou and F. Yuan, J. Power Sources, 2021, 497, 229906 CrossRef CAS.
- Y. Mo, J. Liu, L. Zhong, M. Xiao, S. Ren, D. Han, S. Wang and Y. Meng, ACS Appl. Nano Mater., 2019, 2, 6880–6888 CrossRef CAS.
- Z. Du, W. Ai, J. Yang, Y. Gong, C. Yu, J. Zhao, X. Dong, G. Sun and W. Huang, ACS Sustainable Chem. Eng., 2018, 6, 14795–14801 CrossRef CAS.
- K. Chen, H.-N. Guo, W.-Q. Li and Y.-J. Wang, Chem. – Asian J., 2021, 16, 322–328 CrossRef CAS.
- L. Ni, G. Chen, X. Liu, J. Han, X. Xiao, N. Zhang, S. Liang, G. Qiu and R. Ma, ACS Appl. Energy Mater., 2019, 2, 406–412 CrossRef CAS.
- C. Zhang, G. Park, B. J. Lee, L. Xia, H. Miao, J. Yuan and J.-S. Yu, ACS Appl. Mater. Interfaces, 2021, 13, 23714–23723 CrossRef CAS PubMed.
- E. Pan, Y. Jin, C. Zhao, M. Jia, Q. Chang, M. Jia, L. Wang and X. He, ACS Appl. Energy Mater., 2019, 2, 1756–1764 CrossRef CAS.
- F. Yang, X. Chen, Z. Li, D. Wang, L. Liu and J. Ye, ACS Appl. Energy Mater., 2020, 3, 3577–3585 CrossRef CAS.
- J. Li and J. Lin, Mater. Lett., 2018, 221, 289–292 CrossRef CAS.
- Y. Wang, C. Du, Y. Sun, G. Han, F. Kong, G. Yin, Y. Gao and Y. Song, Electrochim. Acta, 2017, 254, 36–43 CrossRef CAS.
- L. Yang, D. Liu, S. Hao, F. Qu, R. Ge, Y. Ma, G. Du, A. M. Asiri, L. Chen and X. Sun, Anal. Chem., 2017, 89, 2191–2195 CrossRef CAS PubMed.
- M. Wang, Y. Tuo, X. Li, Q. Hua, F. Du and L. Jiang, ACS Sustainable Chem. Eng., 2019, 7, 12419–12427 CAS.
- W. Li, B. Yan, H. Fan, C. Zhang, H. Xu, X. Cheng, Z. Li, G. Jia, S. An and X. Qiu, ACS Appl. Mater. Interfaces, 2019, 11, 22364–22370 CrossRef CAS PubMed.
- M. Ma, L. Cao, K. Yao, J. Li, K. Kajiyoshi and J. Huang, ACS Sustainable Chem. Eng., 2021, 9, 5315–5321 CrossRef CAS.
- L. Han, M. Zhang, H. Wang, P. Li, W. Wei, J. Shi, M. Huang, Z. Shi, W. Liu and S. Chen, Nanoscale, 2020, 12, 24477–24487 RSC.
- S. Shi, Z. Li, L. Shen, X. Yin, Y. Liu, G. Chang, J. Wang, S. Xu, J. Zhang and Y. Zhao, Energy Storage Mater., 2020, 29, 78–83 CrossRef.
- Z. Zhang, C. Wu, Z. Chen, H. Li, H. Cao, X. Luo, Z. Fang and Y. Zhu, J. Mater. Chem. A, 2020, 8, 3369–3378 RSC.
- X. Wang, K. Chen, G. Wang, X. Liu and H. Wang, ACS Nano, 2017, 11, 11602–11616 CrossRef CAS PubMed.
- F. Han, C. Zhang, J. Yang, G. Ma, K. He and X. Li, J. Mater. Chem. A, 2016, 4, 12781–12789 RSC.
- S. Boyanov, J. Bernardi, F. Gillot, L. Dupont, M. Womes, J. M. Tarascon, L. Monconduit and M. L. Doublet, Chem. Mater., 2006, 18, 3531–3538 CrossRef CAS.
- Q. Wang, B. Wang, Z. Zhang, Y. Zhang, J. Peng, Y. Zhang and H. Wu, Inorg. Chem. Front., 2018, 5, 2605–2614 RSC.
- F. Yang, H. Gao, J. Hao, S. Zhang, P. Li, Y. Liu, J. Chen and Z. Guo, Adv. Funct. Mater., 2019, 29, 1808291 CrossRef.
- L. Gao, T. Ma, L. Zhang and X. Yang, J. Solid State Electrochem., 2021, 25, 2055–2063 CrossRef CAS.
- C. Lin, R. Hu, J. Liu, L. Yang, J. Liu, L. Ouyang and M. Zhu, J. Alloys Compd., 2018, 763, 296–304 CrossRef CAS.
- P. Zhu, Z. Zhang, S. Hao, B. Zhang, P. Zhao, J. Yu, J. Cai, Y. Huang and Z. Yang, Carbon, 2018, 139, 477–485 CrossRef CAS.
- Z. Li and L. Yin, J. Mater. Chem. A, 2015, 3, 21569–21577 RSC.
- Q. Lian, G. Zhou, J. Liu, C. Wu, W. Wei, L. Chen and C. Li, J. Power Sources, 2017, 366, 1–8 CrossRef CAS.
- X. Sun, C. Yan, Y. Chen, W. Si, J. Deng, S. Oswald, L. Liu and O. G. Schmidt, Adv. Energy Mater., 2014, 4, 1300912 CrossRef.
- Z. Zheng, H.-H. Wu, H. Liu, Q. Zhang, X. He, S. Yu, V. Petrova, J. Feng, R. Kostecki, P. Liu, D. L. Peng, M. Liu and M. S. Wang, ACS Nano, 2020, 14, 9545–9561 CrossRef CAS PubMed.
- J. Yang, E. Fan, J. Lin, F. Arshad, X. Zhang, H. Wang, F. Wu, R. Chen and L. Li, ACS Appl. Energy Mater., 2021, 4, 6261–6268 CrossRef CAS.
- H. Chen, P. He, M. Li, Y. Wen, G. Cao, J. Qiu, H. Ming, P. Zhao and S. Zhang, ACS Appl. Energy Mater., 2021, 4, 5963–5972 CrossRef CAS.
- X. Lin, J. Liu, H. Zhang, Y. Zhong, M. Zhu, T. Zhou, X. Qiao, H. Zhang, T. Han and J. Li, Adv. Sci., 2021, 8, 2002298 CrossRef CAS PubMed.
- J. Liu, Y. Ding, T. Han, J. Long, X. Pei, Y. Luo, W. Bao, X. Lin and H. Zhang, Chem. Commun., 2020, 56, 2618–2621 RSC.
- M. Cheng, T. Han, M. Zhang, H. Zhang, B. Sun, S. Zhu, M. Zhai, Y. Wu and J. Liu, Appl. Surf. Sci., 2020, 513, 145887 CrossRef CAS.
- J. Liu, J. Long, Z. Shen, X. Jin, T. Han, T. Si and H. Zhang, Adv. Sci., 2021, 8, 2004689 CrossRef CAS PubMed.
- M. Zhu, C. Yang, T. Han, C. Hu, Y. Wu, T. Si and J. Liu, Mater. Chem. Front., 2021, 5, 4565–4570 RSC.
- Z. Han, X. Li, Q. Li, H. Li, J. Xu, N. Li, G. Zhao, X. Wang, H. Li and S. Li, ACS Appl. Mater. Interfaces, 2021, 13, 6265–6275 CrossRef CAS PubMed.
- K. Chu, Z. Li, S. Xu, G. Yao, Y. Xu, P. Niu and F. Zheng, Dalton Trans., 2020, 49, 10808–10815 RSC.
- N. Sharma, S. Szunerits, R. Boukherroub, R. Ye, S. Melinte, M. O. Thotiyl and S. Ogale, ACS Appl. Energy Mater., 2019, 2, 4450–4457 CrossRef CAS.
- S. Huang, D. Tie, M. Wang, B. Wang, P. Jia, Q. Wang, G. Chang, J. Zhang and Y. Zhao, ACS Sustainable Chem. Eng., 2019, 7, 740–747 CrossRef CAS.
- D. Narsimulu, S. Ghosh, M. Bhar and S. K. Martha, J. Electrochem. Soc., 2019, 166, A2629–A2635 CrossRef CAS.
- B. Zhao, D. Song, Y. Ding, J. Wu, Z. Wang, Z. Chen, Y. Jiang and J. Zhang, Nanoscale, 2020, 12, 3941–3949 RSC.
Footnote |
| † Electronic supplementary information (ESI) available: Supplementary figures and table. See DOI: 10.1039/d1nr05294b |
| This journal is © The Royal Society of Chemistry 2021 |

